
96MB Low End VPS Review Part XIX – BitCable
Circus was the first one to comment on the post regarding getting a 96MB review for one of the providers, so although this was not exactly as per my schedule, I decide to offer circus what he wants first, a review on BitCable.
General Information and Set Up
It is pretty tough for me to find some information on BitCable, although their domain has been registered last year according to here and here to Global IT Tech LLC, there has not been too many reviews floating around. Circus was quick to point out that the company is run by a high school student.
The website carries a very minimalistic design, everything was kept clean and straight-forward, which is something that I personally like:

There are only two product lines offered by BitCable: Shared and VPS hosting, and for VPS hosting, only KVM platform are offered. The sign up page in VPS hosting is using the unintegrated WHMCS installation with HTTPS connection.
Unlike most of the VPS providers these days, the provision of BitCable VPS is not instant. However, Preetam actually contacted me barely 7 minutes after my invoice was paid (paid at 3:38AM, received email at 3:45AM) and explained to me that “SolusVM does not optimize for KVM servers” and hence he will have to know what OS I am looking for before set it up for me. However, I did not receive the automated new server information email until 5:45AM as well although Preetam has sent me the IP and root password by 5:10AM.
In the automated welcome email, the IP address and root password did not show, only the SolusVM login details was available and password was sent in plain text. However, I was able to get the IP address by logging into SolusVM using the username and password I was assigned to, via a HTTP connection on the port 5353.
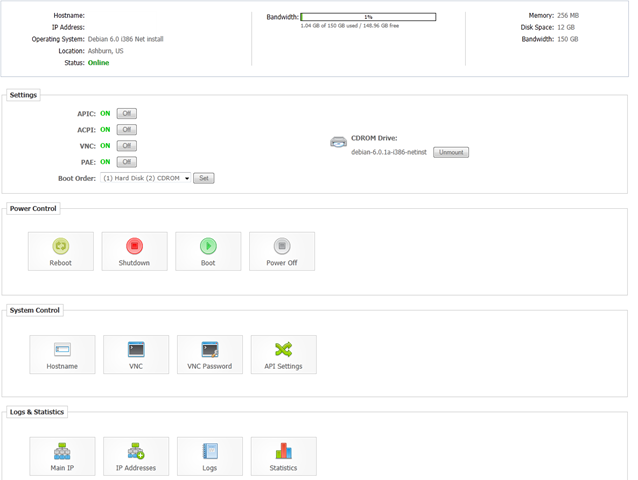
Once logged in, you are presented with a standard interface for SolusVM for KVM machines:
There are several OS available for mount/install:
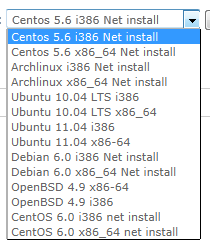
And BitCable has already mentioned in the welcome email that if there is a template they do not have, you can send in a ticket and they will add the OS template soon, which I guess is the biggest advantages to full virtualization technologies like KVM.
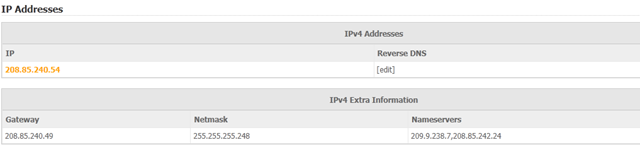
Instant rDNS is not possible, however the IP addresses does contain more network information if you decide to set up the system yourself:
As with most of other providers, both instant backup and central backups are not available.
If you prefer to control your VPS through WHMCS, there are also a few controls available in the client area, which is using HTTPS connection:
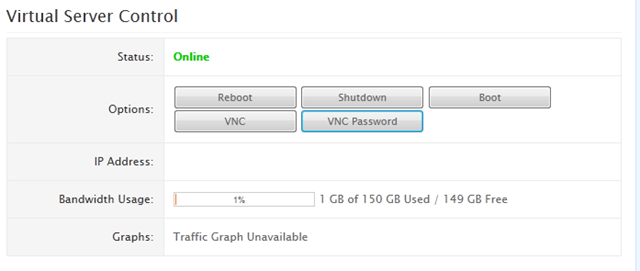
As you can see, only bandwidth usage percent bar is available and none of the graphs are available.
Test on the VPS
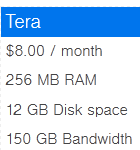
The test VPS that I have received is their cheapest Tera package, which is not exactly too cheap (although by using the coupon happybirthday! you get 50% off the price), and unlike most of the providers, BitCable offers no discount for longer term payments:

and here is what you get for 8 dollars:
Although BitCable is based in Ashburn, VA, it took me quite a bit of time to find where their data centre would be (although it is “local” according to this post), attempt to traceroute to their IP address was futile and the only information I have obtained by running IP whois is here:
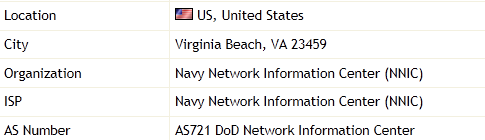
However, search for neither NNIC nor DOD (I even tried Department of Defence) NIC does not return any meaningful information and to be honest, I highly doubt that being a government agency, Navy or DOD would want to rent out their server rooms for cash.
I have loaded Debian 6 OS on the VPS:
uname -a
Linux bitcable 2.6.32-5-686 #1 SMP Mon Jun 13 04:13:06 UTC 2011 i686 GNU/Linux
The barebone OS, without anything loaded in there, takes 25MB of RAM:
 free -m
             total       used       free     shared    buffers     cached
Mem:           247        130        117          0          9         96
-/+ buffers/cache:         25        222
Swap:          487          0        487
And the corresponding top output:
top - 23:43:44 up 10:34,  2 users,  load average: 0.00, 0.00, 0.00
Tasks:  79 total,   1 running,  78 sleeping,   0 stopped,   0 zombie
Cpu(s):  0.0%us,  0.0%sy,  0.0%ni,100.0%id,  0.0%wa,  0.0%hi,  0.0%si,  0.0%st
Mem:    253944k total,   134248k used,   119696k free,     9228k buffers
Swap:   499704k total,        0k used,   499704k free,    98712k cached

  PID USER      PR  NI  VIRT  RES  SHR S %CPU %MEM    TIME+  COMMAND
 1440 ****      20   0  7868 5168 1460 S    0  2.0   0:00.34 bash
 1656 ****      20   0  7856 5160 1464 S    0  2.0   0:00.26 bash
 1653 root      20   0  8260 2788 2268 S    0  1.1   0:00.07 sshd
 1472 root      20   0  4504 1736 1388 S    0  0.7   0:00.02 bash
  977 root      20   0 27316 1500 1024 S    0  0.6   0:00.02 rsyslogd
 1655 ****      20   0  8260 1488  960 S    0  0.6   0:00.00 sshd
 1321 root      20   0  2560 1304 1020 S    0  0.5   0:00.05 login
 1471 root      20   0  3948 1176  944 S    0  0.5   0:00.04 su
 1683 ****      20   0  2332 1136  900 R    1  0.4   0:00.01 top
 1640 root      20   0  5496  984  592 S    0  0.4   0:00.00 sshd
 1297 Debian-e  20   0  6516  936  624 S    0  0.4   0:00.00 exim4
  364 root      16  -4  2392  852  420 S    0  0.3   0:00.02 udevd
  847 statd     20   0  1936  776  640 S    0  0.3   0:00.00 rpc.statd
 1064 root      20   0  3784  768  604 S    0  0.3   0:00.02 cron
  554 root      18  -2  2388  736  304 S    0  0.3   0:00.00 udevd
  555 root      18  -2  2388  732  300 S    0  0.3   0:00.00 udevd
    1 root      20   0  2032  704  612 S    0  0.3   0:00.90 init
After the LNMP stack is installed, memory footprint continued to be pretty light:
 free -m
             total       used       free     shared    buffers     cached
Mem:           247        239          8          0          7        183
-/+ buffers/cache:         48        199
Swap:          487          1        486
And the output of top:
top - 12:07:48 up 10:58,  2 users,  load average: 0.08, 0.50, 0.46
Tasks:  91 total,   1 running,  90 sleeping,   0 stopped,   0 zombie
Cpu(s):  0.0%us,  0.2%sy,  0.0%ni, 99.8%id,  0.0%wa,  0.0%hi,  0.0%si,  0.0%st
Mem:    253944k total,   245656k used,     8288k free,     8152k buffers
Swap:   499704k total,     1256k used,   498448k free,   187720k cached

  PID USER      PR  NI  VIRT  RES  SHR S %CPU %MEM    TIME+  COMMAND
 8645 www       20   0 14504  10m  408 S    0  4.2   0:00.00 nginx
19427 mysql     20   0 34808 5676 2996 S    0  2.2   0:00.00 mysqld
 1656 ****      20   0  7856 4860 1164 S    0  1.9   0:00.27 bash
 1440 ****      20   0  7868 4852 1160 S    0  1.9   0:00.34 bash
 8636 root      20   0 24200 4564 1400 S    0  1.8   0:00.02 php-cgi
 8637 www       20   0 24200 4172 1008 S    0  1.6   0:00.00 php-cgi
 8638 www       20   0 24200 4172 1008 S    0  1.6   0:00.00 php-cgi
 8639 www       20   0 24200 4172 1008 S    0  1.6   0:00.00 php-cgi
 8640 www       20   0 24200 4172 1008 S    0  1.6   0:00.00 php-cgi
 8641 www       20   0 24200 4172 1008 S    0  1.6   0:00.00 php-cgi
 1695 root      20   0  4488 1512 1180 S    0  0.6   0:00.00 bash
 1472 root      20   0  4504 1452 1104 S    0  0.6   0:00.02 bash
 1653 root      20   0  8260 1300  780 S    0  0.5   0:00.07 sshd
 8666 root      20   0  2436 1144  900 R    0  0.5   0:00.01 top
  977 root      20   0 27316 1132  788 S    0  0.4   0:00.02 rsyslogd
 1655 ****      20   0  8396 1024  484 S    0  0.4   0:01.03 sshd
 1321 root      20   0  2560  896  612 S    0  0.4   0:00.05 login
Disk space does not show signs of overselling:
 df -h
Filesystem            Size  Used Avail Use% Mounted on
/dev/mapper/main-root
                       12G  2.0G  8.8G  18% /
tmpfs                 124M     0  124M   0% /lib/init/rw
udev                  120M  112K  120M   1% /dev
tmpfs                 124M     0  124M   0% /dev/shm
/dev/vda1              92M   20M   67M  23% /boot
 df -i
Filesystem            Inodes   IUsed   IFree IUse% Mounted on
/dev/mapper/main-root
                      749248   74186  675062   10% /
tmpfs                  31743       5   31738    1% /lib/init/rw
udev                   30530     515   30015    2% /dev
tmpfs                  31743       1   31742    1% /dev/shm
/dev/vda1              24096     222   23874    1% /boot
VMStat shows the VPS is lightly used:
 vmstat
procs -----------memory---------- ---swap-- -----io---- -system-- ----cpu----
 r  b   swpd   free   buff  cache   si   so    bi    bo   in   cs us sy id wa
 0  0   1256   7096   8440 188864    0    0     8    32   22   20  1  0 99  0
The uptime snapshot was taken right after the LNMP stack was installed, so it showed some pretty high numbers:
uptime
 12:09:59 up 11:00,  2 users,  load average: 0.01, 0.32, 0.40
Running the command again while I am writing this gives all 0.00 for the output:
uptime
 08:07:27 up 4 days,  6:58,  1 user,  load average: 0.00, 0.00, 0.00
There are two CPU cores provided, although QEMU virtual CPU is all the information I can see, however, at 3.2GHz, the clock speed is definitely great:
cat /proc/cpuinfo
processor       : 0
vendor_id       : GenuineIntel
cpu family      : 6
model           : 6
model name      : QEMU Virtual CPU version 0.9.1
stepping        : 3
cpu MHz         : 3192.898
cache size      : 32 KB
fdiv_bug        : no
hlt_bug         : no
f00f_bug        : no
coma_bug        : no
fpu             : yes
fpu_exception   : yes
cpuid level     : 4
wp              : yes
flags           : fpu de pse tsc msr pae mce cx8 apic sep mtrr pge mca cmov pse3                                                                                                 6 clflush mmx fxsr sse sse2 syscall nx lm pni hypervisor
bogomips        : 6385.79
clflush size    : 64
cache_alignment : 64
address sizes   : 40 bits physical, 48 bits virtual
power management:

processor       : 1
vendor_id       : GenuineIntel
cpu family      : 6
model           : 6
model name      : QEMU Virtual CPU version 0.9.1
stepping        : 3
cpu MHz         : 3192.898
cache size      : 32 KB
fdiv_bug        : no
hlt_bug         : no
f00f_bug        : no
coma_bug        : no
fpu             : yes
fpu_exception   : yes
cpuid level     : 4
wp              : yes
flags           : fpu de pse tsc msr pae mce cx8 apic sep mtrr pge mca cmov pse3                                                                                                 6 clflush mmx fxsr sse sse2 syscall nx lm pni hypervisor
bogomips        : 6385.79
clflush size    : 64
cache_alignment : 64
address sizes   : 40 bits physical, 48 bits virtual
power management:
Meminfo, as with many others, does not offer any additional information:
cat /proc/meminfo
MemTotal:         253944 kB
MemFree:            5492 kB
Buffers:            3656 kB
Cached:           198484 kB
SwapCached:           72 kB
Active:            43824 kB
Inactive:         188124 kB
Active(anon):      14628 kB
Inactive(anon):    15300 kB
Active(file):      29196 kB
Inactive(file):   172824 kB
Unevictable:           0 kB
Mlocked:               0 kB
HighTotal:             0 kB
HighFree:              0 kB
LowTotal:         253944 kB
LowFree:            5492 kB
SwapTotal:        499704 kB
SwapFree:         498448 kB
Dirty:                12 kB
Writeback:             0 kB
AnonPages:         29740 kB
Mapped:             5400 kB
Shmem:               120 kB
Slab:              11076 kB
SReclaimable:       6752 kB
SUnreclaim:         4324 kB
KernelStack:         752 kB
PageTables:          824 kB
NFS_Unstable:          0 kB
Bounce:                0 kB
WritebackTmp:          0 kB
CommitLimit:      626676 kB
Committed_AS:     114736 kB
VmallocTotal:     766008 kB
VmallocUsed:        5796 kB
VmallocChunk:     750924 kB
HardwareCorrupted:     0 kB
HugePages_Total:       0
HugePages_Free:        0
HugePages_Rsvd:        0
HugePages_Surp:        0
Hugepagesize:       4096 kB
DirectMap4k:       12224 kB
DirectMap4M:      249856 kB
One thing that makes BitCable truly worth the price though is the disk I/O speed, which was in triple digit range and is truly impressive:
dd if=/dev/zero of=test bs=64k count=16k conv=fdatasync
16384+0 records in
16384+0 records out
1073741824 bytes (1.1 GB) copied, 9.96039 s, 108 MB/s
In order to avoid disk caching, I actually waited a few hours before running the dd test again, and the results are equally impressive:
 dd if=/dev/zero of=test bs=64k count=16k conv=fdatasync
16384+0 records in
16384+0 records out
1073741824 bytes (1.1 GB) copied, 10.1407 s, 106 MB/s
Pardon me for getting excited but it has been a while since I was able to see a triple digit disk I/O!
Network speed is almost equally impressive, I was able to achieve a download speed of more than 50MB/s, which is rare among the North American providers since most of the North American providers are only able to provide 100Mbit ports for their budget VPS:
 wget cachefly.cachefly.net/100mb.test
--2011-08-08 12:11:40--  http://cachefly.cachefly.net/100mb.test
Resolving cachefly.cachefly.net... 205.234.175.175
Connecting to cachefly.cachefly.net|205.234.175.175|:80... connected.
HTTP request sent, awaiting response... 200 OK
Length: 104857600 (100M) [application/octet-stream]
Saving to: a€?100mb.testa€

100%[======================================>] 104,857,600 55.2M/s   in 1.8s

2011-08-08 12:11:42 (55.2 MB/s) - a€?100mb.testa€
To test it even further, I actually used aget with 10 concurrent thread to test the download, and the job was completed within 1 second:
 aget -n 10 cachefly.cachefly.net/100mb.test
Error: URL should be of the form http://...
root@bitcable:~/aget-0.4.1# aget -n 10 http://cachefly.cachefly.net/100mb.test
 Attempting to read log file aget-100mb.test.log for resuming download job...
 Couldn't find log file for this download, starting a clean job...
 Head-Request Connection established
 Downloading /100mb.test (104857600 bytes) from site cachefly.cachefly.net(205.234.175.175:80). Number of Threads: 10
..                                                 [4% completed]
.....                                              [9% completed]
.....                                              [9% completed]
.....                                              [9% completed]
.......                                            [14% completed]
..........                                         [19% completed]
..........                                         [19% completed]
............                                       [24% completed]
............                                       [24% completed]
...............                                    [29% completed]
.................                                  [34% completed]
....................                               [39% completed]
....................                               [39% completed]
......................                             [44% completed]
.........................                          [49% completed]
...........................                        [54% completed]
...........................................................                     [59% completed]
.                     [59% completed]
................................                   [64% completed]
...................................                [69% completed]
.....................................              [74% completed]
........................................           [79% completed]
..........................................         [84% completed]
.............................................      [89% completed]
...............................................    [94% completed]
.................................................. [99% completed]
.................................................. [100% completed]
 Download completed, job completed in 1 seconds. (102400 Kb/sec)
 Shutting down...
Downloading was completed so fast for 100MB file that I had to look for a few 1GB files to test:
From HostDime DC in Orlando, Florida:
 aget -n 10 http://72.29.87.105/%7Ephpinfot/1gbfile.tgz
 Attempting to read log file aget-1gbfile.tgz.log for resuming download job...
 Couldn't find log file for this download, starting a clean job...
 Head-Request Connection established
 Downloading /%7Ephpinfot/1gbfile.tgz (1073741824 bytes) from site 72.29.87.105(72.29.87.105:80). Number of Threads: 10
..                                                 [4% completed]
.....                                              [9% completed]
.......                                            [14% completed]
.......                                            [14% completed]
.......                                            [14% completed]
..........                                         [19% completed]
............                                       [24% completed]
...............                                    [29% completed]
.................                                  [34% completed]
....................                               [39% completed]
......................                             [44% completed]
.........................                          [49% completed]
...........................                        [54% completed]
...........................                        [54% completed]
............................                        [54% completed]
...........................                        [54% completed]
...........................                        [54% completed]
...........................                        [54% completed]
...........................                        [54% completed]
...........................                        [54% completed]
...........................                        [54% completed]
..........................                        [54% completed]
..............................                     [59% completed]
................................                   [64% completed]
...................................                [69% completed]
.....................................              [74% completed]
........................................           [79% completed]
..........................................         [84% completed]
.............................................      [89% completed]
...............................................    [94% completed]
.................................................. [99% completed]
.................................................. [100% completed]
 Download completed, job completed in 100 seconds. (10485 Kb/sec)
 Shutting down...
And from thinkbroadband.com in UK:
 aget -n 10 http://download.thinkbroadband.com/1GB.zip
 Attempting to read log file aget-1GB.zip.log for resuming download job...
 Couldn't find log file for this download, starting a clean job...
 Head-Request Connection established
 Downloading /1GB.zip (1073741824 bytes) from site download.thinkbroadband.com(80.249.99.148:80). Number of Threads: 10
..                                                 [4% completed]
.....                                              [9% completed]
.......                                            [14% completed]
..........                                         [19% completed]
............                                       [24% completed]
...............                                    [29% completed]
.................                                  [34% completed]
....................                               [39% completed]
......................                             [44% completed]
.........................                          [49% completed]
...........................                        [54% completed]
..............................                     [59% completed]
................................                   [64% completed]
...................................                [69% completed]
.....................................              [74% completed]
........................................           [79% completed]
..........................................         [84% completed]
.............................................      [89% completed]
...............................................    [94% completed]
.................................................. [99% completed]
.................................................. [100% completed]
 Download completed, job completed in 44 seconds. (23831 Kb/sec)
 Shutting down...
Although not as fast as the Cachefly download, both download speed are quite impressive.
The upload speed is pretty good as well, from my BuyVM test VPS in Fremont, CA:
 wget 208.85.240.54/100mb.test
--2011-08-09 07:19:09--  http://208.85.240.54/100mb.test
Connecting to 208.85.240.54:80... connected.
HTTP request sent, awaiting response... 200 OK
Length: 104857600 (100M) [application/octet-stream]
Saving to: `100mb.test'

100%[======================================>] 104,857,600 4.96M/s   in 28s

2011-08-09 07:19:37 (3.59 MB/s) - `100mb.test' saved [104857600/104857600]
Nix Communication’s VPS in Montreal, Canada:
 wget 208.85.240.54/100mb.test
--2011-08-09 03:20:24--  http://208.85.240.54/100mb.test
Connecting to 208.85.240.54:80... connected.
HTTP request sent, awaiting response... 200 OK
Length: 104857600 (100M) [application/octet-stream]
Saving to: `100mb.test'

100%[======================================>] 104,857,600 10.5M/s   in 13s

2011-08-09 03:20:37 (7.90 MB/s) - `100mb.test' saved [104857600/104857600]
And finally Quickweb VPS in London, UK:
 wget 208.85.240.54/100mb.test
--2011-08-08 19:21:48--  http://208.85.240.54/100mb.test
Connecting to 208.85.240.54:80... connected.
HTTP request sent, awaiting response... 200 OK
Length: 104857600 (100M) [application/octet-stream]
Saving to: `100mb.test'

100%[======================================>] 104,857,600 11.7M/s   in 9.8s

2011-08-08 19:21:58 (10.2 MB/s) - `100mb.test' saved [104857600/104857600]
As you can see, the speed are more than sufficient for a budget VPS.
Given the hardware resources, it is not difficult to guess that the benchmark score are really good, first the UnixBench score:
  #    #  #    #  #  #    #          #####   ######  #    #   ####   #    #
   #    #  ##   #  #   #  #           #    #  #       ##   #  #    #  #    #
   #    #  # #  #  #    ##            #####   #####   # #  #  #       ######
   #    #  #  # #  #    ##            #    #  #       #  # #  #       #    #
   #    #  #   ##  #   #  #           #    #  #       #   ##  #    #  #    #
    ####   #    #  #  #    #          #####   ######  #    #   ####   #    #

   Version 5.1.3                      Based on the Byte Magazine Unix Benchmark

   Multi-CPU version                  Version 5 revisions by Ian Smith,
                                      Sunnyvale, CA, USA
   January 13, 2011                   johantheghost at yahoo period com

1 x Dhrystone 2 using register variables  1 2 3 4 5 6 7 8 9 10

1 x Double-Precision Whetstone  1 2 3 4 5 6 7 8 9 10

1 x Execl Throughput  1 2 3

1 x File Copy 1024 bufsize 2000 maxblocks  1 2 3

1 x File Copy 256 bufsize 500 maxblocks  1 2 3

1 x File Copy 4096 bufsize 8000 maxblocks  1 2 3

1 x Pipe Throughput  1 2 3 4 5 6 7 8 9 10

1 x Pipe-based Context Switching  1 2 3 4 5 6 7 8 9 10

1 x Process Creation  1 2 3

1 x System Call Overhead  1 2 3 4 5 6 7 8 9 10

1 x Shell Scripts (1 concurrent)  1 2 3

1 x Shell Scripts (8 concurrent)  1 2 3

2 x Dhrystone 2 using register variables  1 2 3 4 5 6 7 8 9 10

2 x Double-Precision Whetstone  1 2 3 4 5 6 7 8 9 10

2 x Execl Throughput  1 2 3

2 x File Copy 1024 bufsize 2000 maxblocks  1 2 3

2 x File Copy 256 bufsize 500 maxblocks  1 2 3

2 x File Copy 4096 bufsize 8000 maxblocks  1 2 3

2 x Pipe Throughput  1 2 3 4 5 6 7 8 9 10

2 x Pipe-based Context Switching  1 2 3 4 5 6 7 8 9 10

2 x Process Creation  1 2 3

2 x System Call Overhead  1 2 3 4 5 6 7 8 9 10

2 x Shell Scripts (1 concurrent)  1 2 3

2 x Shell Scripts (8 concurrent)  1 2 3

========================================================================
   BYTE UNIX Benchmarks (Version 5.1.3)

   System: bitcable: GNU/Linux
   OS: GNU/Linux -- 2.6.32-5-686 -- #1 SMP Mon Jun 13 04:13:06 UTC 2011
   Machine: i686 (unknown)
   Language: en_US.utf8 (charmap="UTF-8", collate="UTF-8")
   CPU 0: QEMU Virtual CPU version 0.9.1 (6385.8 bogomips)
          x86-64, MMX, Physical Address Ext, SYSENTER/SYSEXIT, SYSCALL/SYSRET
   CPU 1: QEMU Virtual CPU version 0.9.1 (6385.8 bogomips)
          x86-64, MMX, Physical Address Ext, SYSENTER/SYSEXIT, SYSCALL/SYSRET
   12:23:10 up 11:13,  2 users,  load average: 0.00, 0.01, 0.15; runlevel 2

------------------------------------------------------------------------
Benchmark Run: Mon Aug 08 2011 12:23:10 - 12:51:25
2 CPUs in system; running 1 parallel copy of tests

Dhrystone 2 using register variables       19572830.7 lps   (10.0 s, 7 samples)
Double-Precision Whetstone                     3228.9 MWIPS (10.0 s, 7 samples)
Execl Throughput                               2301.6 lps   (29.9 s, 2 samples)
File Copy 1024 bufsize 2000 maxblocks       1043687.9 KBps  (30.0 s, 2 samples)
File Copy 256 bufsize 500 maxblocks          268911.9 KBps  (30.0 s, 2 samples)
File Copy 4096 bufsize 8000 maxblocks       2487526.8 KBps  (30.0 s, 2 samples)
Pipe Throughput                             2174482.1 lps   (10.0 s, 7 samples)
Pipe-based Context Switching                 352019.9 lps   (10.0 s, 7 samples)
Process Creation                               6470.3 lps   (30.0 s, 2 samples)
Shell Scripts (1 concurrent)                   4851.9 lpm   (60.0 s, 2 samples)
Shell Scripts (8 concurrent)                   2041.9 lpm   (60.0 s, 2 samples)
System Call Overhead                        3545657.2 lps   (10.0 s, 7 samples)

System Benchmarks Index Values               BASELINE       RESULT    INDEX
Dhrystone 2 using register variables         116700.0   19572830.7   1677.2
Double-Precision Whetstone                       55.0       3228.9    587.1
Execl Throughput                                 43.0       2301.6    535.3
File Copy 1024 bufsize 2000 maxblocks          3960.0    1043687.9   2635.6
File Copy 256 bufsize 500 maxblocks            1655.0     268911.9   1624.8
File Copy 4096 bufsize 8000 maxblocks          5800.0    2487526.8   4288.8
Pipe Throughput                               12440.0    2174482.1   1748.0
Pipe-based Context Switching                   4000.0     352019.9    880.0
Process Creation                                126.0       6470.3    513.5
Shell Scripts (1 concurrent)                     42.4       4851.9   1144.3
Shell Scripts (8 concurrent)                      6.0       2041.9   3403.1
System Call Overhead                          15000.0    3545657.2   2363.8
                                                                   ========
System Benchmarks Index Score                                        1425.5

------------------------------------------------------------------------
Benchmark Run: Mon Aug 08 2011 12:51:25 - 13:19:43
2 CPUs in system; running 2 parallel copies of tests

Dhrystone 2 using register variables       39209556.1 lps   (10.0 s, 7 samples)
Double-Precision Whetstone                     6434.9 MWIPS (10.0 s, 7 samples)
Execl Throughput                              11975.4 lps   (29.9 s, 2 samples)
File Copy 1024 bufsize 2000 maxblocks       1174029.6 KBps  (30.0 s, 2 samples)
File Copy 256 bufsize 500 maxblocks          326407.1 KBps  (30.0 s, 2 samples)
File Copy 4096 bufsize 8000 maxblocks       3532418.2 KBps  (30.0 s, 2 samples)
Pipe Throughput                             4403934.1 lps   (10.0 s, 7 samples)
Pipe-based Context Switching                 781107.4 lps   (10.0 s, 7 samples)
Process Creation                              42835.3 lps   (30.0 s, 2 samples)
Shell Scripts (1 concurrent)                  15826.1 lpm   (60.0 s, 2 samples)
Shell Scripts (8 concurrent)                   2081.8 lpm   (60.1 s, 2 samples)
System Call Overhead                        5699966.6 lps   (10.0 s, 7 samples)

System Benchmarks Index Values               BASELINE       RESULT    INDEX
Dhrystone 2 using register variables         116700.0   39209556.1   3359.9
Double-Precision Whetstone                       55.0       6434.9   1170.0
Execl Throughput                                 43.0      11975.4   2785.0
File Copy 1024 bufsize 2000 maxblocks          3960.0    1174029.6   2964.7
File Copy 256 bufsize 500 maxblocks            1655.0     326407.1   1972.2
File Copy 4096 bufsize 8000 maxblocks          5800.0    3532418.2   6090.4
Pipe Throughput                               12440.0    4403934.1   3540.1
Pipe-based Context Switching                   4000.0     781107.4   1952.8
Process Creation                                126.0      42835.3   3399.6
Shell Scripts (1 concurrent)                     42.4      15826.1   3732.6
Shell Scripts (8 concurrent)                      6.0       2081.8   3469.7
System Call Overhead                          15000.0    5699966.6   3800.0
                                                                   ========
System Benchmarks Index Score                                        2959.2
Wow, that is close to 3000 points! Definitely one of the highest I have seen among the low end VPS. Test again showed similar results:
   #    #  #    #  #  #    #          #####   ######  #    #   ####   #    #
   #    #  ##   #  #   #  #           #    #  #       ##   #  #    #  #    #
   #    #  # #  #  #    ##            #####   #####   # #  #  #       ######
   #    #  #  # #  #    ##            #    #  #       #  # #  #       #    #
   #    #  #   ##  #   #  #           #    #  #       #   ##  #    #  #    #
    ####   #    #  #  #    #          #####   ######  #    #   ####   #    #

   Version 5.1.3                      Based on the Byte Magazine Unix Benchmark

   Multi-CPU version                  Version 5 revisions by Ian Smith,
                                      Sunnyvale, CA, USA
   January 13, 2011                   johantheghost at yahoo period com

1 x Dhrystone 2 using register variables  1 2 3 4 5 6 7 8 9 10

1 x Double-Precision Whetstone  1 2 3 4 5 6 7 8 9 10

1 x Execl Throughput  1 2 3

1 x File Copy 1024 bufsize 2000 maxblocks  1 2 3

1 x File Copy 256 bufsize 500 maxblocks  1 2 3

1 x File Copy 4096 bufsize 8000 maxblocks  1 2 3

1 x Pipe Throughput  1 2 3 4 5 6 7 8 9 10

1 x Pipe-based Context Switching  1 2 3 4 5 6 7 8 9 10

1 x Process Creation  1 2 3

1 x System Call Overhead  1 2 3 4 5 6 7 8 9 10

1 x Shell Scripts (1 concurrent)  1 2 3

1 x Shell Scripts (8 concurrent)  1 2 3

2 x Dhrystone 2 using register variables  1 2 3 4 5 6 7 8 9 10

2 x Double-Precision Whetstone  1 2 3 4 5 6 7 8 9 10

2 x Execl Throughput  1 2 3

2 x File Copy 1024 bufsize 2000 maxblocks  1 2 3

2 x File Copy 256 bufsize 500 maxblocks  1 2 3

2 x File Copy 4096 bufsize 8000 maxblocks  1 2 3

2 x Pipe Throughput  1 2 3 4 5 6 7 8 9 10

2 x Pipe-based Context Switching  1 2 3 4 5 6 7 8 9 10

2 x Process Creation  1 2 3

2 x System Call Overhead  1 2 3 4 5 6 7 8 9 10

2 x Shell Scripts (1 concurrent)  1 2 3

2 x Shell Scripts (8 concurrent)  1 2 3

========================================================================
   BYTE UNIX Benchmarks (Version 5.1.3)

   System: bitcable: GNU/Linux
   OS: GNU/Linux -- 2.6.32-5-686 -- #1 SMP Mon Jun 13 04:13:06 UTC 2011
   Machine: i686 (unknown)
   Language: en_US.utf8 (charmap="UTF-8", collate="UTF-8")
   CPU 0: QEMU Virtual CPU version 0.9.1 (6385.8 bogomips)
          x86-64, MMX, Physical Address Ext, SYSENTER/SYSEXIT, SYSCALL/SYSRET
   CPU 1: QEMU Virtual CPU version 0.9.1 (6385.8 bogomips)
          x86-64, MMX, Physical Address Ext, SYSENTER/SYSEXIT, SYSCALL/SYSRET
   13:32:45 up 12:23,  2 users,  load average: 0.00, 0.47, 1.42; runlevel 2

------------------------------------------------------------------------
Benchmark Run: Mon Aug 08 2011 13:32:45 - 14:01:00
2 CPUs in system; running 1 parallel copy of tests

Dhrystone 2 using register variables       19780133.0 lps   (10.0 s, 7 samples)
Double-Precision Whetstone                     3249.6 MWIPS (10.0 s, 7 samples)
Execl Throughput                               2262.1 lps   (29.9 s, 2 samples)
File Copy 1024 bufsize 2000 maxblocks       1014353.0 KBps  (30.0 s, 2 samples)
File Copy 256 bufsize 500 maxblocks          285760.5 KBps  (30.0 s, 2 samples)
File Copy 4096 bufsize 8000 maxblocks       2552921.9 KBps  (30.0 s, 2 samples)
Pipe Throughput                             2209678.5 lps   (10.0 s, 7 samples)
Pipe-based Context Switching                 358699.7 lps   (10.0 s, 7 samples)
Process Creation                               6491.3 lps   (30.0 s, 2 samples)
Shell Scripts (1 concurrent)                   4722.6 lpm   (60.0 s, 2 samples)
Shell Scripts (8 concurrent)                   2043.7 lpm   (60.0 s, 2 samples)
System Call Overhead                        3626698.6 lps   (10.0 s, 7 samples)

System Benchmarks Index Values               BASELINE       RESULT    INDEX
Dhrystone 2 using register variables         116700.0   19780133.0   1695.0
Double-Precision Whetstone                       55.0       3249.6    590.8
Execl Throughput                                 43.0       2262.1    526.1
File Copy 1024 bufsize 2000 maxblocks          3960.0    1014353.0   2561.5
File Copy 256 bufsize 500 maxblocks            1655.0     285760.5   1726.6
File Copy 4096 bufsize 8000 maxblocks          5800.0    2552921.9   4401.6
Pipe Throughput                               12440.0    2209678.5   1776.3
Pipe-based Context Switching                   4000.0     358699.7    896.7
Process Creation                                126.0       6491.3    515.2
Shell Scripts (1 concurrent)                     42.4       4722.6   1113.8
Shell Scripts (8 concurrent)                      6.0       2043.7   3406.1
System Call Overhead                          15000.0    3626698.6   2417.8
                                                                   ========
System Benchmarks Index Score                                        1436.5

------------------------------------------------------------------------
Benchmark Run: Mon Aug 08 2011 14:01:00 - 14:29:16
2 CPUs in system; running 2 parallel copies of tests

Dhrystone 2 using register variables       38989920.3 lps   (10.0 s, 7 samples)
Double-Precision Whetstone                     6453.7 MWIPS (10.0 s, 7 samples)
Execl Throughput                              11972.8 lps   (29.9 s, 2 samples)
File Copy 1024 bufsize 2000 maxblocks       1246007.7 KBps  (30.0 s, 2 samples)
File Copy 256 bufsize 500 maxblocks          315826.3 KBps  (30.0 s, 2 samples)
File Copy 4096 bufsize 8000 maxblocks       3647316.9 KBps  (30.0 s, 2 samples)
Pipe Throughput                             4434474.4 lps   (10.0 s, 7 samples)
Pipe-based Context Switching                 796818.0 lps   (10.0 s, 7 samples)
Process Creation                              42961.8 lps   (30.0 s, 2 samples)
Shell Scripts (1 concurrent)                  16001.0 lpm   (60.0 s, 2 samples)
Shell Scripts (8 concurrent)                   2095.8 lpm   (60.1 s, 2 samples)
System Call Overhead                        5826217.9 lps   (10.0 s, 7 samples)

System Benchmarks Index Values               BASELINE       RESULT    INDEX
Dhrystone 2 using register variables         116700.0   38989920.3   3341.0
Double-Precision Whetstone                       55.0       6453.7   1173.4
Execl Throughput                                 43.0      11972.8   2784.4
File Copy 1024 bufsize 2000 maxblocks          3960.0    1246007.7   3146.5
File Copy 256 bufsize 500 maxblocks            1655.0     315826.3   1908.3
File Copy 4096 bufsize 8000 maxblocks          5800.0    3647316.9   6288.5
Pipe Throughput                               12440.0    4434474.4   3564.7
Pipe-based Context Switching                   4000.0     796818.0   1992.0
Process Creation                                126.0      42961.8   3409.7
Shell Scripts (1 concurrent)                     42.4      16001.0   3773.8
Shell Scripts (8 concurrent)                      6.0       2095.8   3493.0
System Call Overhead                          15000.0    5826217.9   3884.1
                                                                   ========
System Benchmarks Index Score                                        2990.2
Geekbench shows pretty good results too:
System Information
  Platform:                  Linux x86 (32-bit)
  Compiler:                  GCC 4.1.2 20070925 (Red Hat 4.1.2-33)
  Operating System:          Linux 2.6.32-5-686 i686
  Model:                     Linux PC (QEMU Virtual CPU version 0.9.1)
  Motherboard:               Unknown Motherboard
  Processor:                 QEMU Virtual CPU version 0.9.1
  Processor ID:              GenuineIntel Family 6 Model 6 Stepping 3
  Logical Processors:        2
  Physical Processors:       1
  Processor Frequency:       3.19 GHz
  L1 Instruction Cache:      64.0 KB
  L1 Data Cache:             64.0 KB
  L2 Cache:                  512 KB
  L3 Cache:                  0.00 B
  Bus Frequency:             0.00 Hz
  Memory:                    248 MB
  Memory Type:               N/A
  SIMD:                      1
  BIOS:                      N/A
  Processor Model:           QEMU Virtual CPU version 0.9.1
  Processor Cores:           2

Integer
  Blowfish
    single-threaded scalar    2139 ||||||||
    multi-threaded scalar     3984 |||||||||||||||
  Text Compress
    single-threaded scalar    2875 |||||||||||
    multi-threaded scalar     5280 |||||||||||||||||||||
  Text Decompress
    single-threaded scalar    3065 ||||||||||||
    multi-threaded scalar     5868 |||||||||||||||||||||||
  Image Compress
    single-threaded scalar    2423 |||||||||
    multi-threaded scalar     3820 |||||||||||||||
  Image Decompress
    single-threaded scalar    2391 |||||||||
    multi-threaded scalar     3065 ||||||||||||
  Lua
    single-threaded scalar    3950 |||||||||||||||
    multi-threaded scalar     7597 ||||||||||||||||||||||||||||||

Floating Point
  Mandelbrot
    single-threaded scalar    2742 ||||||||||
    multi-threaded scalar     5049 ||||||||||||||||||||
  Dot Product
    single-threaded scalar    4554 ||||||||||||||||||
    multi-threaded scalar     8323 |||||||||||||||||||||||||||||||||
    single-threaded vector    5357 |||||||||||||||||||||
    multi-threaded vector     9069 ||||||||||||||||||||||||||||||||||||
  LU Decomposition
    single-threaded scalar    3445 |||||||||||||
    multi-threaded scalar     3568 ||||||||||||||
  Primality Test
    single-threaded scalar    4841 |||||||||||||||||||
    multi-threaded scalar     7508 ||||||||||||||||||||||||||||||
  Sharpen Image
    single-threaded scalar   11016 ||||||||||||||||||||||||||||||||||||||||||||
    multi-threaded scalar    15936 |||||||||||||||||||||||||||||||||||||||||||||||||||||||||||||||
  Blur Image
    single-threaded scalar    8678 ||||||||||||||||||||||||||||||||||
    multi-threaded scalar    15674 ||||||||||||||||||||||||||||||||||||||||||||||||||||||||||||||

Memory
  Read Sequential
    single-threaded scalar    7100 ||||||||||||||||||||||||||||
  Write Sequential
    single-threaded scalar   10958 |||||||||||||||||||||||||||||||||||||||||||
  Stdlib Allocate
    single-threaded scalar    5236 ||||||||||||||||||||
  Stdlib Write
    single-threaded scalar    7108 ||||||||||||||||||||||||||||
  Stdlib Copy
    single-threaded scalar   14159 ||||||||||||||||||||||||||||||||||||||||||||||||||||||||

Stream
  Stream Copy
    single-threaded scalar    5769 |||||||||||||||||||||||
    single-threaded vector    7021 ||||||||||||||||||||||||||||
  Stream Scale
    single-threaded scalar    6045 ||||||||||||||||||||||||
    single-threaded vector    6468 |||||||||||||||||||||||||
  Stream Add
    single-threaded scalar    5625 ||||||||||||||||||||||
    single-threaded vector    6505 ||||||||||||||||||||||||||
  Stream Triad
    single-threaded scalar    6349 |||||||||||||||||||||||||
    single-threaded vector    4775 |||||||||||||||||||

Integer Score:                3871 |||||||||||||||
Floating Point Score:         7554 ||||||||||||||||||||||||||||||
Memory Score:                 8912 |||||||||||||||||||||||||||||||||||
Stream Score:                 6069 ||||||||||||||||||||||||

Overall Geekbench Score:      6388 |||||||||||||||||||||||||
And again above 6300:
System Information
  Platform:                  Linux x86 (32-bit)
  Compiler:                  GCC 4.1.2 20070925 (Red Hat 4.1.2-33)
  Operating System:          Linux 2.6.32-5-686 i686
  Model:                     Linux PC (QEMU Virtual CPU version 0.9.1)
  Motherboard:               Unknown Motherboard
  Processor:                 QEMU Virtual CPU version 0.9.1
  Processor ID:              GenuineIntel Family 6 Model 6 Stepping 3
  Logical Processors:        2
  Physical Processors:       1
  Processor Frequency:       3.19 GHz
  L1 Instruction Cache:      64.0 KB
  L1 Data Cache:             64.0 KB
  L2 Cache:                  512 KB
  L3 Cache:                  0.00 B
  Bus Frequency:             0.00 Hz
  Memory:                    248 MB
  Memory Type:               N/A
  SIMD:                      1
  BIOS:                      N/A
  Processor Model:           QEMU Virtual CPU version 0.9.1
  Processor Cores:           2

Integer
  Blowfish
    single-threaded scalar    2156 ||||||||
    multi-threaded scalar     4095 ||||||||||||||||
  Text Compress
    single-threaded scalar    2932 |||||||||||
    multi-threaded scalar     5362 |||||||||||||||||||||
  Text Decompress
    single-threaded scalar    3115 ||||||||||||
    multi-threaded scalar     5848 |||||||||||||||||||||||
  Image Compress
    single-threaded scalar    2412 |||||||||
    multi-threaded scalar     3791 |||||||||||||||
  Image Decompress
    single-threaded scalar    2409 |||||||||
    multi-threaded scalar     3070 ||||||||||||
  Lua
    single-threaded scalar    3923 |||||||||||||||
    multi-threaded scalar     7684 ||||||||||||||||||||||||||||||

Floating Point
  Mandelbrot
    single-threaded scalar    2773 |||||||||||
    multi-threaded scalar     4921 |||||||||||||||||||
  Dot Product
    single-threaded scalar    4550 ||||||||||||||||||
    multi-threaded scalar     8406 |||||||||||||||||||||||||||||||||
    single-threaded vector    5373 |||||||||||||||||||||
    multi-threaded vector     8415 |||||||||||||||||||||||||||||||||
  LU Decomposition
    single-threaded scalar    3539 ||||||||||||||
    multi-threaded scalar     2549 ||||||||||
  Primality Test
    single-threaded scalar    4847 |||||||||||||||||||
    multi-threaded scalar     7451 |||||||||||||||||||||||||||||
  Sharpen Image
    single-threaded scalar   10973 |||||||||||||||||||||||||||||||||||||||||||
    multi-threaded scalar    15984 |||||||||||||||||||||||||||||||||||||||||||||||||||||||||||||||
  Blur Image
    single-threaded scalar    8637 ||||||||||||||||||||||||||||||||||
    multi-threaded scalar    16024 ||||||||||||||||||||||||||||||||||||||||||||||||||||||||||||||||

Memory
  Read Sequential
    single-threaded scalar    7046 ||||||||||||||||||||||||||||
  Write Sequential
    single-threaded scalar   10998 |||||||||||||||||||||||||||||||||||||||||||
  Stdlib Allocate
    single-threaded scalar    5223 ||||||||||||||||||||
  Stdlib Write
    single-threaded scalar    7139 ||||||||||||||||||||||||||||
  Stdlib Copy
    single-threaded scalar   12938 |||||||||||||||||||||||||||||||||||||||||||||||||||

Stream
  Stream Copy
    single-threaded scalar    5847 |||||||||||||||||||||||
    single-threaded vector    6769 |||||||||||||||||||||||||||
  Stream Scale
    single-threaded scalar    6051 ||||||||||||||||||||||||
    single-threaded vector    6520 ||||||||||||||||||||||||||
  Stream Add
    single-threaded scalar    5663 ||||||||||||||||||||||
    single-threaded vector    6368 |||||||||||||||||||||||||
  Stream Triad
    single-threaded scalar    6128 ||||||||||||||||||||||||
    single-threaded vector    4779 |||||||||||||||||||

Integer Score:                3899 |||||||||||||||
Floating Point Score:         7460 |||||||||||||||||||||||||||||
Memory Score:                 8668 ||||||||||||||||||||||||||||||||||
Stream Score:                 6015 ||||||||||||||||||||||||

Overall Geekbench Score:      6310 |||||||||||||||||||||||||
In conclusion, although the price seems to be in the in the high end of the budget VPS (but with 50% off coupon, the prices are really reasonable), the VPS itself definitely offers great performance.
Customer Service and Support
Although Preetam is the only person that I know I have spoken with, the ticket response was definitely very fast. My pre-sales ticket was answered in 5 minutes (put in at 14:57, answered at 15:02), the ticket that he has opened to ask me what OS distribution I would want to have was responded within 3 minutes after my initial reply. Finally, the only support ticket that I had them took a bit longer and was responded in….7 minutes! The reason why it took “longer” was actually because although I only asked about port speed out of curiosity, Preetam actually checked my VPS and noticed there was a problem with my NIC settings that makes it only functions as a 100Mbit port and he has fixed it for me, all in 7 minutes.
Conclusion
To be honest, I was a little hesitant at the beginning: high school senior running a VPS hosting business with no review available is definitely not everyone’s favourite. However, by now I would say all my worries are unnecessary. What BitCable has presented to me is a VPS that may not be the cheapest, but with impressive hardware resources and high benchmark score. Together with quick customer service and support, BitCable is definitely a very good candidate for those who want good VPS.
Thanks for the review!
I just wanted to share that we’re working on a completely new VPS dashboard to manage our KVM VPSs. It should make management a whole lot easier 🙂
That’s a good news, I hope the birthday promo will last a bit longer, I have way too many vps right now ^_^
@admin, from my traceroute results it’s in fastserv
@circus: I do not really see the tracert results…does it tell you which DC BitCable is in?
yup
they test ip is -> fastserv.core1.ash1.he.net
@circus: I guess you must have a special tracert tool then, mine just timed out after the 14th hop or something…
Oh, never mind, you used dig -x to find that?
@admin, my mistake ^_^ actually fastserv.core1.ash1.he.net is fastserv router or something (a node just before the test ip) 😛
traceroute to 209.9.238.4 (209.9.238.4), 30 hops max, 52 byte packets
1 10.66.82.1 (10.66.82.1) 271.021 ms 252.830 ms 267.945 ms
2 escapefromla.hostigation.com (96.44.154.33) 268.993 ms 272.756 ms 272.038 ms
3 hostg-quadra-gw.hostigation.com (72.11.150.105) 274.951 ms 271.809 ms 279.960 ms
4 96.44.180.97 (96.44.180.97) 259.961 ms 271.901 ms 262.995 ms
5 96.44.180.245 (96.44.180.245) 272.976 ms 271.906 ms 269.961 ms
6 10gigabitethernet1-3.core1.lax1.he.net (206.223.123.37) 327.990 ms 352.787 ms 323.972 ms
7 10gigabitethernet1-1.core1.phx1.he.net (72.52.92.250) 357.982 ms 10gigabitethernet4-3.core1.nyc4.he.net (72.52.92.225) 364.794 ms 364.781 ms
8 10gigabitethernet1-3.core1.dal1.he.net (72.52.92.254) 343.977 ms 335.828 ms 356.955 ms
9 fastserv.core1.ash1.he.net (216.66.0.226) 349.984 ms 339.843 ms 350.913 ms
10 209.9.238.4 (209.9.238.4) 347.006 ms 346.851 ms 318.011 ms
@circus: Interesting enough, this post went to the spam for some reason, guess there are too many HE.Net in there? LOL 🙂
Yes, we’re colocating our servers at the Latisys data center in Ashburn (through FastServ).
@Preetam: Nice, you beat me in speed of replying again! Thanks for solving the mystery for us 🙂
Oh well, I can’t resist ^_^
geekbench
$ dd if=/dev/zero of=test bs=64k count=16k conv=fdatasync
16384+0 records in
16384+0 records out
1073741824 bytes (1.1 GB) copied, 10.4811 s, 102 MB/s
$ dd if=/dev/zero of=test bs=64k count=16k conv=fdatasync
16384+0 records in
16384+0 records out
1073741824 bytes (1.1 GB) copied, 9.31846 s, 115 MB/s
Pingback: Bitcable – $4 256MB KVM VPS in Ashburn VA – Low End Box
Pingback: BitCable – 4美元 KVM 256M 12G 150G | VPS 工厂