
96MB Low End VPS Review Part 70 – Cloud Shards
Harry from CloudShards approached me almost a year ago (last day of October last year to be exact), asking for a review on CloudShards. However I failed to respond to it until February of this year (sorry for the delay in response to many of the readers of 96MB, the review requests are simply piling up and unfortunately, I am a one-man team with a day job). As I was working through the pile, Harry sent another reminder wondering if I could give him an ETA. I did not realize until a few days later when he posted this is 96MB VPS offer on LowEndTalk. As rarely any providers are actually offering small VPS these days, and this is actually what was 96MB all about initially, I decided to jump the queue and review this particular offering first.
Basic Information and Set Up
As mentioned on the following advertisement on LowEndTalk, here is what you get with the 96MB package:
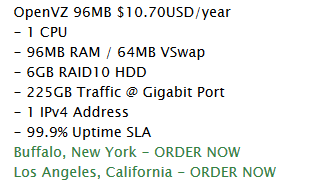
Note that the port is actually Gbit port, which is definitely one of the advantages for such a VPS since many people use such small VPS for VPN, which could be pretty intensive on the network. There are also two locations available, on the East and West coast of US.
Sign up is standard WHCMS interface via HTTPS. I was glad to see that there is actually detailed product description on the sign up page. Even though it is something that takes may be 5 minutes to fill up, many providers don’t have the product description on the sign up page, making you wondering what you are going to sign up, a simple product name such as “VPS-LET_PROMO-1” is not going to give people a good idea of what kind of resources they are going to get:
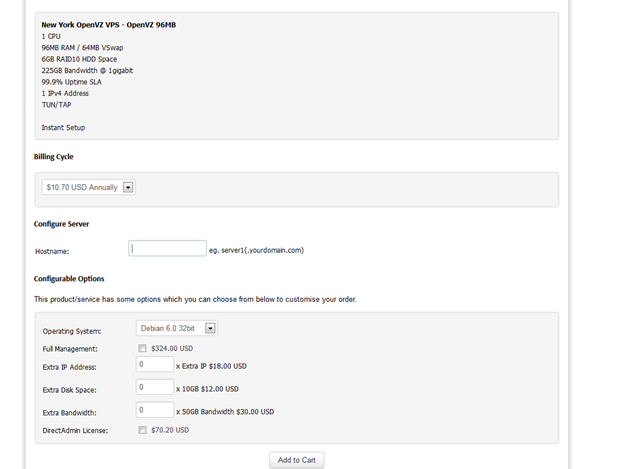
For hostname, you can just enter any random combinations of letters and words and the system would automatically attach a .com at the end to make the hostname a fully-qualified domain name (FQDN), which is now one of the requirements for SolusVM to create the VPS.
Note that unlike the “classic” WHMCS set up, there is no space for you to enter your root password. The root password is generated by the system and comes with the welcome email.
There is also full management option for this VPS, which cost 17USD per month, however I really doubt if anyone is willing to pay for full management feature for such a small VPS.
The minimum billing cycle for this product is yearly, and you can also pay for 2 years in advance, which will give you a 40 cents discount:

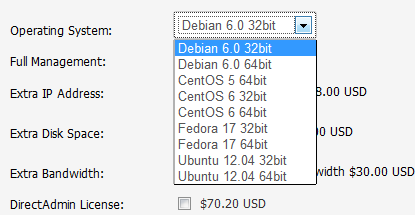
There are relatively few OS that you can choose at the sign up page, however more OS are listed in the SolusVM once you receive your login credentials:
As you can see at the summary part of the cost page, you can also purchase extra IPv4 address at 1.50USD per month per address, extra HDD space at 1 USD per month for each 10GB of extra HDD space. Extra bandwidth cost 30USD per year for 50GB of bandwidth (which is not cheap). DirectAdmin license cost 5.85USD per month, which is pretty standard:
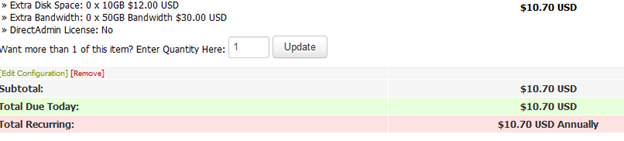
Note that at the summary of cost page, there is an option for you to buy more than one of these VPS, which is again a relatively easy configuration to be done at the back end, however is pretty convenient when users need to buy multiple VPS.
Provision of the VPS was instant and I was able to get the login information the moment I received my Paypal payment confirmation email. Once logged into WHMCS, which is using secured HTTPS protocol (thanks to the cheap SSL offer listed here), you can see the VPS listed under My Services:
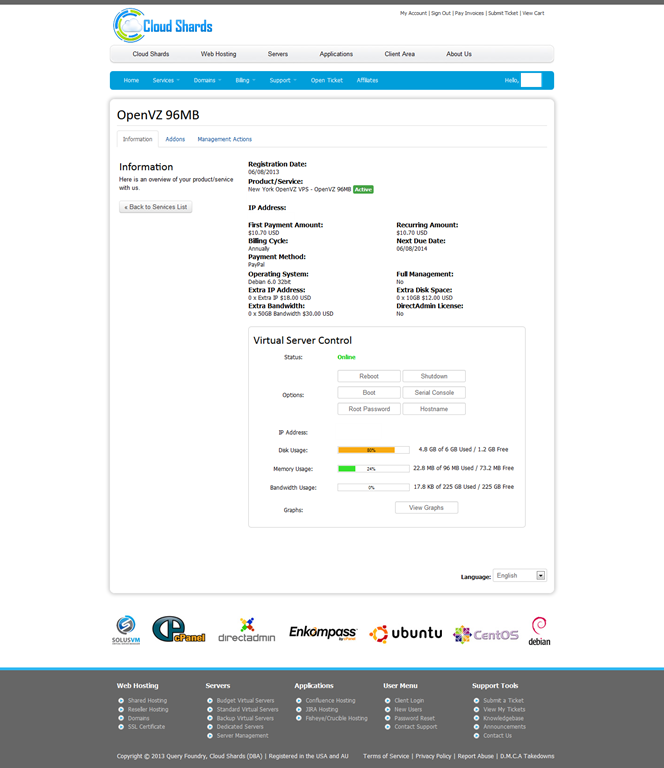
There is also a standard Virtual Server control panel you can use to control the VPS, also there is detailed resources usage that you can see.

The SolusVM page is also using the HTTPS protocol (yes, the power of wildcard certificate!), and once logged in, a standard SolusVM page is seen:
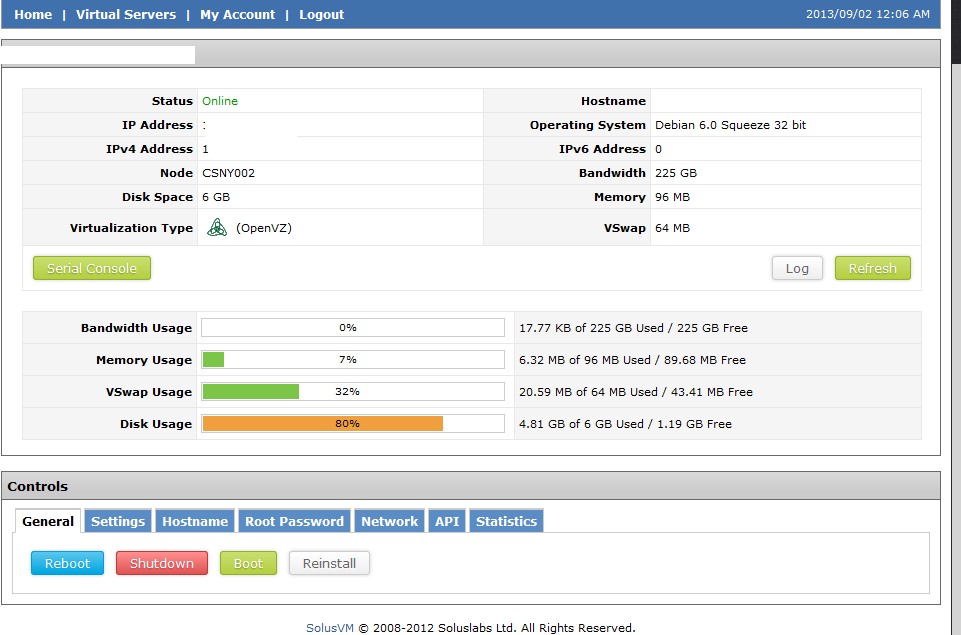
Click on the Reinstall button and you can see a much wider selection of OS templates that can be installed, including some of the minimal templates, although there is no turnkey template available:
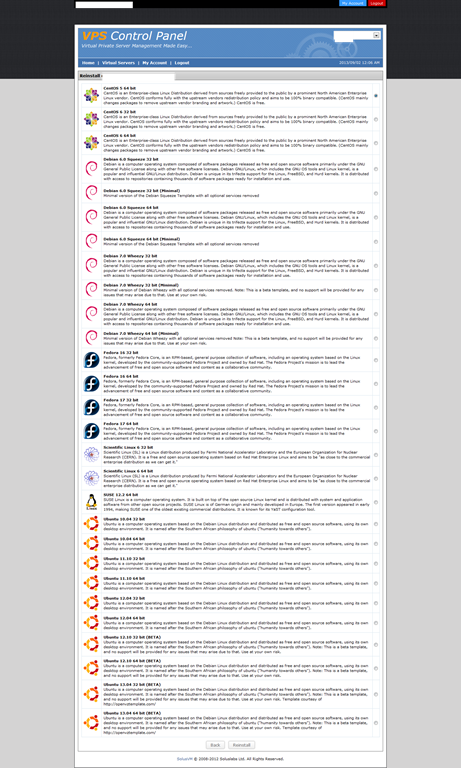
There is also instant rDNS available for the VPS:

Test on the VPS
As mentioned above, the VPS that I have purchased has 96MB of RAM and 64MB of vSwap, 6GB of HDD space and 225GB of traffic on Gbit port. I have installed Debian 6 32 bit for testing purposes. The VPS is located in the Colocrossing DC in Buffalo, NY.
When the VPS was first installed, about 8MB of RAM was used, which is in line with what one would expect for a Debian 6 OpenVZ installation:
free -m
             total       used       free     shared    buffers     cached
Mem:            96         24         71          0          0         16
-/+ buffers/cache:          8         87
Swap:           64          0         63
Top showing the processes running:
top - 03:49:52 up 14 days, 10:05,  1 user,  load average: 0.00, 0.00, 0.00
Tasks:  17 total,   1 running,  16 sleeping,   0 stopped,   0 zombie
Cpu(s):  0.0%us,  0.0%sy,  0.0%ni,100.0%id,  0.0%wa,  0.0%hi,  0.0%si,  0.0%st
Mem:     98304k total,    25564k used,    72740k free,        0k buffers
Swap:    65536k total,        4k used,    65532k free,    16832k cached

  PID USER      PR  NI  VIRT  RES  SHR S %CPU %MEM    TIME+  COMMAND
 2854 root      20   0  8544 3024 2476 S  0.0  3.1   0:00.04 sshd
19713 www-data  20   0  5556 2772 1156 S  0.0  2.8   0:00.00 apache2
  464 root      20   0  5140 2756 1468 S  0.0  2.8   0:26.20 apache2
21245 www-data  20   0  5428 2628 1156 S  0.0  2.7   0:00.00 apache2
21244 www-data  20   0  5556 2624 1156 S  0.0  2.7   0:00.00 apache2
 2856 root      20   0  2960 1608 1284 S  0.0  1.6   0:00.00 bash
  643 root      20   0  9988 1576  552 S  0.0  1.6   0:25.42 sendmail-mta
 2864 root      20   0  2328 1076  884 R  0.0  1.1   0:00.00 top
  494 root      20   0  5488  972  588 S  0.0  1.0   0:04.31 sshd
  535 root      20   0  2288  868  680 S  0.0  0.9   0:00.92 cron
  515 root      20   0  2392  860  700 S  0.0  0.9   0:00.00 xinetd
  448 root      20   0  8668  816  484 S  0.0  0.8   0:00.00 saslauthd
    1 root      20   0  2028  732  636 S  0.0  0.7   0:07.85 init
  425 root      20   0  1736  644  524 S  0.0  0.7   0:03.72 syslogd
  450 root      20   0  8668  380   48 S  0.0  0.4   0:00.00 saslauthd
    2 root      20   0     0    0    0 S  0.0  0.0   0:00.00 kthreadd/1154
    3 root      20   0     0    0    0 S  0.0  0.0   0:00.00 khelper/1154
Htop output:
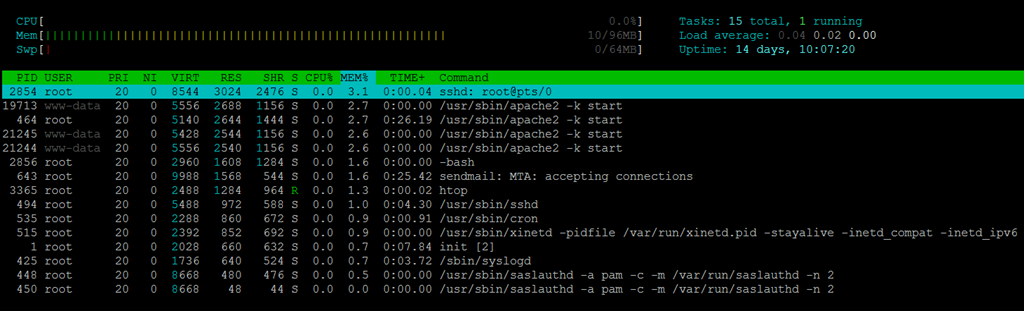
About 418MB of hard drive space were used:
df -h
Filesystem            Size  Used Avail Use% Mounted on
/dev/simfs            6.0G  418M  5.6G   7% /
tmpfs                  48M     0   48M   0% /lib/init/rw
tmpfs                  48M     0   48M   0% /dev/shm
And 1% of INode space was used:
df -i
Filesystem            Inodes   IUsed   IFree IUse% Mounted on
/dev/simfs           3145728   26155 3119573    1% /
tmpfs                  12288       4   12284    1% /lib/init/rw
tmpfs                  12288       1   12287    1% /dev/shm
After the LNMP stack was loaded, about 18MB of RAM was used:
free -m
             total       used       free     shared    buffers     cached
Mem:            96         91          4          0          0         73
-/+ buffers/cache:         18         77
Swap:           64         17         46
Top showing the processes running:
top - 09:56:01 up 14 days, 12:11,  1 user,  load average: 0.00, 0.33, 0.48
Tasks:  21 total,   1 running,  20 sleeping,   0 stopped,   0 zombie
Cpu(s):  0.0%us,  0.0%sy,  0.0%ni,100.0%id,  0.0%wa,  0.0%hi,  0.0%si,  0.0%st
Mem:     98304k total,    94128k used,     4176k free,        0k buffers
Swap:    65536k total,    17668k used,    47868k free,    75384k cached

  PID USER      PR  NI  VIRT  RES  SHR S %CPU %MEM    TIME+  COMMAND
30425 www       20   0 15644 6788  444 S  0.0  6.9   0:00.00 nginx
30411 mysql     20   0 34444 2448 2448 S  0.0  2.5   0:00.00 mysqld
30455 root      20   0  2412 1120  908 R  0.0  1.1   0:00.00 top
30308 root      20   0  2756 1032 1032 S  0.0  1.0   0:00.00 mysqld_safe
 4572 root      20   0  3004  736  580 S  0.0  0.7   0:00.00 bash
15284 root      20   0 17412  684  544 S  0.0  0.7   0:00.00 smbd
 8936 root      20   0 10044  460  308 S  0.0  0.5   0:00.03 sendmail-mta
15282 root      20   0  9588  460  360 S  0.0  0.5   0:00.01 nmbd
 4570 root      20   0  9124  356  240 S  0.0  0.4   0:00.76 sshd
30423 root      20   0  5432  276  276 S  0.0  0.3   0:00.00 nginx
15897 root      20   0  2344  264  192 S  0.0  0.3   0:00.00 cron
  425 root      20   0  1736  260  216 S  0.0  0.3   0:03.74 syslogd
    1 root      20   0  2068   64   48 S  0.0  0.1   0:07.89 init
  494 root      20   0  5488    4    4 S  0.0  0.0   0:04.32 sshd
 5033 bind      20   0 42776    4    4 S  0.0  0.0   0:00.00 named
15258 root      20   0  2436    4    4 S  0.0  0.0   0:00.00 xinetd
    2 root      20   0     0    0    0 S  0.0  0.0   0:00.00 kthreadd/1154
    3 root      20   0     0    0    0 S  0.0  0.0   0:00.00 khelper/1154
  448 root      20   0  8668    0    0 S  0.0  0.0   0:00.00 saslauthd
  450 root      20   0  8668    0    0 S  0.0  0.0   0:00.00 saslauthd
15295 root      20   0 17460    0    0 S  0.0  0.0   0:00.00 smbd
Htop output:
![image_thumb[6]](https://www.96mb.com/wp-content/uploads/2013/08/image_thumb61.png "image_thumb[6]")
Uptime shows the VPS has been very stable:
uptime
 22:36:39 up 60 days, 52 min,  1 user,  load average: 0.00, 0.00, 0.00
VMStat shows no iowait, which is good:
vmstat
procs -----------memory---------- ---swap-- -----io---- -system-- ----cpu----
 r  b   swpd   free   buff  cache   si   so    bi    bo   in   cs us sy id wa
 0  0  17624   3844      0  75676    1    1     0     4    0    6  0  0 100  0
Beancounters has 0 fail count, which is a good sign as well:
cat /proc/user_beancounters
Version: 2.5
       uid  resource                     held              maxheld              barrier                limit              failcnt
     xxxx:  kmemsize                 11101944             27303936             50331648             50331648                    0
            lockedpages                     0                   16                12288                12288                    0
            privvmpages                 20508                41851  9223372036854775807  9223372036854775807                    0
            shmpages                      641                 1296  9223372036854775807  9223372036854775807                    0
            dummy                           0                    0                    0                    0                    0
            numproc                        25                   60  9223372036854775807  9223372036854775807                    0
            physpages                   23611                24577                    0                24576                    0
            vmguarpages                     0                    0  9223372036854775807  9223372036854775807                    0
            oomguarpages                 6382                10965  9223372036854775807  9223372036854775807                    0
            numtcpsock                     17                   19  9223372036854775807  9223372036854775807                    0
            numflock                       18                   25  9223372036854775807  9223372036854775807                    0
            numpty                          1                    5  9223372036854775807  9223372036854775807                    0
            numsiginfo                      0                   27  9223372036854775807  9223372036854775807                    0
            tcpsndbuf                  455752               473192  9223372036854775807  9223372036854775807                    0
            tcprcvbuf                  282888              6331000  9223372036854775807  9223372036854775807                    0
            othersockbuf                41616                50072  9223372036854775807  9223372036854775807                    0
            dgramrcvbuf                     0                25760  9223372036854775807  9223372036854775807                    0
            numothersock                   52                   54  9223372036854775807  9223372036854775807                    0
            dcachesize                8868810             24746248             25165824             25165824                    0
            numfile                       459                  625  9223372036854775807  9223372036854775807                    0
            dummy                           0                    0                    0                    0                    0
            dummy                           0                    0                    0                    0                    0
            dummy                           0                    0                    0                    0                    0
            numiptent                      25                   25  9223372036854775807  9223372036854775807                    0
The vzfree results is, as a result, not making any sense:
vzfree
             Total     Used     Free
Kernel:     48.00M    9.67M   38.33M
Allocate: 36028797018963968.00M   80.11M 36028797018963888.00M (36028797018963967M Guaranteed)
Commit:   36028797018963968.00M   34.60M 36028797018963932.00M (31.1% of Allocated)
Swap:               -66.90M          (-268.3% of Committed)
I am actually considering of remove the vzfree output from future reviews since with the new version of OpenVZ with vswap, the output of vzfree no longer make any sense. Unless some people could somehow re-write the program to output something more sensible.
CPUInfo shows the VPS has a single core assigned and is a E3-1270v2 CPU:
 cat /proc/cpuinfo
processor       : 0
vendor_id       : GenuineIntel
cpu family      : 6
model           : 58
model name      : Intel(R) Xeon(R) CPU E3-1270 V2 @ 3.50GHz
stepping        : 9
cpu MHz         : 2799.549
cache size      : 8192 KB
physical id     : 0
siblings        : 8
core id         : 0
cpu cores       : 4
apicid          : 0
initial apicid  : 0
fpu             : yes
fpu_exception   : yes
cpuid level     : 13
wp              : yes
flags           : fpu vme de pse tsc msr pae mce cx8 apic sep mtrr pge mca cmov pat pse36 clflush dts acpi mmx fxsr sse sse2 ss ht tm pbe syscall nx rdtscp lm constant_tsc arch_perfmon pebs bts rep_good xtopology nonstop_tsc aperfmperf pni pclmulqdq dtes64 monitor ds_cpl vmx smx est tm2 ssse3 cx16 xtpr pdcm sse4_1 sse4_2 x2apic popcnt aes xsave avx f16c rdrand lahf_lm ida arat epb xsaveopt pln pts dts tpr_shadow vnmi flexpriority ept vpid fsgsbase smep erms
bogomips        : 7000.58
clflush size    : 64
cache_alignment : 64
address sizes   : 36 bits physical, 48 bits virtual
power management:
Meminfo output:
cat /proc/meminfo
MemTotal:          98304 kB
MemFree:           68648 kB
Cached:            20608 kB
Active:            18432 kB
Inactive:           7684 kB
Active(anon):       1752 kB
Inactive(anon):     3756 kB
Active(file):      16680 kB
Inactive(file):     3928 kB
Unevictable:           0 kB
Mlocked:               0 kB
SwapTotal:         65536 kB
SwapFree:          45508 kB
Dirty:                 0 kB
Writeback:             0 kB
AnonPages:          5508 kB
Shmem:              2564 kB
Slab:               3524 kB
SReclaimable:       1320 kB
SUnreclaim:         2204 kB
And time sync:
 time sync

real    0m0.008s
user    0m0.001s
sys     0m0.000s
DD results was almost too incredible to be true:
 dd if=/dev/zero of=test bs=64k count=16k conv=fdatasync
16384+0 records in
16384+0 records out
1073741824 bytes (1.1 GB) copied, 1.68459 s, 637 MB/s
Such fast speed led me to believe the HDD space is actually SSD-cached. Testing again shows similar speed:
 dd if=/dev/zero of=test bs=64k count=16k conv=fdatasync
16384+0 records in
16384+0 records out
1073741824 bytes (1.1 GB) copied, 1.60658 s, 668 MB/s
IOPing tests, however, shows something more interesting:
 ioping -c 10 .
4.0 kb from . (simfs /vz/private/1154): request=1 time=78 us
4.0 kb from . (simfs /vz/private/1154): request=2 time=122 us
4.0 kb from . (simfs /vz/private/1154): request=3 time=145 us
4.0 kb from . (simfs /vz/private/1154): request=4 time=218 us
4.0 kb from . (simfs /vz/private/1154): request=5 time=1.3 ms
4.0 kb from . (simfs /vz/private/1154): request=6 time=1.2 ms
4.0 kb from . (simfs /vz/private/1154): request=7 time=1.2 ms
4.0 kb from . (simfs /vz/private/1154): request=8 time=1.2 ms
4.0 kb from . (simfs /vz/private/1154): request=9 time=1.2 ms
4.0 kb from . (simfs /vz/private/1154): request=10 time=1.2 ms

--- . (simfs /vz/private/1154) ioping statistics ---
10 requests completed in 9.0 s, 1.3 k iops, 5.0 mb/s
min/avg/max/mdev = 78 us / 776 us / 1.3 ms / 520 us
As you can see, the speed varies from 78 microseconds to 1300 microseconds, which is definitely fast, however is not very consistent.
Testing again showed similar wide range of variations:
ioping -c 10 .
4.0 kb from . (simfs /vz/private/1154): request=1 time=74 us
4.0 kb from . (simfs /vz/private/1154): request=2 time=136 us
4.0 kb from . (simfs /vz/private/1154): request=3 time=134 us
4.0 kb from . (simfs /vz/private/1154): request=4 time=1.2 ms
4.0 kb from . (simfs /vz/private/1154): request=5 time=1.2 ms
4.0 kb from . (simfs /vz/private/1154): request=6 time=1.1 ms
4.0 kb from . (simfs /vz/private/1154): request=7 time=80 us
4.0 kb from . (simfs /vz/private/1154): request=8 time=1.2 ms
4.0 kb from . (simfs /vz/private/1154): request=9 time=661 us
4.0 kb from . (simfs /vz/private/1154): request=10 time=138 us

--- . (simfs /vz/private/1154) ioping statistics ---
10 requests completed in 9.0 s, 1.7 k iops, 6.6 mb/s
min/avg/max/mdev = 74 us / 592 us / 1.2 ms / 502 us
The download test using wget was impressive, as the port is Gbit port:
wget cachefly.cachefly.net/100mb.test -O /dev/null
--2013-08-22 07:47:56--  http://cachefly.cachefly.net/100mb.test
Resolving cachefly.cachefly.net (cachefly.cachefly.net)... 205.234.175.175
Connecting to cachefly.cachefly.net (cachefly.cachefly.net)|205.234.175.175|:80... connected.
HTTP request sent, awaiting response... 200 OK
Length: 104857600 (100M) [application/octet-stream]
Saving to: `/dev/null'

100%[======================================>] 104,857,600 53.6M/s   in 1.9s

2013-08-22 07:47:58 (53.6 MB/s) - `/dev/null' saved [104857600/104857600]
Testing again shows much slower speed, however is pretty decent:
wget cachefly.cachefly.net/100mb.test -O /dev/null
--2013-08-22 07:51:13--  http://cachefly.cachefly.net/100mb.test
Resolving cachefly.cachefly.net (cachefly.cachefly.net)... 205.234.175.175
Connecting to cachefly.cachefly.net (cachefly.cachefly.net)|205.234.175.175|:80... connected.
HTTP request sent, awaiting response... 200 OK
Length: 104857600 (100M) [application/octet-stream]
Saving to: `/dev/null'

100%[======================================>] 104,857,600 19.5M/s   in 4.9s

2013-08-22 07:51:18 (20.2 MB/s) - `/dev/null' saved [104857600/104857600]
Since this is a Gbit port, I’ve decided to use aget with multiple threads to do the testing as well:
The first download test is carried out by downloading the file from ThinkBroadband in London, UK:
aget -n 10 http://ipv4.download.thinkbroadband.com/1GB.zipAttempting to read log file aget-1GB.zip.log for resuming download job... Couldn't find log file for this download, starting a clean job... Head-Request Connection established Downloading /1GB.zip (1073741824 bytes) from site ipv4.download.thinkbroadband.com(80.249.99.148:80). Number of Threads: 10 .. [4% completed] ..... [9% completed] ....... ....... [14% completed] [14% completed] .......... [19% completed] ............ ............ [24% completed] [24% completed] ................ .............. [29% completed] [29% completed] ................. ................. [34% completed] [34% completed] .................... [39% completed] ...................... [44% completed] .......................... ........................ [49% completed] [49% completed] ........................... ............................ .......................... [54% completed] [54% completed] [54% completed] .............................. .............................. [59% completed] [59% completed] ................................ ................................ [64% completed] [64% completed] ................................... ................................... [69% completed] [69% completed] ..................................... [74% completed] ........................................ [79% completed] .......................................... .......................................... [84% completed] [84% completed] ............................................. ............................................. ............................................. [89% completed] [89% completed] [89% completed] ............................................... ............................................... [94% completed] [94% completed] .................................................. [99% completed] .................................................. [100% completed] Download completed, job completed in 12 seconds. (87381 Kb/sec) Shutting down...
Repeating the test showed similar results:
aget -n 10 http://ipv4.download.thinkbroadband.com/1GB.zipAttempting to read log file aget-1GB.zip.log for resuming download job... Couldn't find log file for this download, starting a clean job... Head-Request Connection established Downloading /1GB.zip (1073741824 bytes) from site ipv4.download.thinkbroadband.com(80.249.99.148:80). Number of Threads: 10 .. [4% completed] ..... ..... [9% completed] [9% completed] ....... ....... [14% completed] [14% completed] .......... [19% completed] ............ [24% completed] ............... ............... [29% completed] [29% completed] ................. ................. [34% completed] [34% completed] .................... .................... .................... [39% completed] [39% completed] [39% completed] ...................... [44% completed] .......................... ........................ [49% completed] [49% completed] ........................... ........................... ........................... [54% completed] [54% completed] [54% completed] .............................. [59% completed] ................................ ................................ [64% completed] [64% completed] ................................... ................................... [69% completed] [69% completed] ..................................... ..................................... [74% completed] [74% completed] ........................................ ........................................ [79% completed] [79% completed] .......................................... .......................................... [84% completed] [84% completed] ............................................. ............................................. [89% completed] [89% completed] ............................................... ............................................... [94% completed] [94% completed] .................................................. [99% completed] .................................................. [100% completed] Download completed, job completed in 12 seconds. (87381 Kb/sec) Shutting down...
The next test file is from HostDime in Orlando, Florida:
aget -n 10 http://72.29.70.131/1gbfile.tgzAttempting to read log file aget-1gbfile.tgz.log for resuming download job... Couldn't find log file for this download, starting a clean job... Head-Request Connection established Downloading /1gbfile.tgz (1023410176 bytes) from site 72.29.70.131(72.29.70.131:80). Number of Threads: 10 .. .. [4% completed] [4% completed] ..... [9% completed] ....... [14% completed] .......... .......... [19% completed] [19% completed] ............ [24% completed] ............... ............... [29% completed] [29% completed] ................. ................. [34% completed] [34% completed] .................... [39% completed] ...................... ...................... ...................... [44% completed] [44% completed] [44% completed] ......................... [49% completed] ........................... [54% completed] .............................. [59% completed] ................................ [64% completed] ................................... ................................... [69% completed] [69% completed] ..................................... [74% completed] ........................................ [79% completed] .......................................... [84% completed] .............................................. ............................................ [89% completed] [89% completed] ............................................... [94% completed] .................................................. [99% completed] .................................................. [100% completed] Download completed, job completed in 15 seconds. (66628 Kb/sec) Shutting down...
And test again showed slightly worse results:
aget -n 10 http://72.29.70.131/1gbfile.tgzAttempting to read log file aget-1gbfile.tgz.log for resuming download job... Couldn't find log file for this download, starting a clean job... Head-Request Connection established Downloading /1gbfile.tgz (1023410176 bytes) from site 72.29.70.131(72.29.70.131:80). Number of Threads: 10 .. [4% completed] ..... [9% completed] ....... [14% completed] .......... [19% completed] ............ [24% completed] ............... [29% completed] ................. [34% completed] .................... [39% completed] ...................... [44% completed] ......................... ......................... ......................... [49% completed] [49% completed] [49% completed] ........................... [54% completed] .............................. .............................. [59% completed] [59% completed] ................................ [64% completed] ................................... [69% completed] ..................................... ..................................... [74% completed] [74% completed] ........................................ ........................................ [79% completed] [79% completed] .......................................... [84% completed] ............................................. [89% completed] ............................................... [94% completed] .................................................. [99% completed] .................................................. [100% completed] Download completed, job completed in 20 seconds. (49971 Kb/sec) Shutting down...
Obviously with such a low price VPS, I would expect the network to be shared among hundreds of VPS and hence the speed might be slow even though the overall port speed is fast. However, from what we can see above, the speed is pretty reasonable although obviously it is being shared by quite a few VPS (hence not very stable).
For the upload speed test, the usual three VPS are used to download the test file from the test VPS. The first is a Quickweb VPS located at Chicago, IL, which is located along the east coast is geographically closest to this VPS:
 wget 172.245.xxx.xxx/100mb.test -O /dev/null
--2013-08-22 01:21:45--  http://172.245.xxx.xxx/100mb.test
Connecting to 172.245.xxx.xxx:80... connected.
HTTP request sent, awaiting response... 200 OK
Length: 104857600 (100M) [application/octet-stream]
Saving to: `/dev/null'

100%[======================================>] 104,857,600 7.51M/s   in 14s

2013-08-22 01:21:59 (7.38 MB/s) - `/dev/null' saved [104857600/104857600]
The second test VPS used was along the west coast US and is once again a VPS from Quickweb, and it is located in Phoenix, AZ:
 wget 172.245.xxx.xxx/100mb.test -O /dev/null
--2013-08-21 21:49:38--  http://172.245.xxx.xxx/100mb.test
Connecting to 172.245.xxx.xxx:80... connected.
HTTP request sent, awaiting response... 200 OK
Length: 104857600 (100M) [application/octet-stream]
Saving to: `/dev/null'

100%[======================================>] 104,857,600 2.45M/s   in 35s

2013-08-21 21:50:13 (2.83 MB/s) - `/dev/null' saved [104857600/104857600]
Finally, for Europe, we used the VPS from Prometeus located in Millan, Italy:
wget 172.245.xxx.xxx/100mb.test -O /dev/null
--2013-08-22 09:29:52--  http://172.245.xxx.xxx/100mb.test
Connecting to 172.245.xxx.xxx:80... connected.
HTTP request sent, awaiting response... 200 OK
Length: 104857600 (100M) [application/octet-stream]
Saving to: `/dev/null'

100%[======================================>] 104,857,600 7.61M/s   in 19s

2013-08-22 09:30:11 (5.24 MB/s) - `/dev/null' saved [104857600/104857600]
It is pretty interesting to note that even in general, VPS on the west coast normally shows slowest speed among all physical locations, even though I would think Europe is less connected to the east coast than the west coast US. However I would assume it has something to do with the transits that are being used.
The final part of the technical tests are always the benchmarks and this time it is no exception. As of last few reviews, I have first tested the VPS using the benchmark script from freevps.us:
bash bench.sh
CPU model :  Intel(R) Xeon(R) CPU E3-1270 V2 @ 3.50GHz
Number of cores : 1
CPU frequency :  2799.549 MHz
Total amount of ram : 96 MB
Total amount of swap : 64 MB
System uptime :   15 days, 10:23,
Download speed from CacheFly: 43.2MB/s
Download speed from Coloat, Atlanta GA: 40.4MB/s
Download speed from Softlayer, Dallas, TX: 22.8MB/s
Download speed from Linode, Tokyo, JP: 5.91MB/s
Download speed from i3d.net, NL: 9.24MB/s
Download speed from Leaseweb, Haarlem, NL: 14.2MB/s
Download speed from Softlayer, Singapore: 4.91MB/s
Download speed from Softlayer, Seattle, WA: 8.26MB/s
Download speed from Softlayer, San Jose, CA: 15.3MB/s
Download speed from Softlayer, Washington, DC: 77.4MB/s
I/O speed :  426 MB/s
One thing that I really like about this script is the vast amount of location that this script is testing the download speed from. Even though the test files are mostly supplied by the data centre and the speed could be very different based on the port speed of these test files.
Testing again showed somewhat better results:
CPU model :  Intel(R) Xeon(R) CPU E3-1270 V2 @ 3.50GHz
Number of cores : 1
CPU frequency :  2799.549 MHz
Total amount of ram : 96 MB
Total amount of swap : 64 MB
System uptime :   15 days, 10:47,
Download speed from CacheFly: 46.8MB/s
Download speed from Coloat, Atlanta GA: 40.7MB/s
Download speed from Softlayer, Dallas, TX: 24.3MB/s
Download speed from Linode, Tokyo, JP: 6.72MB/s
Download speed from i3d.net, NL: 10.2MB/s
Download speed from Leaseweb, Haarlem, NL: 14.1MB/s
Download speed from Softlayer, Singapore: 4.30MB/s
Download speed from Softlayer, Seattle, WA: 13.8MB/s
Download speed from Softlayer, San Jose, CA: 15.4MB/s
Download speed from Softlayer, Washington, DC: 46.5MB/s
I/O speed :  716 MB/s
Some of the low VPS providers restrain the power of the CPU so much that CPU-heavy benchmarks such as Unixbench is impossible to run on these tiny VPS servers. However, in the case of Cloudshards, the Unixbench tests, to my surprise, actually ran without any issue:
   #    #  #    #  #  #    #          #####   ######  #    #   ####   #    #
   #    #  ##   #  #   #  #           #    #  #       ##   #  #    #  #    #
   #    #  # #  #  #    ##            #####   #####   # #  #  #       ######
   #    #  #  # #  #    ##            #    #  #       #  # #  #       #    #
   #    #  #   ##  #   #  #           #    #  #       #   ##  #    #  #    #
    ####   #    #  #  #    #          #####   ######  #    #   ####   #    #

   Version 5.1.3                      Based on the Byte Magazine Unix Benchmark

   Multi-CPU version                  Version 5 revisions by Ian Smith,
                                      Sunnyvale, CA, USA
   January 13, 2011                   johantheghost at yahoo period com


1 x Dhrystone 2 using register variables  1 2 3 4 5 6 7 8 9 10

1 x Double-Precision Whetstone  1 2 3 4 5 6 7 8 9 10

1 x Execl Throughput  1 2 3

1 x File Copy 1024 bufsize 2000 maxblocks  1 2 3

1 x File Copy 256 bufsize 500 maxblocks  1 2 3

1 x File Copy 4096 bufsize 8000 maxblocks  1 2 3

1 x Pipe Throughput  1 2 3 4 5 6 7 8 9 10

1 x Pipe-based Context Switching  1 2 3 4 5 6 7 8 9 10

1 x Process Creation  1 2 3

1 x System Call Overhead  1 2 3 4 5 6 7 8 9 10

1 x Shell Scripts (1 concurrent)  1 2 3

1 x Shell Scripts (8 concurrent)  1 2 3

========================================================================
   BYTE UNIX Benchmarks (Version 5.1.3)

   System: xxx: GNU/Linux
   OS: GNU/Linux -- 2.6.32-042stab076.8 -- #1 SMP Tue May 14 20:38:14 MSK 2013
   Machine: i686 (unknown)
   Language: en_US.utf8 (charmap="ANSI_X3.4-1968", collate="ANSI_X3.4-1968")
   CPU 0: Intel(R) Xeon(R) CPU E3-1270 V2 @ 3.50GHz (7000.6 bogomips)
          Hyper-Threading, x86-64, MMX, Physical Address Ext, SYSENTER/SYSEXIT, SYSCALL/SYSRET, Intel virtualization
   11:12:24 up 14 days, 13:28,  2 users,  load average: 0.07, 0.02, 0.25; runlevel 2

------------------------------------------------------------------------
Benchmark Run: Wed Aug 21 2013 11:12:24 - 11:40:59
1 CPU in system; running 1 parallel copy of tests

Dhrystone 2 using register variables       19958400.0 lps   (10.0 s, 7 samples)
Double-Precision Whetstone                     3804.4 MWIPS (10.0 s, 7 samples)
Execl Throughput                               5491.2 lps   (30.0 s, 2 samples)
File Copy 1024 bufsize 2000 maxblocks        589748.5 KBps  (30.0 s, 2 samples)
File Copy 256 bufsize 500 maxblocks          161017.7 KBps  (30.0 s, 2 samples)
File Copy 4096 bufsize 8000 maxblocks       1558692.2 KBps  (30.0 s, 2 samples)
Pipe Throughput                              957789.7 lps   (10.0 s, 7 samples)
Pipe-based Context Switching                 215934.3 lps   (10.0 s, 7 samples)
Process Creation                              14156.7 lps   (30.0 s, 2 samples)
Shell Scripts (1 concurrent)                   5885.6 lpm   (60.0 s, 2 samples)
Shell Scripts (8 concurrent)                    774.6 lpm   (60.0 s, 2 samples)
System Call Overhead                         728123.4 lps   (10.0 s, 7 samples)

System Benchmarks Index Values               BASELINE       RESULT    INDEX
Dhrystone 2 using register variables         116700.0   19958400.0   1710.2
Double-Precision Whetstone                       55.0       3804.4    691.7
Execl Throughput                                 43.0       5491.2   1277.0
File Copy 1024 bufsize 2000 maxblocks          3960.0     589748.5   1489.3
File Copy 256 bufsize 500 maxblocks            1655.0     161017.7    972.9
File Copy 4096 bufsize 8000 maxblocks          5800.0    1558692.2   2687.4
Pipe Throughput                               12440.0     957789.7    769.9
Pipe-based Context Switching                   4000.0     215934.3    539.8
Process Creation                                126.0      14156.7   1123.5
Shell Scripts (1 concurrent)                     42.4       5885.6   1388.1
Shell Scripts (8 concurrent)                      6.0        774.6   1290.9
System Call Overhead                          15000.0     728123.4    485.4
                                                                   ========
System Benchmarks Index Score                                        1075.3
The fact it runs is already a good sign, however in this case the test on the VPS not only runs, but also gives pretty good score, which is impressive.
Testing again showed similar results:
   #    #  #    #  #  #    #          #####   ######  #    #   ####   #    #
   #    #  ##   #  #   #  #           #    #  #       ##   #  #    #  #    #
   #    #  # #  #  #    ##            #####   #####   # #  #  #       ######
   #    #  #  # #  #    ##            #    #  #       #  # #  #       #    #
   #    #  #   ##  #   #  #           #    #  #       #   ##  #    #  #    #
    ####   #    #  #  #    #          #####   ######  #    #   ####   #    #

   Version 5.1.3                      Based on the Byte Magazine Unix Benchmark

   Multi-CPU version                  Version 5 revisions by Ian Smith,
                                      Sunnyvale, CA, USA
   January 13, 2011                   johantheghost at yahoo period com


1 x Dhrystone 2 using register variables  1 2 3 4 5 6 7 8 9 10

1 x Double-Precision Whetstone  1 2 3 4 5 6 7 8 9 10

1 x Execl Throughput  1 2 3

1 x File Copy 1024 bufsize 2000 maxblocks  1 2 3

1 x File Copy 256 bufsize 500 maxblocks  1 2 3

1 x File Copy 4096 bufsize 8000 maxblocks  1 2 3

1 x Pipe Throughput  1 2 3 4 5 6 7 8 9 10

1 x Pipe-based Context Switching  1 2 3 4 5 6 7 8 9 10

1 x Process Creation  1 2 3

1 x System Call Overhead  1 2 3 4 5 6 7 8 9 10

1 x Shell Scripts (1 concurrent)  1 2 3

1 x Shell Scripts (8 concurrent)  1 2 3

========================================================================
   BYTE UNIX Benchmarks (Version 5.1.3)

   System: *******: GNU/Linux
   OS: GNU/Linux -- 2.6.32-042stab076.8 -- #1 SMP Tue May 14 20:38:14 MSK 2013
   Machine: i686 (unknown)
   Language: en_US.utf8 (charmap="ANSI_X3.4-1968", collate="ANSI_X3.4-1968")
   CPU 0: Intel(R) Xeon(R) CPU E3-1270 V2 @ 3.50GHz (7000.6 bogomips)
          Hyper-Threading, x86-64, MMX, Physical Address Ext, SYSENTER/SYSEXIT, SYSCALL/SYSRET, Intel virtualization
   10:14:30 up 14 days, 12:30,  1 user,  load average: 0.00, 0.00, 0.12; runlevel 2

------------------------------------------------------------------------
Benchmark Run: Wed Aug 21 2013 10:14:30 - 10:43:05
1 CPU in system; running 1 parallel copy of tests

Dhrystone 2 using register variables       19814283.2 lps   (10.0 s, 7 samples)
Double-Precision Whetstone                     3809.7 MWIPS (10.0 s, 7 samples)
Execl Throughput                               5476.6 lps   (30.0 s, 2 samples)
File Copy 1024 bufsize 2000 maxblocks        598330.8 KBps  (30.0 s, 2 samples)
File Copy 256 bufsize 500 maxblocks          155591.7 KBps  (30.0 s, 2 samples)
File Copy 4096 bufsize 8000 maxblocks       1616739.8 KBps  (30.0 s, 2 samples)
Pipe Throughput                              956881.2 lps   (10.0 s, 7 samples)
Pipe-based Context Switching                 215955.0 lps   (10.0 s, 7 samples)
Process Creation                              14245.0 lps   (30.0 s, 2 samples)
Shell Scripts (1 concurrent)                   5914.5 lpm   (60.0 s, 2 samples)
Shell Scripts (8 concurrent)                    787.7 lpm   (60.0 s, 2 samples)
System Call Overhead                         727411.1 lps   (10.0 s, 7 samples)

System Benchmarks Index Values               BASELINE       RESULT    INDEX
Dhrystone 2 using register variables         116700.0   19814283.2   1697.9
Double-Precision Whetstone                       55.0       3809.7    692.7
Execl Throughput                                 43.0       5476.6   1273.6
File Copy 1024 bufsize 2000 maxblocks          3960.0     598330.8   1510.9
File Copy 256 bufsize 500 maxblocks            1655.0     155591.7    940.1
File Copy 4096 bufsize 8000 maxblocks          5800.0    1616739.8   2787.5
Pipe Throughput                               12440.0     956881.2    769.2
Pipe-based Context Switching                   4000.0     215955.0    539.9
Process Creation                                126.0      14245.0   1130.6
Shell Scripts (1 concurrent)                     42.4       5914.5   1394.9
Shell Scripts (8 concurrent)                      6.0        787.7   1312.8
System Call Overhead                          15000.0     727411.1    484.9
                                                                   ========
System Benchmarks Index Score                                        1078.4
Finally, the Geekbench score:
System Information
  Platform:                  Linux x86 (32-bit)
  Compiler:                  GCC 4.1.2 20070925 (Red Hat 4.1.2-33)
  Operating System:          Linux 2.6.32-042stab076.8 i686
  Model:                     Linux PC (Intel(R) Xeon(R) CPU E3-1270 V2 @ 3.50GHz)
  Motherboard:               Unknown Motherboard
  Processor:                 Intel(R) Xeon(R) CPU E3-1270 V2 @ 3.50GHz
  Processor ID:              GenuineIntel Family 6 Model 58 Stepping 9
  Logical Processors:        1
  Physical Processors:       1
  Processor Frequency:       2.80 GHz
  L1 Instruction Cache:      0.00 B
  L1 Data Cache:             0.00 B
  L2 Cache:                  256 KB
  L3 Cache:                  0.00 B
  Bus Frequency:             0.00 Hz
  Memory:                    96.0 MB
  Memory Type:               N/A
  SIMD:                      1
  BIOS:                      N/A
  Processor Model:                 Intel(R) Xeon(R) CPU E3-1270 V2 @ 3.50GHz
  Processor Cores:           1

Integer
  Blowfish
    single-threaded scalar    2441 |||||||||
    multi-threaded scalar     2069 ||||||||
  Text Compress
    single-threaded scalar    2695 ||||||||||
    multi-threaded scalar     2623 ||||||||||
  Text Decompress
    single-threaded scalar    2717 ||||||||||
    multi-threaded scalar     2800 |||||||||||
  Image Compress
    single-threaded scalar    2645 ||||||||||
    multi-threaded scalar     2595 ||||||||||
  Image Decompress
    single-threaded scalar    2660 ||||||||||
    multi-threaded scalar     2729 ||||||||||
  Lua
    single-threaded scalar    4107 ||||||||||||||||
    multi-threaded scalar     3690 ||||||||||||||

Floating Point
  Mandelbrot
    single-threaded scalar    2925 |||||||||||
    multi-threaded scalar     2452 |||||||||
  Dot Product
    single-threaded scalar    4807 |||||||||||||||||||
    multi-threaded scalar     4162 ||||||||||||||||
    single-threaded vector    7337 |||||||||||||||||||||||||||||
    multi-threaded vector     8500 ||||||||||||||||||||||||||||||||||
  LU Decomposition
    single-threaded scalar    3708 ||||||||||||||
    multi-threaded scalar     3771 |||||||||||||||
  Primality Test
    single-threaded scalar    4409 |||||||||||||||||
    multi-threaded scalar     3550 ||||||||||||||
  Sharpen Image
    single-threaded scalar   12191 ||||||||||||||||||||||||||||||||||||||||||||||||
    multi-threaded scalar    12317 |||||||||||||||||||||||||||||||||||||||||||||||||
  Blur Image
    single-threaded scalar    9323 |||||||||||||||||||||||||||||||||||||
    multi-threaded scalar     8127 ||||||||||||||||||||||||||||||||

Memory
  Read Sequential
    single-threaded scalar    9222 ||||||||||||||||||||||||||||||||||||
  Write Sequential
    single-threaded scalar   12147 ||||||||||||||||||||||||||||||||||||||||||||||||
  Stdlib Allocate
    single-threaded scalar    5558 ||||||||||||||||||||||
  Stdlib Write
    single-threaded scalar    8598 ||||||||||||||||||||||||||||||||||
  Stdlib Copy
    single-threaded scalar   17044 ||||||||||||||||||||||||||||||||||||||||||||||||||||||||||||||||||||

Stream
  Stream Copy
    single-threaded scalar    7879 |||||||||||||||||||||||||||||||
    single-threaded vector    9704 ||||||||||||||||||||||||||||||||||||||
  Stream Scale
    single-threaded scalar    8180 ||||||||||||||||||||||||||||||||
    single-threaded vector    7450 |||||||||||||||||||||||||||||
  Stream Add
    single-threaded scalar    6745 ||||||||||||||||||||||||||
    single-threaded vector    7345 |||||||||||||||||||||||||||||
  Stream Triad
    single-threaded scalar    7453 |||||||||||||||||||||||||||||
    single-threaded vector    5616 ||||||||||||||||||||||

Integer Score:                2814 |||||||||||
Floating Point Score:         6255 |||||||||||||||||||||||||
Memory Score:                10513 ||||||||||||||||||||||||||||||||||||||||||
Stream Score:                 7546 ||||||||||||||||||||||||||||||

Overall Geekbench Score:      6031 ||||||||||||||||||||||||
Testing again showed somewhat worse results, but still quite impressive:
System Information
  Platform:                  Linux x86 (32-bit)
  Compiler:                  GCC 4.1.2 20070925 (Red Hat 4.1.2-33)
  Operating System:          Linux 2.6.32-042stab079.5 i686
  Model:                     Linux PC (Intel(R) Xeon(R) CPU E3-1240 V2 @ 3.40GHz)
  Motherboard:               Unknown Motherboard
  Processor:                 Intel(R) Xeon(R) CPU E3-1240 V2 @ 3.40GHz
  Processor ID:              GenuineIntel Family 6 Model 58 Stepping 9
  Logical Processors:        1
  Physical Processors:       1
  Processor Frequency:       3.40 GHz
  L1 Instruction Cache:      0.00 B
  L1 Data Cache:             0.00 B
  L2 Cache:                  256 KB
  L3 Cache:                  0.00 B
  Bus Frequency:             0.00 Hz
  Memory:                    256 MB
  Memory Type:               N/A
  SIMD:                      1
  BIOS:                      N/A
  Processor Model:                 Intel(R) Xeon(R) CPU E3-1240 V2 @ 3.40GHz
  Processor Cores:           1

Integer
  Blowfish
    single-threaded scalar    2316 |||||||||
    multi-threaded scalar     2443 |||||||||
  Text Compress
    single-threaded scalar    2841 |||||||||||
    multi-threaded scalar     2649 ||||||||||
  Text Decompress
    single-threaded scalar    3122 ||||||||||||
    multi-threaded scalar     3051 ||||||||||||
  Image Compress
    single-threaded scalar    2526 ||||||||||
    multi-threaded scalar     2475 |||||||||
  Image Decompress
    single-threaded scalar    2200 ||||||||
    multi-threaded scalar     2311 |||||||||
  Lua
    single-threaded scalar    4202 ||||||||||||||||
    multi-threaded scalar     3960 |||||||||||||||

Floating Point
  Mandelbrot
    single-threaded scalar    2939 |||||||||||
    multi-threaded scalar     2994 |||||||||||
  Dot Product
    single-threaded scalar    4645 ||||||||||||||||||
    multi-threaded scalar     4934 |||||||||||||||||||
    single-threaded vector    6810 |||||||||||||||||||||||||||
    multi-threaded vector     7599 ||||||||||||||||||||||||||||||
  LU Decomposition
    single-threaded scalar    3405 |||||||||||||
    multi-threaded scalar     3578 ||||||||||||||
  Primality Test
    single-threaded scalar    4714 ||||||||||||||||||
    multi-threaded scalar     3847 |||||||||||||||
  Sharpen Image
    single-threaded scalar   10348 |||||||||||||||||||||||||||||||||||||||||
    multi-threaded scalar     9330 |||||||||||||||||||||||||||||||||||||
  Blur Image
    single-threaded scalar    8124 ||||||||||||||||||||||||||||||||
    multi-threaded scalar     7944 |||||||||||||||||||||||||||||||

Memory
  Read Sequential
    single-threaded scalar    8119 ||||||||||||||||||||||||||||||||
  Write Sequential
    single-threaded scalar    9897 |||||||||||||||||||||||||||||||||||||||
  Stdlib Allocate
    single-threaded scalar    4644 ||||||||||||||||||
  Stdlib Write
    single-threaded scalar    7312 |||||||||||||||||||||||||||||
  Stdlib Copy
    single-threaded scalar   14908 |||||||||||||||||||||||||||||||||||||||||||||||||||||||||||

Stream
  Stream Copy
    single-threaded scalar    5601 ||||||||||||||||||||||
    single-threaded vector    6415 |||||||||||||||||||||||||
  Stream Scale
    single-threaded scalar    5712 ||||||||||||||||||||||
    single-threaded vector    6367 |||||||||||||||||||||||||
  Stream Add
    single-threaded scalar    5590 ||||||||||||||||||||||
    single-threaded vector    6241 ||||||||||||||||||||||||
  Stream Triad
    single-threaded scalar    5606 ||||||||||||||||||||||
    single-threaded vector    4665 ||||||||||||||||||

Integer Score:                2841 |||||||||||
Floating Point Score:         5800 |||||||||||||||||||||||
Memory Score:                 8976 |||||||||||||||||||||||||||||||||||
Stream Score:                 5774 |||||||||||||||||||||||

Overall Geekbench Score:      5396 |||||||||||||||||||||
As you can see, the CPU is running at 2.8GHz even though the clock speed is 3.5GHz, which is a “weird” way to throttle it (although it is possible that the slow down was simply caused by the internal power management system on the CPU.) Nonetheless, the overall performance of the VPS is decent and more than 6000 points for such a small VPS is definitely impressive.
Customer Service and Support
Even though Harry was the only person who appears to do the support for CloudShards, I don’t think by any means the support was lagging behind. A ticket that I have submitted at 10:14am on a Saturday morning was answered in 16 minutes, which is pretty fast.
Conclusion
Many people like to equate small, cheap VPS with low performance or bad support, since they generally don’t cost much. However in the case of CloudShards, even though the VPS is at a pretty low cost of slightly more than 10 USD per year, the performance is definitely impressive. Overall for such a small VPS, the network is pretty good, disk I/O is impressive and the support is pretty solid as well. As such, even though due to the RAM constraint you may not be able to run the entire Google on this VPS, however if you are looking to run some small application (or even a site like this one!), CloudShard would definitely worth considering.
Hey! Do you stopped writing articles!
I liked your reviews and always considered them as one of the factors to purchase one of these little boxes.
Agreed, I have simply giving myself too many execuses to slack off. Time to pick up the game again! I still have some half-written reviews waiting to be published, let me clean those ones out of the queue first and then it would be the time to post a few more reviews!
New review up! 🙂
Cool!
So, after reading the last post at LEB about Catalyst, you are “that” guy? I didn’t knew until now :O
Nevermind xD So, I still don’t know who are you… 😛
One review up after a very long time