
96MB Low End VPS Review Part 68–CatalystHost 2GB
CatalystHost was recently reviewed on 96MB by one of the readers, jcaleb, and normally it is not customary for me to review VPS that has been reviewed not very long ago. However, I made an exception to this one partially because jcaleb was focusing on the customer service aspect of CatalystHost and I would focus a bit more on the “objective” aspects of it, and also because it is rare to see a relatively “new” provider receives almost nothing but positive reviews on major forums on the low end VPS community. Therefore, when they have made the 2GB RAM plan available (yes, it seems to me almost every single major providers is now running this plan), I have decided to get one myself and check it out.
Basic Information and Setup
As per their advertisement on LowEndTalk, here is what you get for 7USD per month:
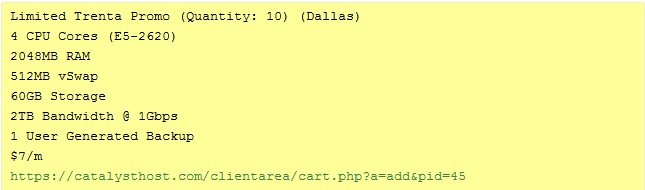
Note that even though many providers offer the 2GB plan, the plan offered by CatalystHost is slightly more generous than the others as it has 60GB of storage (versus 50GB in most other cases) and 2TB of bandwidth. Furthermore, the plan is on 1Gbps port, which is great (at least in theory) as well.
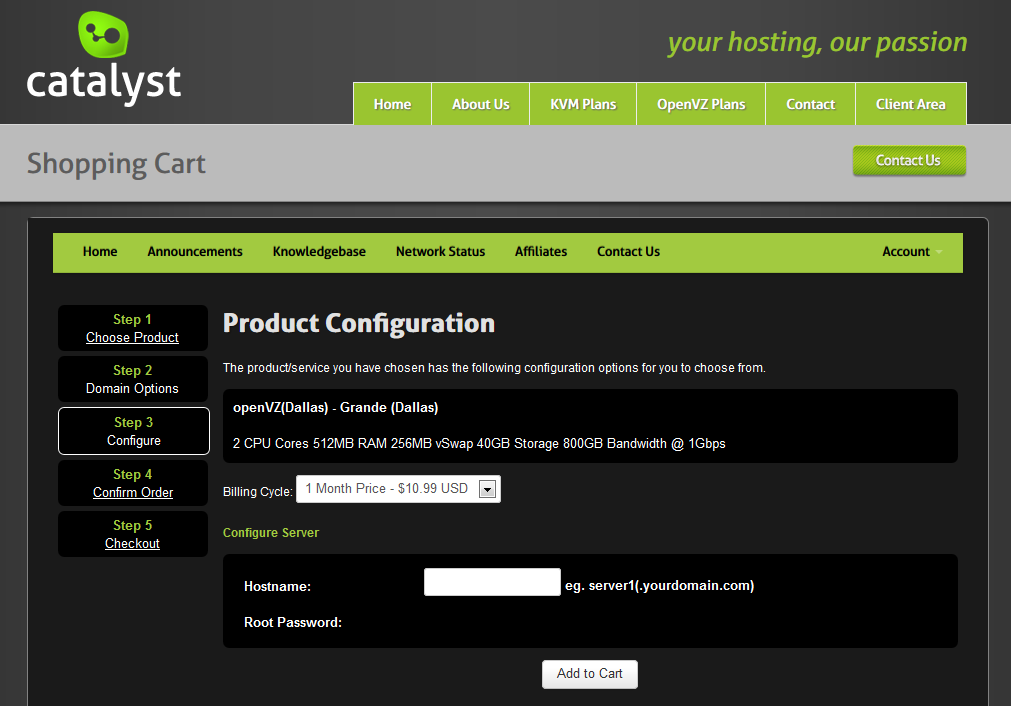
The sign up page is standard WHMCS system on secured HTTP protocol (interestingly, their entire website seems to be on HTTPs protocol). However, it basically does not offer any customization option other than input the hostname:
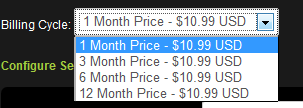
You can also select the billing period, however there is no incentive for people to choose longer periods:
It is also interesting to note that click on the Client Area link on both top and at the footer are not working, when I click on any of them, I just get to the home page.
The provision was instant and I was able to receive the VPS the moment I have received the receipts from Paypal. As an addon service, they allow a single domain to be hosted via their DNS. This might be useful if you are in need of finding a DNS hosting quickly for a single domain. However in most of the cases, I prefer to separate the DNS provider with my VPS providers, and there are many DNS providers that have free plans available such as Hurricane Electric and Cloudflare.
Once logged into their WHMCS system, you would find the details about the VPS under My Services:

Note that the domain of the VPS was automatically assigned based on the first letter of the first and last name of the user and as a subdomain of catalysthost.com. However, I do not think the subdomain is actually “active”, i.e., you can’t really visit the websites hosted on this VPS using this subdomain, it is merely just to get around with the fact that SolusVM now requires FQDN as the name of the VPS.
Also, note that CatalystHost uses pro-rated billing, and therefore my first bill was slightly higher than the recurring price and my monthly bills is always due on the first day of the month.
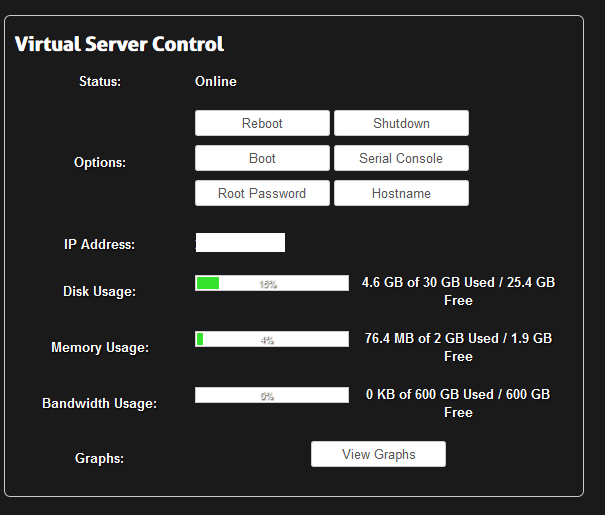
The integrated control panel was placed at the bottom of the page, where you can perform basic tasks on the VPS:
I actually tried to reveal the graphs of the VPS but unfortunately they seem to have been disabled:

Catalysthost uses SolusVM as their VPS control panel, and it is logged in via unsecured HTTP interface. Once logged in, the standard Bootstrap interface can be seen:
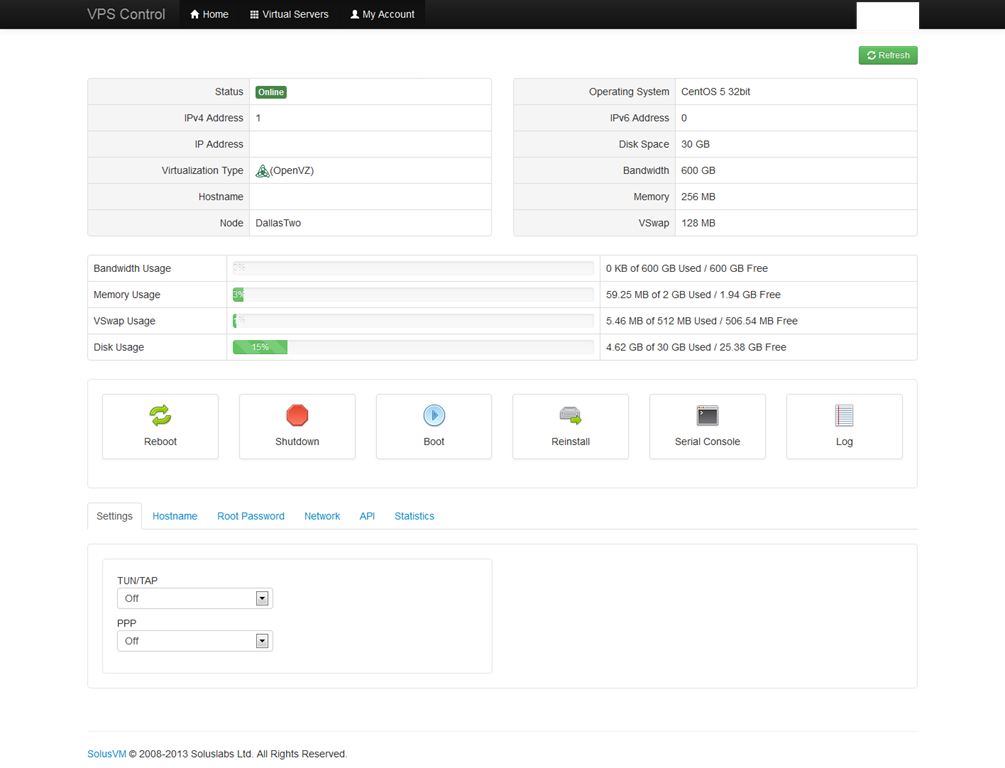
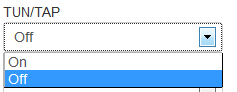
On the Settings tab, you can turn on the TUN/TAP interface and the PPP interface, which is useful for those who would like to use the VPS for VPN purposes (although I personally would consider it a waste to run VPN only on a VPS with 2GB of RAM).

The OS templates available are mostly the standard OS distributions, however there is a few turnkey templates available:

Instant rDNS is available, even though the IP itself is from Incero:

Test on the VPS
As mentioned above, the VPS that I have ordered for testing comes with 2GB of dedicated RAM and 512MB of Swap space, 30GB of hard drive space and 600GB of RAM. It is located in Incero datacenter in Dallas, Texas and I have used Debian 6 32 bit for testing purposes.
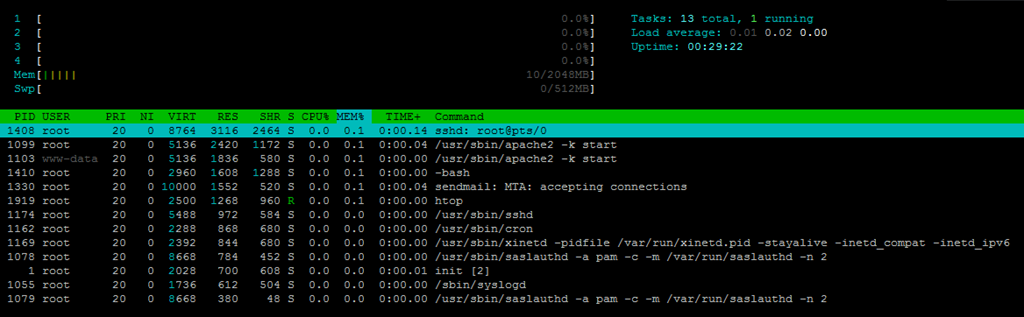
When the OS template was first loaded, 7MB of RAM space was used, which is pretty standard for the Debian 6 OpenVZ template:
free -m
             total       used       free     shared    buffers     cached
Mem:          2048         21       2026          0          0         13
-/+ buffers/cache:          7       2040
Swap:          512          0        512
Top showing the process running:
top - 20:21:14 up 26 min,  1 user,  load average: 0.00, 0.00, 0.00
Tasks:  15 total,   1 running,  14 sleeping,   0 stopped,   0 zombie
Cpu(s):  0.0%us,  0.0%sy,  0.0%ni,100.0%id,  0.0%wa,  0.0%hi,  0.0%si,  0.0%st
Mem:   2097152k total,    22568k used,  2074584k free,        0k buffers
Swap:   524288k total,        0k used,   524288k free,    14396k cached

  PID USER      PR  NI  VIRT  RES  SHR S %CPU %MEM    TIME+  COMMAND
 1408 root      20   0  8764 3116 2464 S    0  0.1   0:00.12 sshd
 1099 root      20   0  5136 2420 1172 S    0  0.1   0:00.03 apache2
 1103 www-data  20   0  5136 1836  580 S    0  0.1   0:00.00 apache2
 1410 root      20   0  2960 1600 1284 S    0  0.1   0:00.00 bash
 1330 root      20   0 10000 1552  520 S    0  0.1   0:00.03 sendmail-mta
 1418 root      20   0  2328 1076  884 R    0  0.1   0:00.00 top
 1174 root      20   0  5488  972  584 S    0  0.0   0:00.00 sshd
 1162 root      20   0  2288  868  680 S    0  0.0   0:00.00 cron
 1169 root      20   0  2392  844  680 S    0  0.0   0:00.00 xinetd
 1078 root      20   0  8668  784  452 S    0  0.0   0:00.00 saslauthd
    1 root      20   0  2028  700  608 S    0  0.0   0:00.01 init
 1055 root      20   0  1736  612  504 S    0  0.0   0:00.00 syslogd
 1079 root      20   0  8668  380   48 S    0  0.0   0:00.00 saslauthd
    2 root      20   0     0    0    0 S    0  0.0   0:00.00 kthreadd/744
    3 root      20   0     0    0    0 S    0  0.0   0:00.00 khelper/744
Htop output:
About 405MB of hard drive space was used:
df -h
Filesystem            Size  Used Avail Use% Mounted on
/dev/simfs             60G  405M   60G   1% /
tmpfs                 1.0G     0  1.0G   0% /lib/init/rw
tmpfs                 1.0G     0  1.0G   0% /dev/shm
And 1% of iNodes were used:
df -i
Filesystem            Inodes   IUsed   IFree IUse% Mounted on
/dev/simfs           15360000   25772 15334228    1% /
tmpfs                 262144       4  262140    1% /lib/init/rw
tmpfs                 262144       1  262143    1% /dev/shm
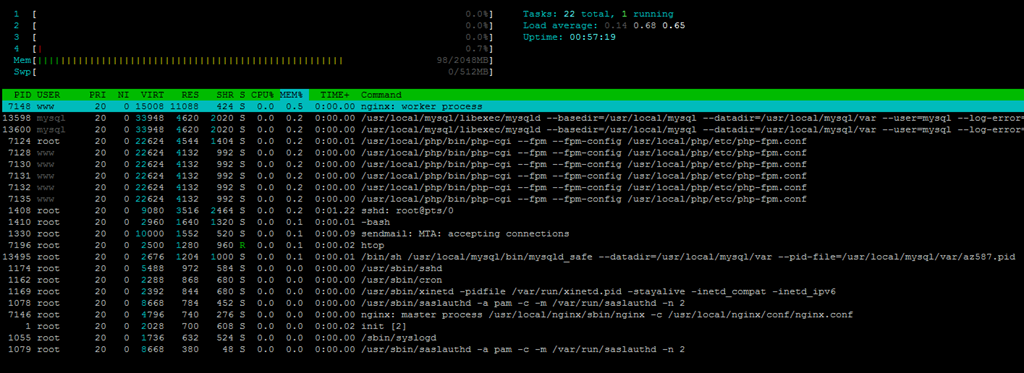
When the full LNMP stack was loaded, close to 100MB of RAM was used:
free -m
             total       used       free     shared    buffers     cached
Mem:          2048       1363        684          0          0       1265
-/+ buffers/cache:         97       1950
Swap:          512          0        512
Top showing the processes running:
top - 08:51:39 up 56 min,  1 user,  load average: 0.21, 0.74, 0.67
Tasks:  23 total,   1 running,  22 sleeping,   0 stopped,   0 zombie
Cpu(s):  0.0%us,  0.0%sy,  0.0%ni,100.0%id,  0.0%wa,  0.0%hi,  0.0%si,  0.0%st
Mem:   2097152k total,  1396352k used,   700800k free,        0k buffers
Swap:   524288k total,        0k used,   524288k free,  1296076k cached

  PID USER      PR  NI  VIRT  RES  SHR S %CPU %MEM    TIME+  COMMAND
 7148 www       20   0 15008  10m  424 S    0  0.5   0:00.00 nginx
13598 mysql     20   0 33948 4620 2020 S    0  0.2   0:00.00 mysqld
 7124 root      20   0 22624 4544 1404 S    0  0.2   0:00.00 php-cgi
 7128 www       20   0 22624 4132  992 S    0  0.2   0:00.00 php-cgi
 7130 www       20   0 22624 4132  992 S    0  0.2   0:00.00 php-cgi
 7131 www       20   0 22624 4132  992 S    0  0.2   0:00.00 php-cgi
 7132 www       20   0 22624 4132  992 S    0  0.2   0:00.00 php-cgi
 7135 www       20   0 22624 4132  992 S    0  0.2   0:00.00 php-cgi
 1408 root      20   0  9080 3516 2464 S    0  0.2   0:01.22 sshd
 1410 root      20   0  2960 1640 1320 S    0  0.1   0:00.01 bash
 1330 root      20   0 10000 1552  520 S    0  0.1   0:00.09 sendmail-mta
13495 root      20   0  2676 1204 1000 S    0  0.1   0:00.01 mysqld_safe
 7195 root      20   0  2328 1080  884 R    0  0.1   0:00.00 top
 1174 root      20   0  5488  972  584 S    0  0.0   0:00.00 sshd
 1162 root      20   0  2288  868  680 S    0  0.0   0:00.00 cron
 1169 root      20   0  2392  844  680 S    0  0.0   0:00.00 xinetd
 1078 root      20   0  8668  784  452 S    0  0.0   0:00.00 saslauthd
And htop output:
About 1.6GB of hard drive space was used:
df -h
Filesystem            Size  Used Avail Use% Mounted on
/dev/simfs             60G  1.6G   59G   3% /
tmpfs                 1.0G     0  1.0G   0% /lib/init/rw
tmpfs                 1.0G     0  1.0G   0% /dev/shm
And the inodes limit, being set so high, was almost having no impact percentage-wise:
 df -i
Filesystem            Inodes   IUsed   IFree IUse% Mounted on
/dev/simfs           15360000   68808 15291192    1% /
tmpfs                 262144       4  262140    1% /lib/init/rw
tmpfs                 262144       1  262143    1% /dev/shm
Uptime shows the VPS is quite stable:
uptime
 22:05:14 up 16 days,  7:32,  1 user,  load average: 0.00, 0.00, 0.00
VMStat shows there is no iowait.
vmstat
procs -----------memory---------- ---swap-- -----io---- -system-- ----cpu----
 r  b   swpd   free   buff  cache   si   so    bi    bo   in   cs us sy id wa
 0  0    272 502392      0 1564128    0    0     0     1    0    1  0  0 100  0
Beancounters shows no failure count, which is good:
cat /proc/user_beancounters
Version: 2.5
       uid  resource                     held              maxheld              barrier                limit              failcnt
      xxx:  kmemsize                 80239147             82427904  9223372036854775807  9223372036854775807                    0
            lockedpages                     0                    0  9223372036854775807  9223372036854775807                    0
            privvmpages                 18128                53256  9223372036854775807  9223372036854775807                    0
            shmpages                     1282                 1938  9223372036854775807  9223372036854775807                    0
            dummy                           0                    0                    0                    0                    0
            numproc                        26                   87                  400                  400                    0
            physpages                  519056               524276                    0               524288                    0
            vmguarpages                     0                    0  9223372036854775807  9223372036854775807                    0
            oomguarpages                 5707                15593  9223372036854775807  9223372036854775807                    0
            numtcpsock                      8                   20  9223372036854775807  9223372036854775807                    0
            numflock                        4                   10  9223372036854775807  9223372036854775807                    0
            numpty                          1                    7  9223372036854775807  9223372036854775807                    0
            numsiginfo                      0                   63  9223372036854775807  9223372036854775807                    0
            tcpsndbuf                  298792               538592  9223372036854775807  9223372036854775807                    0
            tcprcvbuf                  131072             36031720  9223372036854775807  9223372036854775807                    0
            othersockbuf                 9248                26672  9223372036854775807  9223372036854775807                    0
            dgramrcvbuf                     0                 4624  9223372036854775807  9223372036854775807                    0
            numothersock                   73                   77  9223372036854775807  9223372036854775807                    0
            dcachesize               77561098             77719754  9223372036854775807  9223372036854775807                    0
            numfile                       397                  565  9223372036854775807  9223372036854775807                    0
            dummy                           0                    0                    0                    0                    0
            dummy                           0                    0                    0                    0                    0
            dummy                           0                    0                    0                    0                    0
            numiptent                      24                   24                  300                  300                    0
I somewhat inclined to think vzfree is no longer useful in the new OpenVZ set up because every time I run it, it is giving me some outlandish result like the following:
vzfree
             Total     Used     Free
Kernel:   8796093022208.00M   15.00M 8796093022193.00M
Allocate: 36028797018963968.00M   72.94M 36028797018963896.00M (36028797018963967M Guaranteed)
Commit:   36028797018963968.00M   29.95M 36028797018963940.00M (20.5% of Allocated)
Swap:              -1249.54M          (-8356.3% of Committed)
The CPU this VPS is running on is the fairly new E5-2620 and there are four cores assigned to the CPU and it appears that none of the cores is throttled:
cat /proc/cpuinfo
processor       : 0
vendor_id       : GenuineIntel
cpu family      : 6
model           : 45
model name      : Intel(R) Xeon(R) CPU E5-2620 0 @ 2.00GHz
stepping        : 7
cpu MHz         : 2000.123
cache size      : 15360 KB
physical id     : 0
siblings        : 12
core id         : 0
cpu cores       : 6
apicid          : 0
initial apicid  : 0
fpu             : yes
fpu_exception   : yes
cpuid level     : 13
wp              : yes
flags           : fpu vme de pse tsc msr pae mce cx8 apic sep mtrr pge mca cmov pat pse36 clflush dts acpi mmx fxsr sse sse2 ss ht tm pbe syscall nx pdpe1gb rdtscp lm constant_tsc arch_perfmon pebs bts rep_good xtopology nonstop_tsc aperfmperf pni pclmulqdq dtes64 monitor ds_cpl vmx smx est tm2 ssse3 cx16 xtpr pdcm dca sse4_1 sse4_2 x2apic popcnt aes xsave avx lahf_lm arat epb xsaveopt pln pts dts tpr_shadow vnmi flexpriority ept vpid
bogomips        : 4000.24
clflush size    : 64
cache_alignment : 64
address sizes   : 46 bits physical, 48 bits virtual
power management:

processor       : 1
vendor_id       : GenuineIntel
cpu family      : 6
model           : 45
model name      : Intel(R) Xeon(R) CPU E5-2620 0 @ 2.00GHz
stepping        : 7
cpu MHz         : 2000.123
cache size      : 15360 KB
physical id     : 0
siblings        : 12
core id         : 1
cpu cores       : 6
apicid          : 2
initial apicid  : 2
fpu             : yes
fpu_exception   : yes
cpuid level     : 13
wp              : yes
flags           : fpu vme de pse tsc msr pae mce cx8 apic sep mtrr pge mca cmov pat pse36 clflush dts acpi mmx fxsr sse sse2 ss ht tm pbe syscall nx pdpe1gb rdtscp lm constant_tsc arch_perfmon pebs bts rep_good xtopology nonstop_tsc aperfmperf pni pclmulqdq dtes64 monitor ds_cpl vmx smx est tm2 ssse3 cx16 xtpr pdcm dca sse4_1 sse4_2 x2apic popcnt aes xsave avx lahf_lm arat epb xsaveopt pln pts dts tpr_shadow vnmi flexpriority ept vpid
bogomips        : 4000.24
clflush size    : 64
cache_alignment : 64
address sizes   : 46 bits physical, 48 bits virtual
power management:

processor       : 2
vendor_id       : GenuineIntel
cpu family      : 6
model           : 45
model name      : Intel(R) Xeon(R) CPU E5-2620 0 @ 2.00GHz
stepping        : 7
cpu MHz         : 2000.123
cache size      : 15360 KB
physical id     : 0
siblings        : 12
core id         : 2
cpu cores       : 6
apicid          : 4
initial apicid  : 4
fpu             : yes
fpu_exception   : yes
cpuid level     : 13
wp              : yes
flags           : fpu vme de pse tsc msr pae mce cx8 apic sep mtrr pge mca cmov pat pse36 clflush dts acpi mmx fxsr sse sse2 ss ht tm pbe syscall nx pdpe1gb rdtscp lm constant_tsc arch_perfmon pebs bts rep_good xtopology nonstop_tsc aperfmperf pni pclmulqdq dtes64 monitor ds_cpl vmx smx est tm2 ssse3 cx16 xtpr pdcm dca sse4_1 sse4_2 x2apic popcnt aes xsave avx lahf_lm arat epb xsaveopt pln pts dts tpr_shadow vnmi flexpriority ept vpid
bogomips        : 4000.24
clflush size    : 64
cache_alignment : 64
address sizes   : 46 bits physical, 48 bits virtual
power management:

processor       : 3
vendor_id       : GenuineIntel
cpu family      : 6
model           : 45
model name      : Intel(R) Xeon(R) CPU E5-2620 0 @ 2.00GHz
stepping        : 7
cpu MHz         : 2000.123
cache size      : 15360 KB
physical id     : 0
siblings        : 12
core id         : 3
cpu cores       : 6
apicid          : 6
initial apicid  : 6
fpu             : yes
fpu_exception   : yes
cpuid level     : 13
wp              : yes
flags           : fpu vme de pse tsc msr pae mce cx8 apic sep mtrr pge mca cmov pat pse36 clflush dts acpi mmx fxsr sse sse2 ss ht tm pbe syscall nx pdpe1gb rdtscp lm constant_tsc arch_perfmon pebs bts rep_good xtopology nonstop_tsc aperfmperf pni pclmulqdq dtes64 monitor ds_cpl vmx smx est tm2 ssse3 cx16 xtpr pdcm dca sse4_1 sse4_2 x2apic popcnt aes xsave avx lahf_lm arat epb xsaveopt pln pts dts tpr_shadow vnmi flexpriority ept vpid
bogomips        : 4000.24
clflush size    : 64
cache_alignment : 64
address sizes   : 46 bits physical, 48 bits virtual
power management:
Meminfo results:
 cat /proc/meminfo
MemTotal:        2097152 kB
MemFree:         1024676 kB
Cached:          1063932 kB
Active:            11412 kB
Inactive:        1057488 kB
Active(anon):       1748 kB
Inactive(anon):     3220 kB
Active(file):       9664 kB
Inactive(file):  1054268 kB
Unevictable:           0 kB
Mlocked:               0 kB
SwapTotal:        524288 kB
SwapFree:         524288 kB
Dirty:                 0 kB
Writeback:             0 kB
AnonPages:          4968 kB
Shmem:              2624 kB
Slab:               3536 kB
SReclaimable:       2008 kB
SUnreclaim:         1528 kB
And time sync:
time sync

real    0m0.019s
user    0m0.000s
sys     0m0.002s
For the download test, I was able to push close to the line speed of a 100mbit port when trying to download from Cachefly:
wget cachefly.cachefly.net/100mb.test -O /dev/null
--2013-04-30 08:54:03--  http://cachefly.cachefly.net/100mb.test
Resolving cachefly.cachefly.net... 205.234.175.175
Connecting to cachefly.cachefly.net|205.234.175.175|:80... connected.
HTTP request sent, awaiting response... 200 OK
Length: 104857600 (100M) [application/octet-stream]
Saving to: `/dev/null'

100%[=======================================================================================================================================>] 104,857,600 11.5M/s   in 8.8s

2013-04-30 08:54:12 (11.3 MB/s) - `/dev/null' saved [104857600/104857600]
However, the second time, the speed really amazed me, when the speed was almost close to 1Gbit line:
 wget cachefly.cachefly.net/100mb.test -O /dev/null
--2013-04-30 09:05:50--  http://cachefly.cachefly.net/100mb.test
Resolving cachefly.cachefly.net... 205.234.175.175
Connecting to cachefly.cachefly.net|205.234.175.175|:80... connected.
HTTP request sent, awaiting response... 200 OK
Length: 104857600 (100M) [application/octet-stream]
Saving to: `/dev/null'

100%[======================================>] 104,857,600 74.6M/s   in 1.3s

2013-04-30 09:05:51 (74.6 MB/s) - `/dev/null' saved [104857600/104857600]
Note that the time was far apart to make sure it wasn’t the node “caching” the data.
I decided to do another test just for the sake of seeing how the speed is in general, as I was writing this. And this time, the VPS did not disappoint me:
 wget cachefly.cachefly.net/100mb.test -O /dev/null
--2013-07-20 14:36:54--  http://cachefly.cachefly.net/100mb.test
Resolving cachefly.cachefly.net... 205.234.175.175
Connecting to cachefly.cachefly.net|205.234.175.175|:80... connected.
HTTP request sent, awaiting response... 200 OK
Length: 104857600 (100M) [application/octet-stream]
Saving to: `/dev/null'

100%[======================================>] 104,857,600 82.5M/s   in 1.2s

2013-07-20 14:36:56 (82.5 MB/s) - `/dev/null' saved [104857600/104857600]
Since it is pretty obvious that this is a gbit port, I’ve decided to use aget to test the multi-thread downloading and try to push the port to the full speed. The frist test is done using a 1GB test file from ThinkBroadBand, which is not typically a very fast connection:
aget -n 10 http://ipv4.download.thinkbroadband.com/1GB.zip
 Attempting to read log file aget-1GB.zip.log for resuming download job...
 Couldn't find log file for this download, starting a clean job...
 Head-Request Connection established
 Downloading /1GB.zip (1073741824 bytes) from site ipv4.download.thinkbroadband.com(80.249.99.148:80). Number of Threads: 10
..                  ...            .                                                                                                                     [4% completed]
[4% completed]
[4% completed]
.....                                              [9% completed]
.......                                            [14% completed]
..........                                         [19% completed]
............                                       [24% completed]
...............                                    [29% completed]
...............                                    [29% completed]
.................                                  [34% completed]
....................                               [39% completed]
......................                             ......................                             [44% completed]
[44% completed]
.........................                          [49% completed]
...........................                        [54% completed]
..............................                     [59% completed]
................................                   [64% completed]
...................................                [69% completed]
.....................................              [74% completed]
.....................................              [74% completed]
........................................           [79% completed]
..........................................         [84% completed]
.............................................      [89% completed]
...............................................    [94% completed]
.................................................. [99% completed]
.................................................. [100% completed]
 Download completed, job completed in 28 seconds. (37449 Kb/sec)
 Shutting down...
As you can see, the test speed for this 1GB file download is close to 40Mb/s, which is pretty reasonable.
Testing again generated even better results:
aget -n 10 http://ipv4.download.thinkbroadband.com/1GB.                                                                                                             zip
 Attempting to read log file aget-1GB.zip.log for resuming download job...
 Couldn't find log file for this download, starting a clean job...
 Head-Request Connection established
 Downloading /1GB.zip (1073741824 bytes) from site ipv4.download.thinkbroad                                                                                                             band.com(80.249.99.148:80). Number of Threads: 10
..                                                 [4% completed]
.....                                              .....                                                                                                                                                           [9% completed]
[9% completed]
.......                                            [14% completed]
..........                                         [19% completed]
............                                       [24% completed]
...............                                    [29% completed]
.................                                  [34% completed]
.................                                  [34% completed]
....................                               [39% completed]
....................                               [39% completed]
......................                             [44% completed]
.........................                          [49% completed]
...........................                        [54% completed]
..............................                     [59% completed]
................................                   [64% completed]
...................................                [69% completed]
.....................................              [74% completed]
........................................           [79% completed]
........................................           [79% completed]
..........................................         [84% completed]
..........................................         [84% completed]
.............................................      [89% completed]
...............................................    [94% completed]
.................................................. [99% completed]
.................................................. [100% completed]
 Download completed, job completed in 14 seconds. (74898 Kb/sec)
 Shutting down...
As you can see, in the second test, the speed is pretty much twice as the first one, which is great.
Second test is done using the HostDime test file located in Florida, which shows pretty good speed as well:
aget -n 10 http://72.29.70.131/1gbfile.tgz
 Attempting to read log file aget-1gbfile.tgz.log for resuming download job...
 Couldn't find log file for this download, starting a clean job...
 Head-Request Connection established
 Downloading /1gbfile.tgz (1023410176 bytes) from site 72.29.70.131(72.29.70.131:80). Number of Threads: 10
..                                                 [4% completed]
.....                                              [9% completed]
.......                                            [14% completed]
..........                                         [19% completed]
............                                       [24% completed]
...............                                    [29% completed]
.................                                  [34% completed]
....................                               ....................                           [39% completed]
    [39% completed]
......................                             [44% completed]
.........................                          [49% completed]
...........................                        [54% completed]
..............................                     [59% completed]
................................                   [64% completed]
...................................                [69% completed]
.....................................              [74% completed]
........................................           [79% completed]
........................................        . ... .......... ..........................           [79% completed]
[79% completed]
..........................................         [84% completed]
.............................................      [89% completed]
...............................................    [94% completed]
.................................................. [99% completed]
.................................................. [100% completed]
 Download completed, job completed in 22 seconds. (45428 Kb/sec)
 Shutting down...
Testing again showed somewhat better results as well:
 aget -n 10 http://72.29.70.131/1gbfile.tgz
 Attempting to read log file aget-1gbfile.tgz.log for resuming download job                                                                                                             ...
 Couldn't find log file for this download, starting a clean job...
 Head-Request Connection established
 Downloading /1gbfile.tgz (1023410176 bytes) from site 72.29.70.131(72.29.7                                                                                                             0.131:80). Number of Threads: 10
..                                                 [4% completed]
.....                                              [9% completed]
.......                                            [14% completed]
.......                                            [14% completed]
..........                                         [19% completed]
............                                       [24% completed]
...............                                    [29% completed]
...............                                    [29% completed]
.................                                  [34% completed]
....................                               [39% completed]
......................                             [44% completed]
.........................                          [49% completed]
...........................                        [54% completed]
..............................                     [59% completed]
..............................                     [59% completed]
..............................                     [59% completed]
................................                   [64% completed]
...................................                [69% completed]
.....................................              [74% completed]
........................................           .............................                                                                                                             .[79% completed]
..........           [79% completed]
..........................................         [84% completed]
.............................................      [89% completed]
...............................................    [94% completed]
...............................................    [94% completed]
.................................................. [99% completed]
.................................................. [100% completed]
 Download completed, job completed in 17 seconds. (58789 Kb/sec)
 Shutting down...
After testing the download speed, it is also necessary to test the speed of the upload. As usual, we have used three different VPS to test the upload, one at ChicagoVPS in Los Angeles, CA, representing the west coast locatopm, one at Quickweb VPS in Chicago, IL, representing the east coast location and finally a Prometeus VPS from Milan, Italy, representing the connection to the European continent.
First is the result using the ChicagoVPS LA unit:
 wget http://23.29.xxx.xxx/100mb.test -O /dev/null
--2013-04-30 09:06:53--  http://23.29.xxx.xxx/100mb.test
Connecting to 23.29.xxx.xxx:80... connected.
HTTP request sent, awaiting response... 200 OK
Length: 104857600 (100M) [application/octet-stream]
Saving to: `/dev/null'

100%[======================================>] 104,857,600 1.48M/s   in 58s

2013-04-30 09:07:52 (1.72 MB/s) - `/dev/null' saved [104857600/104857600]
At 1.72MB/s, the speed is by no means impressive. However the second test using my Quickweb VPS at Chicago, IL, really surprised me:
 wget http://23.29.xxx.xxx/100mb.test -O /dev/null
--2013-04-30 01:08:25--  http://23.29.xxx.xxx/100mb.test
Connecting to 23.29.xxx.xxx:80... connected.
HTTP request sent, awaiting response... 200 OK
Length: 104857600 (100M) [application/octet-stream]
Saving to: `/dev/null'

100%[======================================>] 104,857,600  233K/s   in 8m 10s

2013-04-30 01:16:35 (209 KB/s) - `/dev/null' saved [104857600/104857600]
A traceroute seems to reveal that it took a while for the packets to travel in the NLayer network:
traceroute to 23.29.xxx.xxx (23.29.xxx.xxx), 30 hops max, 60 byte packets
 1  chi-ipv4.neodelphi.net (216.107.xxx.xxx)  3.172 ms  3.313 ms  3.481 ms
 2  edge.ch1.serverdeals.co (173.243.120.173)  0.674 ms  0.737 ms  0.786 ms
 3  gige-g11-16.core1.chi1.he.net (184.105.253.1)  1.233 ms  1.291 ms  1.353 ms
 4  * ge-0-0-12.ar1.ord1.us.nlayer.net (69.31.111.109)  5.109 ms equinix.xe-4-0-0.cr1.ord1.us.nlayer.net (206.223.119.97)  1.703 ms
 5  * xe-3-3-0.cr1.dfw1.us.nlayer.net (69.22.142.5)  25.347 ms  25.309 ms
 6  xe-3-3-0.cr1.dfw1.us.nlayer.net (69.22.142.5)  24.161 ms ae1-50g.cr2.dfw1.us.nlayer.net (69.31.63.185)  26.356 ms xe-3-3-0.cr1.dfw1.us.nlayer.net (69.22.142.5)  24.325 ms
 7  ae1-50g.cr2.dfw1.us.nlayer.net (69.31.63.185)  25.234 ms  24.127 ms  24.326 ms
 8  ae2-11g.ar2.dfw1.us.nlayer.net (69.31.63.187)  26.096 ms  25.744 ms  26.165 ms
 9  198.47.104.74 (198.47.104.74)  24.829 ms  25.176 ms  25.782 ms
10  sc-side-from-r1.inceronetwork.com (192.211.63.2)  27.893 ms 23-29-122-66-customer-incero.com (23.29.122.66)  25.360 ms sc-side-from-r1.inceronetwork.com (192.211.63.2)  27.919 ms
11  23-29-122-116-customer-incero.com (23.29.xxx.xxx)  25.088 ms  25.311 ms 23-29-122-66-customer-incero.com (23.29.122.66)  26.283 ms
The final test is done on the Prometeus VPS at Milan, Italy:
 wget http://23.29.xxx.xxx/100mb.test -O /dev/null
--2013-04-29 21:18:48--  http://23.29.xxx.xxx/100mb.test
Connecting to 23.29.xxx.xxx:80... connected.
HTTP request sent, awaiting response... 200 OK
Length: 104857600 (100M) [application/octet-stream]
Saving to: `/dev/null'

100%[======================================>] 104,857,600 9.97M/s   in 14s

2013-04-29 21:19:02 (7.26 MB/s) - `/dev/null' saved [104857600/104857600]
As you can see, connection to Prometeus representing the best uploading speed.
The disk I/O for this VPS is probably too “good” for a HDD set up, even for RAID10 set up, which lead me to believe that it is at least SSD-cached.
dd if=/dev/zero of=test bs=64k count=16k conv=fdatasync
16384+0 records in
16384+0 records out
1073741824 bytes (1.1 GB) copied, 2.55024 s, 421 MB/s
The second test shows only half of the speed as the first one:
dd if=/dev/zero of=test bs=64k count=16k conv=fdatasync
16384+0 records in
16384+0 records out
1073741824 bytes (1.1 GB) copied, 4.0187 s, 267 MB/s
Just for curiousity I decided to do another round of dd test as I am writing this article, and this is what I can see:
dd if=/dev/zero of=test bs=64k count=16k conv=fdatasync
16384+0 records in
16384+0 records out
1073741824 bytes (1.1 GB) copied, 2.87874 s, 373 MB/s
As you can see, the speed is not exactly very consistent, however the speed is extremely fast for a HDD-based VPS.
I have also done some ioping tests to see how well the disks are responding. Initially I was using version 0.6 of ioping, which gives the results in milliseconds:
ioping -c 10 .
4096 bytes from . (simfs /vz/private/***): request=1 time=0.1 ms
4096 bytes from . (simfs /vz/private/***): request=2 time=0.1 ms
4096 bytes from . (simfs /vz/private/***): request=3 time=0.1 ms
4096 bytes from . (simfs /vz/private/***): request=4 time=0.1 ms
4096 bytes from . (simfs /vz/private/***): request=5 time=0.1 ms
4096 bytes from . (simfs /vz/private/***): request=6 time=0.2 ms
4096 bytes from . (simfs /vz/private/***): request=7 time=0.1 ms
4096 bytes from . (simfs /vz/private/***): request=8 time=0.1 ms
4096 bytes from . (simfs /vz/private/***): request=9 time=0.1 ms
4096 bytes from . (simfs /vz/private/***): request=10 time=0.2 ms

--- . (simfs /vz/private/***) ioping statistics ---
10 requests completed in 9002.5 ms, 7513 iops, 29.3 mb/s
min/avg/max/mdev = 0.1/0.1/0.2/0.0 ms
Testing again showed even better results:
 ioping -c 10 .
4096 bytes from . (simfs /vz/private/***): request=1 time=0.1 ms
4096 bytes from . (simfs /vz/private/***): request=2 time=0.1 ms
4096 bytes from . (simfs /vz/private/***): request=3 time=0.1 ms
4096 bytes from . (simfs /vz/private/***): request=4 time=0.1 ms
4096 bytes from . (simfs /vz/private/***): request=5 time=0.1 ms
4096 bytes from . (simfs /vz/private/***): request=6 time=0.1 ms
4096 bytes from . (simfs /vz/private/***): request=7 time=0.1 ms
4096 bytes from . (simfs /vz/private/***): request=8 time=0.1 ms
4096 bytes from . (simfs /vz/private/***): request=9 time=0.1 ms
4096 bytes from . (simfs /vz/private/***): request=10 time=0.1 ms

--- . (simfs /vz/private/***) ioping statistics ---
10 requests completed in 9002.3 ms, 8382 iops, 32.7 mb/s
min/avg/max/mdev = 0.1/0.1/0.1/0.0 ms
As I have completed the tests, I noticed version 0.7 is also made available, which is counting the ping roundtrip in microseconds, which is 1/1,000 of a millisecond. The results is more clear this way:
ioping -c 10 .
4.0 kb from . (simfs /vz/private/***): request=1 time=90 us
4.0 kb from . (simfs /vz/private/***): request=2 time=139 us
4.0 kb from . (simfs /vz/private/***): request=3 time=178 us
4.0 kb from . (simfs /vz/private/***): request=4 time=143 us
4.0 kb from . (simfs /vz/private/***): request=5 time=116 us
4.0 kb from . (simfs /vz/private/***): request=6 time=214 us
4.0 kb from . (simfs /vz/private/***): request=7 time=135 us
4.0 kb from . (simfs /vz/private/***): request=8 time=124 us
4.0 kb from . (simfs /vz/private/***): request=9 time=134 us
4.0 kb from . (simfs /vz/private/***): request=10 time=154 us

--- . (simfs /vz/private/***) ioping statistics ---
10 requests completed in 9.0 s, 7.0 k iops, 27.4 mb/s
min/avg/max/mdev = 90 us / 142 us / 214 us / 32 us
As you can see, there is one ping that is slightly above 0.2ms, however on average, the ioping is 0.15ms, which is really good.
 ioping -c 10 .
4.0 kb from . (simfs /vz/private/***): request=1 time=97 us
4.0 kb from . (simfs /vz/private/***): request=2 time=143 us
4.0 kb from . (simfs /vz/private/***): request=3 time=137 us
4.0 kb from . (simfs /vz/private/***): request=4 time=130 us
4.0 kb from . (simfs /vz/private/***): request=5 time=160 us
4.0 kb from . (simfs /vz/private/***): request=6 time=96 us
4.0 kb from . (simfs /vz/private/***): request=7 time=115 us
4.0 kb from . (simfs /vz/private/***): request=8 time=190 us
4.0 kb from . (simfs /vz/private/***): request=9 time=164 us
4.0 kb from . (simfs /vz/private/***): request=10 time=146 us

--- . (simfs /vz/private/***) ioping statistics ---
10 requests completed in 9.0 s, 7.3 k iops, 28.3 mb/s
min/avg/max/mdev = 96 us / 137 us / 190 us / 28 us
Once again, the second ping showed even better results.
Finally, the benchmarks.
   #    #  #    #  #  #    #          #####   ######  #    #   ####   #    #
   #    #  ##   #  #   #  #           #    #  #       ##   #  #    #  #    #
   #    #  # #  #  #    ##            #####   #####   # #  #  #       ######
   #    #  #  # #  #    ##            #    #  #       #  # #  #       #    #
   #    #  #   ##  #   #  #           #    #  #       #   ##  #    #  #    #
    ####   #    #  #  #    #          #####   ######  #    #   ####   #    #

   Version 5.1.3                      Based on the Byte Magazine Unix Benchmark

   Multi-CPU version                  Version 5 revisions by Ian Smith,
                                      Sunnyvale, CA, USA
   January 13, 2011                   johantheghost at yahoo period com

1 x Dhrystone 2 using register variables  1 2 3 4 5 6 7 8 9 10

1 x Double-Precision Whetstone  1 2 3 4 5 6 7 8 9 10

1 x Execl Throughput  1 2 3

1 x File Copy 1024 bufsize 2000 maxblocks  1 2 3

1 x File Copy 256 bufsize 500 maxblocks  1 2 3

1 x File Copy 4096 bufsize 8000 maxblocks  1 2 3

1 x Pipe Throughput  1 2 3 4 5 6 7 8 9 10

1 x Pipe-based Context Switching  1 2 3 4 5 6 7 8 9 10

1 x Process Creation  1 2 3

1 x System Call Overhead  1 2 3 4 5 6 7 8 9 10

1 x Shell Scripts (1 concurrent)  1 2 3

1 x Shell Scripts (8 concurrent)  1 2 3

4 x Dhrystone 2 using register variables  1 2 3 4 5 6 7 8 9 10

4 x Double-Precision Whetstone  1 2 3 4 5 6 7 8 9 10

4 x Execl Throughput  1 2 3

4 x File Copy 1024 bufsize 2000 maxblocks  1 2 3

4 x File Copy 256 bufsize 500 maxblocks  1 2 3

4 x File Copy 4096 bufsize 8000 maxblocks  1 2 3

4 x Pipe Throughput  1 2 3 4 5 6 7 8 9 10

4 x Pipe-based Context Switching  1 2 3 4 5 6 7 8 9 10

4 x Process Creation  1 2 3

4 x System Call Overhead  1 2 3 4 5 6 7 8 9 10

4 x Shell Scripts (1 concurrent)  1 2 3

4 x Shell Scripts (8 concurrent)  1 2 3

========================================================================
   BYTE UNIX Benchmarks (Version 5.1.3)

   System: xxxxx: GNU/Linux
   OS: GNU/Linux -- 2.6.32-042stab076.5 -- #1 SMP Mon Mar 18 20:41:34 MSK 2013
   Machine: i686 (unknown)
   Language: en_US.utf8 (charmap="ANSI_X3.4-1968", collate="ANSI_X3.4-1968")
   CPU 0: Intel(R) Xeon(R) CPU E5-2620 0 @ 2.00GHz (4000.2 bogomips)
          Hyper-Threading, x86-64, MMX, Physical Address Ext, SYSENTER/SYSEXIT, SYSCALL/SYSRET, Intel virtualization
   CPU 1: Intel(R) Xeon(R) CPU E5-2620 0 @ 2.00GHz (4000.2 bogomips)
          Hyper-Threading, x86-64, MMX, Physical Address Ext, SYSENTER/SYSEXIT, SYSCALL/SYSRET, Intel virtualization
   CPU 2: Intel(R) Xeon(R) CPU E5-2620 0 @ 2.00GHz (4000.2 bogomips)
          Hyper-Threading, x86-64, MMX, Physical Address Ext, SYSENTER/SYSEXIT, SYSCALL/SYSRET, Intel virtualization
   CPU 3: Intel(R) Xeon(R) CPU E5-2620 0 @ 2.00GHz (4000.2 bogomips)
          Hyper-Threading, x86-64, MMX, Physical Address Ext, SYSENTER/SYSEXIT, SYSCALL/SYSRET, Intel virtualization
   09:27:52 up  1:33,  1 user,  load average: 0.02, 0.15, 0.14; runlevel 2

------------------------------------------------------------------------
Benchmark Run: Tue Apr 30 2013 09:27:52 - 09:55:46
4 CPUs in system; running 1 parallel copy of tests

Dhrystone 2 using register variables       12247101.7 lps   (10.0 s, 7 samples)
Double-Precision Whetstone                     1971.5 MWIPS (10.2 s, 7 samples)
Execl Throughput                               2737.1 lps   (29.9 s, 2 samples)
File Copy 1024 bufsize 2000 maxblocks        347864.9 KBps  (30.0 s, 2 samples)
File Copy 256 bufsize 500 maxblocks           87970.4 KBps  (30.0 s, 2 samples)
File Copy 4096 bufsize 8000 maxblocks        906207.4 KBps  (30.0 s, 2 samples)
Pipe Throughput                              581550.8 lps   (10.0 s, 7 samples)
Pipe-based Context Switching                  75594.2 lps   (10.0 s, 7 samples)
Process Creation                               6329.5 lps   (30.0 s, 2 samples)
Shell Scripts (1 concurrent)                   4631.7 lpm   (60.0 s, 2 samples)
Shell Scripts (8 concurrent)                   1522.6 lpm   (60.0 s, 2 samples)
System Call Overhead                         490031.5 lps   (10.0 s, 7 samples)

System Benchmarks Index Values               BASELINE       RESULT    INDEX
Dhrystone 2 using register variables         116700.0   12247101.7   1049.5
Double-Precision Whetstone                       55.0       1971.5    358.5
Execl Throughput                                 43.0       2737.1    636.5
File Copy 1024 bufsize 2000 maxblocks          3960.0     347864.9    878.4
File Copy 256 bufsize 500 maxblocks            1655.0      87970.4    531.5
File Copy 4096 bufsize 8000 maxblocks          5800.0     906207.4   1562.4
Pipe Throughput                               12440.0     581550.8    467.5
Pipe-based Context Switching                   4000.0      75594.2    189.0
Process Creation                                126.0       6329.5    502.3
Shell Scripts (1 concurrent)                     42.4       4631.7   1092.4
Shell Scripts (8 concurrent)                      6.0       1522.6   2537.7
System Call Overhead                          15000.0     490031.5    326.7
                                                                   ========
System Benchmarks Index Score                                         661.5

------------------------------------------------------------------------
Benchmark Run: Tue Apr 30 2013 09:55:46 - 10:23:42
4 CPUs in system; running 4 parallel copies of tests

Dhrystone 2 using register variables       48134107.3 lps   (10.0 s, 7 samples)
Double-Precision Whetstone                     7867.7 MWIPS (10.2 s, 7 samples)
Execl Throughput                              11600.7 lps   (30.0 s, 2 samples)
File Copy 1024 bufsize 2000 maxblocks        374677.8 KBps  (30.0 s, 2 samples)
File Copy 256 bufsize 500 maxblocks          110787.7 KBps  (30.0 s, 2 samples)
File Copy 4096 bufsize 8000 maxblocks       1404832.2 KBps  (30.0 s, 2 samples)
Pipe Throughput                             2326082.1 lps   (10.0 s, 7 samples)
Pipe-based Context Switching                 496842.5 lps   (10.0 s, 7 samples)
Process Creation                              19697.0 lps   (30.0 s, 2 samples)
Shell Scripts (1 concurrent)                  13104.4 lpm   (60.0 s, 2 samples)
Shell Scripts (8 concurrent)                   1870.5 lpm   (60.0 s, 2 samples)
System Call Overhead                        1701363.5 lps   (10.0 s, 7 samples)

System Benchmarks Index Values               BASELINE       RESULT    INDEX
Dhrystone 2 using register variables         116700.0   48134107.3   4124.6
Double-Precision Whetstone                       55.0       7867.7   1430.5
Execl Throughput                                 43.0      11600.7   2697.8
File Copy 1024 bufsize 2000 maxblocks          3960.0     374677.8    946.2
File Copy 256 bufsize 500 maxblocks            1655.0     110787.7    669.4
File Copy 4096 bufsize 8000 maxblocks          5800.0    1404832.2   2422.1
Pipe Throughput                               12440.0    2326082.1   1869.8
Pipe-based Context Switching                   4000.0     496842.5   1242.1
Process Creation                                126.0      19697.0   1563.3
Shell Scripts (1 concurrent)                     42.4      13104.4   3090.7
Shell Scripts (8 concurrent)                      6.0       1870.5   3117.5
System Call Overhead                          15000.0    1701363.5   1134.2
                                                                   ========
System Benchmarks Index Score                                        1773.6
The score is close to 1800 points, which is pretty good. The second test showed even better score:
   #    #  #    #  #  #    #          #####   ######  #    #   ####   #    #
   #    #  ##   #  #   #  #           #    #  #       ##   #  #    #  #    #
   #    #  # #  #  #    ##            #####   #####   # #  #  #       ######
   #    #  #  # #  #    ##            #    #  #       #  # #  #       #    #
   #    #  #   ##  #   #  #           #    #  #       #   ##  #    #  #    #
    ####   #    #  #  #    #          #####   ######  #    #   ####   #    #

   Version 5.1.3                      Based on the Byte Magazine Unix Benchmark

   Multi-CPU version                  Version 5 revisions by Ian Smith,
                                      Sunnyvale, CA, USA
   January 13, 2011                   johantheghost at yahoo period com

1 x Dhrystone 2 using register variables  1 2 3 4 5 6 7 8 9 10

1 x Double-Precision Whetstone  1 2 3 4 5 6 7 8 9 10

1 x Execl Throughput  1 2 3

1 x File Copy 1024 bufsize 2000 maxblocks  1 2 3

1 x File Copy 256 bufsize 500 maxblocks  1 2 3

1 x File Copy 4096 bufsize 8000 maxblocks  1 2 3

1 x Pipe Throughput  1 2 3 4 5 6 7 8 9 10

1 x Pipe-based Context Switching  1 2 3 4 5 6 7 8 9 10

1 x Process Creation  1 2 3

1 x System Call Overhead  1 2 3 4 5 6 7 8 9 10

1 x Shell Scripts (1 concurrent)  1 2 3

1 x Shell Scripts (8 concurrent)  1 2 3

4 x Dhrystone 2 using register variables  1 2 3 4 5 6 7 8 9 10

4 x Double-Precision Whetstone  1 2 3 4 5 6 7 8 9 10

4 x Execl Throughput  1 2 3

4 x File Copy 1024 bufsize 2000 maxblocks  1 2 3

4 x File Copy 256 bufsize 500 maxblocks  1 2 3

4 x File Copy 4096 bufsize 8000 maxblocks  1 2 3

4 x Pipe Throughput  1 2 3 4 5 6 7 8 9 10

4 x Pipe-based Context Switching  1 2 3 4 5 6 7 8 9 10

4 x Process Creation  1 2 3

4 x System Call Overhead  1 2 3 4 5 6 7 8 9 10

4 x Shell Scripts (1 concurrent)  1 2 3

4 x Shell Scripts (8 concurrent)  1 2 3

========================================================================
   BYTE UNIX Benchmarks (Version 5.1.3)

   System: xxxxx: GNU/Linux
   OS: GNU/Linux -- 2.6.32-042stab076.5 -- #1 SMP Mon Mar 18 20:41:34 MSK 2013
   Machine: i686 (unknown)
   Language: en_US.utf8 (charmap="ANSI_X3.4-1968", collate="ANSI_X3.4-1968")
   CPU 0: Intel(R) Xeon(R) CPU E5-2620 0 @ 2.00GHz (4000.2 bogomips)
          Hyper-Threading, x86-64, MMX, Physical Address Ext, SYSENTER/SYSEXIT, SYSCALL/SYSRET, Intel virtualization
   CPU 1: Intel(R) Xeon(R) CPU E5-2620 0 @ 2.00GHz (4000.2 bogomips)
          Hyper-Threading, x86-64, MMX, Physical Address Ext, SYSENTER/SYSEXIT, SYSCALL/SYSRET, Intel virtualization
   CPU 2: Intel(R) Xeon(R) CPU E5-2620 0 @ 2.00GHz (4000.2 bogomips)
          Hyper-Threading, x86-64, MMX, Physical Address Ext, SYSENTER/SYSEXIT, SYSCALL/SYSRET, Intel virtualization
   CPU 3: Intel(R) Xeon(R) CPU E5-2620 0 @ 2.00GHz (4000.2 bogomips)
          Hyper-Threading, x86-64, MMX, Physical Address Ext, SYSENTER/SYSEXIT, SYSCALL/SYSRET, Intel virtualization
   12:32:50 up  4:38,  1 user,  load average: 0.07, 0.02, 0.00; runlevel 2

------------------------------------------------------------------------
Benchmark Run: Tue Apr 30 2013 12:32:50 - 13:00:43
4 CPUs in system; running 1 parallel copy of tests

Dhrystone 2 using register variables       12266757.5 lps   (10.0 s, 7 samples)
Double-Precision Whetstone                     1968.4 MWIPS (10.2 s, 7 samples)
Execl Throughput                               2709.3 lps   (30.0 s, 2 samples)
File Copy 1024 bufsize 2000 maxblocks        341615.6 KBps  (30.0 s, 2 samples)
File Copy 256 bufsize 500 maxblocks           88257.7 KBps  (30.0 s, 2 samples)
File Copy 4096 bufsize 8000 maxblocks        915587.2 KBps  (30.0 s, 2 samples)
Pipe Throughput                              593924.4 lps   (10.0 s, 7 samples)
Pipe-based Context Switching                  75985.6 lps   (10.0 s, 7 samples)
Process Creation                               6225.4 lps   (30.0 s, 2 samples)
Shell Scripts (1 concurrent)                   4615.5 lpm   (60.0 s, 2 samples)
Shell Scripts (8 concurrent)                   1514.2 lpm   (60.0 s, 2 samples)
System Call Overhead                         491161.8 lps   (10.0 s, 7 samples)

System Benchmarks Index Values               BASELINE       RESULT    INDEX
Dhrystone 2 using register variables         116700.0   12266757.5   1051.1
Double-Precision Whetstone                       55.0       1968.4    357.9
Execl Throughput                                 43.0       2709.3    630.1
File Copy 1024 bufsize 2000 maxblocks          3960.0     341615.6    862.7
File Copy 256 bufsize 500 maxblocks            1655.0      88257.7    533.3
File Copy 4096 bufsize 8000 maxblocks          5800.0     915587.2   1578.6
Pipe Throughput                               12440.0     593924.4    477.4
Pipe-based Context Switching                   4000.0      75985.6    190.0
Process Creation                                126.0       6225.4    494.1
Shell Scripts (1 concurrent)                     42.4       4615.5   1088.6
Shell Scripts (8 concurrent)                      6.0       1514.2   2523.7
System Call Overhead                          15000.0     491161.8    327.4
                                                                   ========
System Benchmarks Index Score                                         660.9

------------------------------------------------------------------------
Benchmark Run: Tue Apr 30 2013 13:00:43 - 13:28:39
4 CPUs in system; running 4 parallel copies of tests

Dhrystone 2 using register variables       48346539.8 lps   (10.0 s, 7 samples)
Double-Precision Whetstone                     7865.9 MWIPS (10.2 s, 7 samples)
Execl Throughput                              11595.5 lps   (29.9 s, 2 samples)
File Copy 1024 bufsize 2000 maxblocks        442884.3 KBps  (30.0 s, 2 samples)
File Copy 256 bufsize 500 maxblocks          115793.1 KBps  (30.0 s, 2 samples)
File Copy 4096 bufsize 8000 maxblocks       1360110.0 KBps  (30.0 s, 2 samples)
Pipe Throughput                             2263481.3 lps   (10.0 s, 7 samples)
Pipe-based Context Switching                 499975.5 lps   (10.0 s, 7 samples)
Process Creation                              19787.3 lps   (30.0 s, 2 samples)
Shell Scripts (1 concurrent)                  13178.8 lpm   (60.0 s, 2 samples)
Shell Scripts (8 concurrent)                   1866.6 lpm   (60.1 s, 2 samples)
System Call Overhead                        1665242.8 lps   (10.0 s, 7 samples)

System Benchmarks Index Values               BASELINE       RESULT    INDEX
Dhrystone 2 using register variables         116700.0   48346539.8   4142.8
Double-Precision Whetstone                       55.0       7865.9   1430.2
Execl Throughput                                 43.0      11595.5   2696.6
File Copy 1024 bufsize 2000 maxblocks          3960.0     442884.3   1118.4
File Copy 256 bufsize 500 maxblocks            1655.0     115793.1    699.7
File Copy 4096 bufsize 8000 maxblocks          5800.0    1360110.0   2345.0
Pipe Throughput                               12440.0    2263481.3   1819.5
Pipe-based Context Switching                   4000.0     499975.5   1249.9
Process Creation                                126.0      19787.3   1570.4
Shell Scripts (1 concurrent)                     42.4      13178.8   3108.2
Shell Scripts (8 concurrent)                      6.0       1866.6   3110.9
System Call Overhead                          15000.0    1665242.8   1110.2
                                                                   ========
System Benchmarks Index Score                                        1795.7
Geekbench score is somewhere close to 6000 points:
System Information
  Platform:                  Linux x86 (32-bit)
  Compiler:                  GCC 4.1.2 20070925 (Red Hat 4.1.2-33)
  Operating System:          Linux 2.6.32-042stab076.5 i686
  Model:                     Linux PC (Intel(R) Xeon(R) CPU E5-2620 0 @ 2.00GHz)
  Motherboard:               Unknown Motherboard
  Processor:                 Intel(R) Xeon(R) CPU E5-2620 0 @ 2.00GHz
  Processor ID:              GenuineIntel Family 6 Model 45 Stepping 7
  Logical Processors:        4
  Physical Processors:       1
  Processor Frequency:       2.00 GHz
  L1 Instruction Cache:      0.00 B
  L1 Data Cache:             0.00 B
  L2 Cache:                  256 KB
  L3 Cache:                  0.00 B
  Bus Frequency:             0.00 Hz
  Memory:                    2.00 GB
  Memory Type:               N/A
  SIMD:                      1
  BIOS:                      N/A
  Processor Model:                  Intel(R) Xeon(R) CPU E5-2620 0 @ 2.00GHz
  Processor Cores:           4

Integer
  Blowfish
    single-threaded scalar    1297 |||||
    multi-threaded scalar     5524 ||||||||||||||||||||||
  Text Compress
    single-threaded scalar    1741 ||||||
    multi-threaded scalar     6670 ||||||||||||||||||||||||||
  Text Decompress
    single-threaded scalar    1830 |||||||
    multi-threaded scalar     7626 ||||||||||||||||||||||||||||||
  Image Compress
    single-threaded scalar    1459 |||||
    multi-threaded scalar     5711 ||||||||||||||||||||||
  Image Decompress
    single-threaded scalar    1428 |||||
    multi-threaded scalar     5684 ||||||||||||||||||||||
  Lua
    single-threaded scalar    2456 |||||||||
    multi-threaded scalar     7868 |||||||||||||||||||||||||||||||

Floating Point
  Mandelbrot
    single-threaded scalar    1669 ||||||
    multi-threaded scalar     6768 |||||||||||||||||||||||||||
  Dot Product
    single-threaded scalar    2743 ||||||||||
    multi-threaded scalar    11554 ||||||||||||||||||||||||||||||||||||||||||||||
    single-threaded vector    3268 |||||||||||||
    multi-threaded vector    14946 |||||||||||||||||||||||||||||||||||||||||||||||||||||||||||
  LU Decomposition
    single-threaded scalar    1974 |||||||
    multi-threaded scalar     7883 |||||||||||||||||||||||||||||||
  Primality Test
    single-threaded scalar    2919 |||||||||||
    multi-threaded scalar     9214 ||||||||||||||||||||||||||||||||||||
  Sharpen Image
    single-threaded scalar    6632 ||||||||||||||||||||||||||
    multi-threaded scalar    25986 |||||||||||||||||||||||||||||||||||||||||||||||||||||||||||||||||||||||||||||||||||||||||||||||||||||||
  Blur Image
    single-threaded scalar    5232 ||||||||||||||||||||
    multi-threaded scalar    20920 |||||||||||||||||||||||||||||||||||||||||||||||||||||||||||||||||||||||||||||||||||

Memory
  Read Sequential
    single-threaded scalar    4411 |||||||||||||||||
  Write Sequential
    single-threaded scalar    8351 |||||||||||||||||||||||||||||||||
  Stdlib Allocate
    single-threaded scalar    3052 ||||||||||||
  Stdlib Write
    single-threaded scalar    2627 ||||||||||
  Stdlib Copy
    single-threaded scalar    5246 ||||||||||||||||||||

Stream
  Stream Copy
    single-threaded scalar    4480 |||||||||||||||||
    single-threaded vector    5432 |||||||||||||||||||||
  Stream Scale
    single-threaded scalar    4437 |||||||||||||||||
    single-threaded vector    5159 ||||||||||||||||||||
  Stream Add
    single-threaded scalar    5968 |||||||||||||||||||||||
    single-threaded vector    7617 ||||||||||||||||||||||||||||||
  Stream Triad
    single-threaded scalar    6435 |||||||||||||||||||||||||
    single-threaded vector    5884 |||||||||||||||||||||||

Integer Score:                4107 ||||||||||||||||
Floating Point Score:         8693 ||||||||||||||||||||||||||||||||||
Memory Score:                 4737 ||||||||||||||||||
Stream Score:                 5676 ||||||||||||||||||||||

Overall Geekbench Score:      5994 |||||||||||||||||||||||
Testing again showed approximately the same score, which means the results is pretty consistent.
System Information
  Platform:                  Linux x86 (32-bit)
  Compiler:                  GCC 4.1.2 20070925 (Red Hat 4.1.2-33)
  Operating System:          Linux 2.6.32-042stab076.5 i686
  Model:                     Linux PC (Intel(R) Xeon(R) CPU E5-2620 0 @ 2.00GHz)
  Motherboard:               Unknown Motherboard
  Processor:                 Intel(R) Xeon(R) CPU E5-2620 0 @ 2.00GHz
  Processor ID:              GenuineIntel Family 6 Model 45 Stepping 7
  Logical Processors:        4
  Physical Processors:       1
  Processor Frequency:       2.00 GHz
  L1 Instruction Cache:      0.00 B
  L1 Data Cache:             0.00 B
  L2 Cache:                  256 KB
  L3 Cache:                  0.00 B
  Bus Frequency:             0.00 Hz
  Memory:                    2.00 GB
  Memory Type:               N/A
  SIMD:                      1
  BIOS:                      N/A
  Processor Model:                  Intel(R) Xeon(R) CPU E5-2620 0 @ 2.00GHz
  Processor Cores:           4

Integer
  Blowfish
    single-threaded scalar    1295 |||||
    multi-threaded scalar     5557 ||||||||||||||||||||||
  Text Compress
    single-threaded scalar    1736 ||||||
    multi-threaded scalar     6734 ||||||||||||||||||||||||||
  Text Decompress
    single-threaded scalar    1846 |||||||
    multi-threaded scalar     7505 ||||||||||||||||||||||||||||||
  Image Compress
    single-threaded scalar    1469 |||||
    multi-threaded scalar     5550 ||||||||||||||||||||||
  Image Decompress
    single-threaded scalar    1411 |||||
    multi-threaded scalar     5631 ||||||||||||||||||||||
  Lua
    single-threaded scalar    2474 |||||||||
    multi-threaded scalar     7697 ||||||||||||||||||||||||||||||

Floating Point
  Mandelbrot
    single-threaded scalar    1670 ||||||
    multi-threaded scalar     6770 |||||||||||||||||||||||||||
  Dot Product
    single-threaded scalar    2736 ||||||||||
    multi-threaded scalar    11567 ||||||||||||||||||||||||||||||||||||||||||||||
    single-threaded vector    3271 |||||||||||||
    multi-threaded vector    14835 |||||||||||||||||||||||||||||||||||||||||||||||||||||||||||
  LU Decomposition
    single-threaded scalar    2022 ||||||||
    multi-threaded scalar     8065 ||||||||||||||||||||||||||||||||
  Primality Test
    single-threaded scalar    2918 |||||||||||
    multi-threaded scalar     9237 ||||||||||||||||||||||||||||||||||||
  Sharpen Image
    single-threaded scalar    6639 ||||||||||||||||||||||||||
    multi-threaded scalar    26048 ||||||||||||||||||||||||||||||||||||||||||||||||||||||||||||||||||||||||||||||||||||||||||||||||||||||||
  Blur Image
    single-threaded scalar    5202 ||||||||||||||||||||
    multi-threaded scalar    20867 |||||||||||||||||||||||||||||||||||||||||||||||||||||||||||||||||||||||||||||||||||

Memory
  Read Sequential
    single-threaded scalar    4585 ||||||||||||||||||
  Write Sequential
    single-threaded scalar    7979 |||||||||||||||||||||||||||||||
  Stdlib Allocate
    single-threaded scalar    3124 ||||||||||||
  Stdlib Write
    single-threaded scalar    2677 ||||||||||
  Stdlib Copy
    single-threaded scalar    5277 |||||||||||||||||||||

Stream
  Stream Copy
    single-threaded scalar    4837 |||||||||||||||||||
    single-threaded vector    8390 |||||||||||||||||||||||||||||||||
  Stream Scale
    single-threaded scalar    4991 |||||||||||||||||||
    single-threaded vector    8222 ||||||||||||||||||||||||||||||||
  Stream Add
    single-threaded scalar    6093 ||||||||||||||||||||||||
    single-threaded vector    9012 ||||||||||||||||||||||||||||||||||||
  Stream Triad
    single-threaded scalar    6895 |||||||||||||||||||||||||||
    single-threaded vector    5496 |||||||||||||||||||||

Integer Score:                4075 ||||||||||||||||
Floating Point Score:         8703 ||||||||||||||||||||||||||||||||||
Memory Score:                 4728 ||||||||||||||||||
Stream Score:                 6742 ||||||||||||||||||||||||||

Overall Geekbench Score:      6092 ||||||||||||||||||||||||
Overall the performance of this VPS is great, and both disk I/O and networking are pretty impressive.
Customer Service and Support
Some providers offers really solid VPS but probably the client care is a little lagging behind, others offer really good support but probably the service is less than satisfactory (I won’t name any here but I am sure everyone has a few names in mind). However when it comes to Catalyst Host, I am glad that they have both on the offer.
Unlike most of the cases that I have had, my first interaction with CatalystHost was actually initiated by Ryan himself, when he noticed that I didn’t pick up any OS immediately. The second ticket was sent in by me on some SolusVM issues. I sent the tickets 18:29, received the first response at 18:33 and none of the replies from their end took more than 10 minutes as Ryan was trying to do all the magic on his end.
If I have to pick the bone from the egg though, I would say the time they left their clients to respond to the tickets before closing them automatically was a bit too short at 12 hours. Of course I can see that people are normally eager to get issues resolved and won’t take more than 12 hours to send in a reply, and one can always re-open the tickets relatively easily. However sometimes it might take people more than 12 hours due to time differences and/or other commitments, I would say perhaps a 24 hour window would be nice.
Conclusion
I would not completely deny that I do have my reservations and doubts when jcaleb sent me his review, which is almost nothing less than very positive comments. However now that I became a customer of CatalystHost myself, I am truly impressed as well. It is rare for a VPS provider to offer good VPS with great disk I/O and yet very pro-active customer support, and yet managed to keep the price well-within the low end market. I certainly hope Ryan and his team would continue with the hard work and given time, I won’t be surprised if they become one of the top providers within this market.
I was skeptical too at first. I don’t believe in what they brag about quality and support. But having tried them anonymously, and being able to communicate with them changed my mind. They are still a small company, but I hope they do well.
Thanks for the review. I guess I was too busy during the move to Dallas to notice this one. Excellent write up and glad to see our track record remains in good standing since JCalebs review. I believe that the server your on is actually all HD Based with 8 500GB Enterprise drives in Raid 10. Keep watching, it is about time we post a promo. 🙂
This one slipped past me as well. Ryan and myself found ourselves quite occupied this summer and both had to work a little harder to maintain the quality we aim for. While I’ve left Catalyst due to my day job requiring a non compete, the company will always be important to me. I appreciate the balanced review and certainly notice there were some areas where we fell short. Ryan and Don are even more focused on excellence now than ever before, and I’m still very excited to be a bystander as two friends that I hold in the highest regard continue to perform at their best.