
96MB Low End VPS Review Part XXXIX – Kazila
Nate from Kazila, emailed me back in September asking me to review their services. And of course, as the same as my previous review, I have to really apologize for delaying things so much. So let’s take a look at how solid the VPS from them are.
Basic Information and Set Up
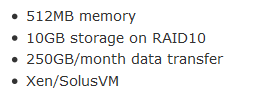
As per the advertisement on LowEndBox, here is what you get for 7USD/month, the cheapest of their Xen VPS packages.
As per LEB, three locations are offered at this time, Los Angeles CA with Quadranet, Dallas TX with NorthTXConnect (UPDATE: they are now with GIP networks as per Nate), New York City with Steadfast Networks.
The sign up page is a heavily themed WHMCS in HTTPS, however I am a little surprised that after all the customization work, the order page still started off by asking you for a domain name, which is not necessary in WHMCS system. However, on the page it was stated that the domain does not have to be active or registered, which means basically you can put whatever you want.

The next step basically shows you clearly what you are getting, which is something rare among many of the VPS providers although I think it would be a great feature. Yes, I understand we should know what we are buying before we start to purchase, but for someone who has a fat finger like mine and who does not bother to check the prices once a while, it is good to confirm on this page in black and white what I was about to get:

The same page also shows the billing cycle, apparently Kazila does does give any discount even for annual payment, so unless you are someone who is too lazy to log into Paypal once a month, there is really no incentive for you to pay one year upfront:

There are quite a few OS templates available during sign up, however for some reason most of them are 64 bit OS templates, the templates for Arch Linux 2010 and Ubuntu 10.04 does not have x64 after the name, so I assume they are the only 32 bit templates.
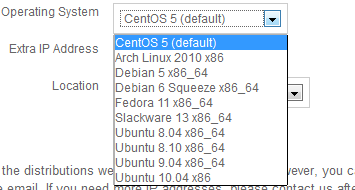
Each additional IP address cost 2 USD, which is more expensive than the 1USD per month “standard” price:

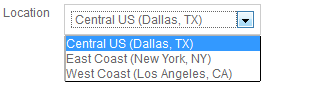
There are 3 locations for you to choose from when signing up, and the good news is they are pretty geographically dispersed in continental US, which would be great if you need a US server.
Provision was not instant and I received my VPS information email almost 1.5 hours after receiving the invoice payment email.
Compare with most of the other VPS providers, the provision email from Kazila is a lot shorter and contains just the exact information I need:

As you can see, the SolusVM control panel is using a non-standard HTTPS port.
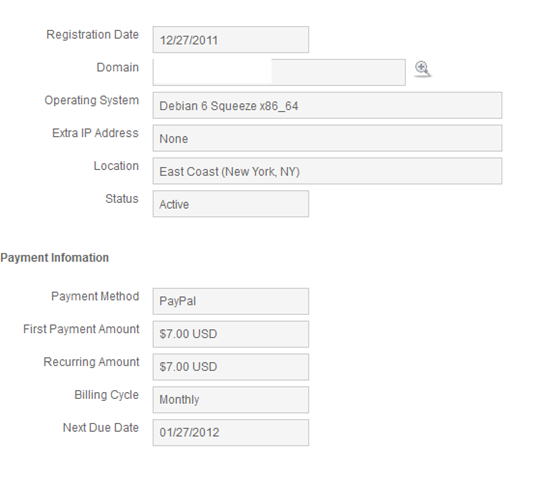
Unlike many of the VPS providers, the WHMCS interface does not provide any control of the VPS, under My Services, all you can see is strictly a description of the service:
However, there is a link to connect you to the SolusVM control panel, and after log in using the user name assigned (which I believe is manually generated based on the client’s name), you see a very standard VPS SolusVM control panel.
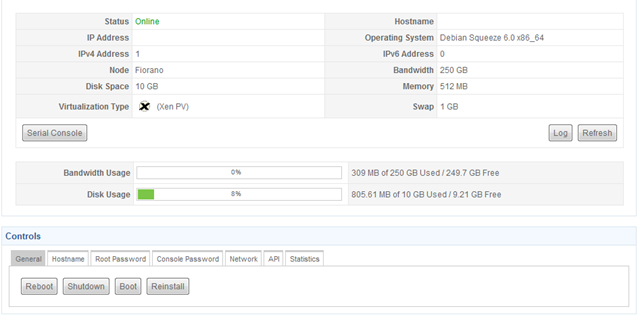
As usual, Central Backups is not available and there is no instant rDNS as well.

Also, it seems that the Root Password change does not work as well and you are always given the original root password that you have had in your VPS welcome email after the OS reinstallation.
There are quite a few OS templates available for installation, however the most impressive part is that they have a few templates that runs with PyGrub, which, if I remembered correctly, would enable you to run custom kernels:



Test on the VPS
As mentioned above, the VPS has 512MB of dedicated RAM (1024MB of swap space by default), 10GB of hard drive space and I have chosen the VPS in New York for testing purposes. Debian 6 64 bit was installed to perform the tests (except the GeekBench tests, where I had to run the 32 bit OS).
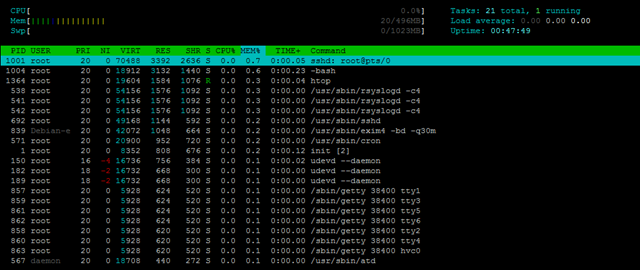
With a fresh OS installation, the VPS uses about 18MB of memory:
 free -m
             total       used       free     shared    buffers     cached
Mem:           496         70        425          0          3         48
-/+ buffers/cache:         18        477
Swap:         1023          0       1023
Also, the total memory amount is not exactly 512MB, the total memory amount indicated in the free outut is actually full 16MB less than the amount of memory given, which I can only assume they are being used by the OS, similar to many of the Xen systems that I have reviewed before. Correctly me if I am wrong, but I actually think memory-wise, it makes more sense to get an OpenVZ system, where the kernel is running completely outside of the amount of memory that you are assigned to, rather than running a Xen, although obviously there are less things you could do with OpenVZ, which is not a full virtulization system, such as implementation of kernel-based modules.
And a little more than 800MB of hard drive was used, which is slightly more than a Debian 6 installation using the OpenVZ templates.
 df -h
Filesystem            Size  Used Avail Use% Mounted on
/dev/xvda1            9.9G  806M  8.6G   9% /
tmpfs                 249M     0  249M   0% /lib/init/rw
udev                  235M   32K  235M   1% /dev
tmpfs                 249M  4.0K  249M   1% /dev/shm
iNodes is set to relatively high:
 df -i
Filesystem            Inodes   IUsed   IFree IUse% Mounted on
/dev/xvda1           1310720   24676 1286044    2% /
tmpfs                  63519       4   63515    1% /lib/init/rw
udev                   60122     396   59726    1% /dev
tmpfs                  63519       3   63516    1% /dev/shm
Top showing all the processes running by default:
top - 23:44:03 up 47 min,  1 user,  load average: 0.00, 0.00, 0.00
Tasks:  45 total,   1 running,  44 sleeping,   0 stopped,   0 zombie
Cpu(s):  0.0%us,  0.0%sy,  0.0%ni,100.0%id,  0.0%wa,  0.0%hi,  0.0%si,  0.0%st
Mem:    508156k total,    72528k used,   435628k free,     3196k buffers
Swap:  1048568k total,        0k used,  1048568k free,    50084k cached

  PID USER      PR  NI  VIRT  RES  SHR S %CPU %MEM    TIME+  COMMAND
 1001 root      20   0 70488 3392 2636 S  0.0  0.7   0:00.03 sshd
 1004 root      20   0 18912 3124 1432 S  0.0  0.6   0:00.21 bash
  538 root      20   0 54156 1576 1092 S  0.0  0.3   0:00.01 rsyslogd
 1024 root      20   0 18932 1264 1000 R  0.0  0.2   0:00.00 top
  692 root      20   0 49168 1144  592 S  0.0  0.2   0:00.00 sshd
  839 Debian-e  20   0 42072 1048  664 S  0.0  0.2   0:00.00 exim4
  571 root      20   0 20900  952  720 S  0.0  0.2   0:00.00 cron
    1 root      20   0  8352  808  676 S  0.0  0.2   0:00.12 init
  150 root      16  -4 16736  756  384 S  0.0  0.1   0:00.02 udevd
  182 root      18  -2 16732  668  300 S  0.0  0.1   0:00.00 udevd
  189 root      18  -2 16732  668  300 S  0.0  0.1   0:00.00 udevd
  857 root      20   0  5928  624  520 S  0.0  0.1   0:00.00 getty
  859 root      20   0  5928  624  520 S  0.0  0.1   0:00.00 getty
  861 root      20   0  5928  624  520 S  0.0  0.1   0:00.00 getty
  862 root      20   0  5928  624  520 S  0.0  0.1   0:00.00 getty
  858 root      20   0  5928  620  520 S  0.0  0.1   0:00.00 getty
  860 root      20   0  5928  620  520 S  0.0  0.1   0:00.00 getty
And as usual, the htop output for the htop fans:
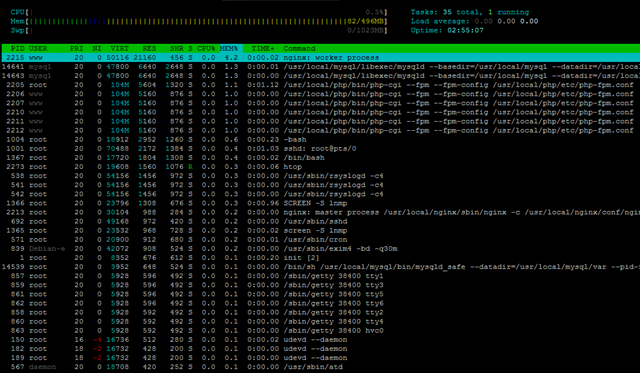
With the full LNMP stack installed, slightly more than 80MB of RAM was used:
free -m
             total       used       free     shared    buffers     cached
Mem:           496        488          7          0         20        386
-/+ buffers/cache:         81        414
Swap:         1023          0       1023
Top output showing all the processes running:
top - 09:59:25 up  2:54,  1 user,  load average: 0.00, 0.00, 0.00
Tasks:  58 total,   1 running,  57 sleeping,   0 stopped,   0 zombie
Cpu(s):  0.0%us,  0.0%sy,  0.0%ni,100.0%id,  0.0%wa,  0.0%hi,  0.0%si,  0.0%st
Mem:    508156k total,   501000k used,     7156k free,    21500k buffers
Swap:  1048568k total,      220k used,  1048348k free,   396068k cached

  PID USER      PR  NI  VIRT  RES  SHR S %CPU %MEM    TIME+  COMMAND
 2215 www       20   0 50116  20m  456 S  0.0  4.2   0:00.02 nginx
14641 mysql     20   0 47800 6640 2648 S  0.0  1.3   0:00.02 mysqld
 2205 root      20   0  104m 5604 1320 S  0.0  1.1   0:01.12 php-cgi
 2206 www       20   0  104m 5160  876 S  0.0  1.0   0:00.00 php-cgi
 2207 www       20   0  104m 5160  876 S  0.0  1.0   0:00.00 php-cgi
 2210 www       20   0  104m 5160  876 S  0.0  1.0   0:00.00 php-cgi
 2211 www       20   0  104m 5160  876 S  0.0  1.0   0:00.00 php-cgi
 2212 www       20   0  104m 5160  876 S  0.0  1.0   0:00.00 php-cgi
 1004 root      20   0 18912 2952 1260 S  0.0  0.6   0:00.23 bash
 1001 root      20   0 70488 2172 1384 S  0.0  0.4   0:01.35 sshd
 1367 root      20   0 17720 1804 1308 S  0.0  0.4   0:00.02 bash
  538 root      20   0 54156 1456  972 S  0.0  0.3   0:00.02 rsyslogd
 1366 root      20   0 23796 1308  676 S  0.0  0.3   0:01.12 screen
 2272 root      20   0 19040 1288 1004 R  1.1  0.3   0:00.01 top
 2213 root      20   0 30104  988  284 S  0.0  0.2   0:00.00 nginx
  692 root      20   0 49168  972  420 S  0.0  0.2   0:00.00 sshd
 1365 root      20   0 23532  968  728 S  0.0  0.2   0:00.02 screen
  571 root      20   0 20900  912  680 S  0.0  0.2   0:00.01 cron
  839 Debian-e  20   0 42072  908  524 S  0.0  0.2   0:00.00 exim4
    1 root      20   0  8352  676  612 S  0.0  0.1   0:00.20 init
14539 root      20   0  3952  648  524 S  0.0  0.1   0:00.00 mysqld_safe
  857 root      20   0  5928  596  492 S  0.0  0.1   0:00.00 getty
  859 root      20   0  5928  596  492 S  0.0  0.1   0:00.00 getty
  861 root      20   0  5928  596  492 S  0.0  0.1   0:00.00 getty
  862 root      20   0  5928  596  492 S  0.0  0.1   0:00.00 getty
  858 root      20   0  5928  592  492 S  0.0  0.1   0:00.00 getty
  860 root      20   0  5928  592  492 S  0.0  0.1   0:00.00 getty
  863 root      20   0  5928  592  492 S  0.0  0.1   0:00.00 getty
  150 root      16  -4 16736  512  280 S  0.0  0.1   0:00.02 udevd
  182 root      18  -2 16732  428  200 S  0.0  0.1   0:00.00 udevd
  189 root      18  -2 16732  428  200 S  0.0  0.1   0:00.00 udevd
  567 daemon    20   0 18708  420  252 S  0.0  0.1   0:00.00 atd
    2 root      20   0     0    0    0 S  0.0  0.0   0:00.00 kthreadd
    3 root      RT   0     0    0    0 S  0.0  0.0   0:00.00 migration/0
    4 root      20   0     0    0    0 S  0.0  0.0   0:00.31 ksoftirqd/0
    5 root      RT   0     0    0    0 S  0.0  0.0   0:00.00 watchdog/0
    6 root      20   0     0    0    0 S  0.0  0.0   0:00.37 events/0
    7 root      20   0     0    0    0 S  0.0  0.0   0:00.00 cpuset
    8 root      20   0     0    0    0 S  0.0  0.0   0:00.00 khelper
    9 root      20   0     0    0    0 S  0.0  0.0   0:00.00 netns
   10 root      20   0     0    0    0 S  0.0  0.0   0:00.00 async/mgr
   11 root      20   0     0    0    0 S  0.0  0.0   0:00.00 pm
   12 root      20   0     0    0    0 S  0.0  0.0   0:00.00 xenwatch
   13 root      20   0     0    0    0 S  0.0  0.0   0:00.00 xenbus
   14 root      20   0     0    0    0 S  0.0  0.0   0:00.01 sync_supers
And the htop output:
The box used 2.2GB of hard drive space to run the full LNMP stack:
df -h
Filesystem            Size  Used Avail Use% Mounted on
/dev/xvda1            9.9G  2.2G  7.3G  23% /
tmpfs                 249M     0  249M   0% /lib/init/rw
udev                  235M   32K  235M   1% /dev
tmpfs                 249M  4.0K  249M   1% /dev/shm
VMStat was taken right after I have run a UnixBench test, therefore the idle values is a bit high:
 vmstat
procs -----------memory---------- ---swap-- -----io---- -system-- ----cpu----
 r  b   swpd   free   buff  cache   si   so    bi    bo   in   cs us sy id wa
 0  0    220  21844  25428 366608    0    0    13   103   53  937  7  8 85  0
Similarly, the last 3 numbers of uptime output is pretty high as well:
uptime
 11:49:11 up  4:44,  1 user,  load average: 0.10, 1.66, 1.45
Running it today shows much better results:
vmstat
procs -----------memory---------- ---swap-- -----io---- -system-- ----cpu----
 r  b   swpd   free   buff  cache   si   so    bi    bo   in   cs us sy id wa
 0  0    220   6416  62376 372928    0    0     0     5    8   37  0  0 100  0
And the uptime output is similar:
uptime
 05:44:18 up 5 days, 22:39,  1 user,  load average: 0.00, 0.00, 0.00
CPUinfo shows there is one CPU core assigned to the VPS, and it is not throttled:
cat /proc/cpuinfo
processor       : 0
vendor_id       : GenuineIntel
cpu family      : 6
model           : 44
model name      : Intel(R) Xeon(R) CPU           E5620  @ 2.40GHz
stepping        : 2
cpu MHz         : 2393.998
cache size      : 12288 KB
fpu             : yes
fpu_exception   : yes
cpuid level     : 11
wp              : yes
flags           : fpu tsc msr pae cx8 cmov pat clflush mmx fxsr sse sse2 ss ht syscall nx lm constant_tsc up rep_good nonstop_tsc aperfmperf pni pclmulqdq vmx est ssse3 cx16 sse4_1 sse4_2 popcnt aes hypervisor lahf_lm ida arat tpr_shadow vnmi flexpriority ept vpid
bogomips        : 4787.99
clflush size    : 64
cache_alignment : 64
address sizes   : 40 bits physical, 48 bits virtual
power management:
And the meminfo output:
cat /proc/meminfo
MemTotal:         508156 kB
MemFree:           15704 kB
Buffers:            9960 kB
Cached:           414824 kB
SwapCached:          124 kB
Active:            53260 kB
Inactive:         408520 kB
Active(anon):      16756 kB
Inactive(anon):    20288 kB
Active(file):      36504 kB
Inactive(file):   388232 kB
Unevictable:           0 kB
Mlocked:               0 kB
SwapTotal:       1048568 kB
SwapFree:        1048348 kB
Dirty:                 0 kB
Writeback:             0 kB
AnonPages:         36876 kB
Mapped:             7072 kB
Shmem:                48 kB
Slab:              23544 kB
SReclaimable:      20316 kB
SUnreclaim:         3228 kB
KernelStack:         456 kB
PageTables:         2668 kB
NFS_Unstable:          0 kB
Bounce:                0 kB
WritebackTmp:          0 kB
CommitLimit:     1302644 kB
Committed_AS:     120148 kB
VmallocTotal:   34359738367 kB
VmallocUsed:        2108 kB
VmallocChunk:   34359736040 kB
HardwareCorrupted:     0 kB
HugePages_Total:       0
HugePages_Free:        0
HugePages_Rsvd:        0
HugePages_Surp:        0
Hugepagesize:       2048 kB
DirectMap4k:      524288 kB
DirectMap2M:           0 kB
As well as the time sync:
time sync

real    0m0.008s
user    0m0.004s
sys     0m0.004s
Disk I/O, in this case, is really impressive, I was able to get over 200MB/s on the DD test, which is almost the same as the throughput for some SSD drives:
dd if=/dev/zero of=test bs=64k count=16k conv=fdatasync
16384+0 records in
16384+0 records out
1073741824 bytes (1.1 GB) copied, 4.88499 s, 220 MB/s
Test again showed even better results:
dd if=/dev/zero of=test bs=64k count=16k conv=fdatasync
16384+0 records in
16384+0 records out
1073741824 bytes (1.1 GB) copied, 3.646 s, 294 MB/s
IOPing is actually very stable, which is another good news:
ioping -c 10 .
4096 bytes from . (ext3 /dev/xvda1): request=1 time=0.2 ms
4096 bytes from . (ext3 /dev/xvda1): request=2 time=0.2 ms
4096 bytes from . (ext3 /dev/xvda1): request=3 time=0.2 ms
4096 bytes from . (ext3 /dev/xvda1): request=4 time=0.2 ms
4096 bytes from . (ext3 /dev/xvda1): request=5 time=0.2 ms
4096 bytes from . (ext3 /dev/xvda1): request=6 time=0.2 ms
4096 bytes from . (ext3 /dev/xvda1): request=7 time=0.2 ms
4096 bytes from . (ext3 /dev/xvda1): request=8 time=0.3 ms
4096 bytes from . (ext3 /dev/xvda1): request=9 time=0.2 ms
4096 bytes from . (ext3 /dev/xvda1): request=10 time=0.2 ms

--- . (ext3 /dev/xvda1) ioping statistics ---
10 requests completed in 9003.4 ms, 5030 iops, 19.6 mb/s
min/avg/max/mdev = 0.2/0.2/0.3/0.0 ms
Test again showed similar output, which is something pretty impressive.
ioping -c 10 .
4096 bytes from . (ext3 /dev/xvda1): request=1 time=0.1 ms
4096 bytes from . (ext3 /dev/xvda1): request=2 time=0.2 ms
4096 bytes from . (ext3 /dev/xvda1): request=3 time=0.2 ms
4096 bytes from . (ext3 /dev/xvda1): request=4 time=0.2 ms
4096 bytes from . (ext3 /dev/xvda1): request=5 time=0.2 ms
4096 bytes from . (ext3 /dev/xvda1): request=6 time=0.2 ms
4096 bytes from . (ext3 /dev/xvda1): request=7 time=0.2 ms
4096 bytes from . (ext3 /dev/xvda1): request=8 time=0.2 ms
4096 bytes from . (ext3 /dev/xvda1): request=9 time=0.2 ms
4096 bytes from . (ext3 /dev/xvda1): request=10 time=0.1 ms

--- . (ext3 /dev/xvda1) ioping statistics ---
10 requests completed in 9003.3 ms, 5476 iops, 21.4 mb/s
min/avg/max/mdev = 0.1/0.2/0.2/0.0 ms
Network is pretty solid also, I was able to get about 11MB/s for the Cachefly download test.
wget cachefly.cachefly.net/100mb.test -O /dev/null
--2011-12-28 11:50:14--  http://cachefly.cachefly.net/100mb.test
Resolving cachefly.cachefly.net... 205.234.175.175
Connecting to cachefly.cachefly.net|205.234.175.175|:80... connected.
HTTP request sent, awaiting response... 200 OK
Length: 104857600 (100M) [application/octet-stream]
Saving to: `/dev/null'

100%[======================================>] 104,857,600 10.9M/s   in 9.1s

2011-12-28 11:50:24 (11.0 MB/s) - `/dev/null' saved [104857600/104857600]
Testing again showed very consistent results:
wget cachefly.cachefly.net/100mb.test -O /dev/null
--2012-01-03 08:53:38--  http://cachefly.cachefly.net/100mb.test
Resolving cachefly.cachefly.net... 205.234.175.175
Connecting to cachefly.cachefly.net|205.234.175.175|:80... connected.
HTTP request sent, awaiting response... 200 OK
Length: 104857600 (100M) [application/octet-stream]
Saving to: `/dev/null'

100%[======================================>] 104,857,600 11.0M/s   in 9.1s

2012-01-03 08:53:47 (11.0 MB/s) - `/dev/null' saved [104857600/104857600]
The upload speed from the server is pretty good as well, and best of all, it does not change a lot no matter where the actual location of my test VPS is:
First, the VPS from BuffloVPS in Chicago, IL, which, surprisingly, turned out to be the slowest although it is located along the east coast as well:
wget 69.162.169.246/100mb.test -O /dev/null
--2012-01-02 19:57:10--  http://69.162.169.246/100mb.test
Connecting to 69.162.169.246:80... connected.
HTTP request sent, awaiting response... 200 OK
Length: 104857600 (100M) [application/octet-stream]
Saving to: `/dev/null'

100%[======================================>] 104,857,600 9.62M/s   in 14s

2012-01-02 19:57:24 (7.38 MB/s) - `/dev/null' saved [104857600/104857600]
BuyVM VPS in San Jose, CA, was a little faster in this case:
wget 69.162.169.246/100mb.test -O /dev/null
--2012-01-02 19:58:03--  http://69.162.169.246/100mb.test
Connecting to 69.162.169.246:80... connected.
HTTP request sent, awaiting response... 200 OK
Length: 104857600 (100M) [application/octet-stream]
Saving to: `/dev/null'

100%[======================================>] 104,857,600 11.2M/s   in 10s

2012-01-02 19:58:14 (9.78 MB/s) - `/dev/null' saved [104857600/104857600]
And finally, my Quickweb VPS in London, UK:
wget 69.162.169.246/100mb.test -O /dev/null
--2012-01-02 20:02:32--  http://69.162.169.246/100mb.test
Connecting to 69.162.169.246:80... connected.
HTTP request sent, awaiting response... 200 OK
Length: 104857600 (100M) [application/octet-stream]
Saving to: `/dev/null'

100%[======================================>] 104,857,600 11.2M/s   in 9.6s

2012-01-02 20:02:42 (10.4 MB/s) - `/dev/null' saved [104857600/104857600]
The benchmark time, as for all my reviews, come the last in the tests. With only one CPU core available, unfortunately there is little dount that the benchmark score is not going to be really high:
   #    #  #    #  #  #    #          #####   ######  #    #   ####   #    #
   #    #  ##   #  #   #  #           #    #  #       ##   #  #    #  #    #
   #    #  # #  #  #    ##            #####   #####   # #  #  #       ######
   #    #  #  # #  #    ##            #    #  #       #  # #  #       #    #
   #    #  #   ##  #   #  #           #    #  #       #   ##  #    #  #    #
    ####   #    #  #  #    #          #####   ######  #    #   ####   #    #

   Version 5.1.3                      Based on the Byte Magazine Unix Benchmark

   Multi-CPU version                  Version 5 revisions by Ian Smith,
                                      Sunnyvale, CA, USA
   January 13, 2011                   johantheghost at yahoo period com

1 x Dhrystone 2 using register variables  1 2 3 4 5 6 7 8 9 10

1 x Double-Precision Whetstone  1 2 3 4 5 6 7 8 9 10

1 x Execl Throughput  1 2 3

1 x File Copy 1024 bufsize 2000 maxblocks  1 2 3

1 x File Copy 256 bufsize 500 maxblocks  1 2 3

1 x File Copy 4096 bufsize 8000 maxblocks  1 2 3

1 x Pipe Throughput  1 2 3 4 5 6 7 8 9 10

1 x Pipe-based Context Switching  1 2 3 4 5 6 7 8 9 10

1 x Process Creation  1 2 3

1 x System Call Overhead  1 2 3 4 5 6 7 8 9 10

1 x Shell Scripts (1 concurrent)  1 2 3

1 x Shell Scripts (8 concurrent)  1 2 3

========================================================================
   BYTE UNIX Benchmarks (Version 5.1.3)

   System: ********: GNU/Linux
   OS: GNU/Linux -- 2.6.32-5-amd64 -- #1 SMP Mon Oct 3 03:59:20 UTC 2011
   Machine: x86_64 (unknown)
   Language: en_US.utf8 (charmap="UTF-8", collate="UTF-8")
   CPU 0: Intel(R) Xeon(R) CPU E5620 @ 2.40GHz (4788.0 bogomips)
          Hyper-Threading, x86-64, MMX, Physical Address Ext, SYSCALL/SYSRET, Intel virtualization
   10:01:01 up  2:56,  1 user,  load average: 0.08, 0.02, 0.01; runlevel 2

------------------------------------------------------------------------
Benchmark Run: Wed Dec 28 2011 10:01:01 - 10:28:45
1 CPU in system; running 1 parallel copy of tests

Dhrystone 2 using register variables       17513291.8 lps   (10.0 s, 7 samples)
Double-Precision Whetstone                     2179.2 MWIPS (8.8 s, 7 samples)
Execl Throughput                               1250.5 lps   (30.0 s, 2 samples)
File Copy 1024 bufsize 2000 maxblocks        203106.6 KBps  (30.0 s, 2 samples)
File Copy 256 bufsize 500 maxblocks           55388.7 KBps  (30.0 s, 2 samples)
File Copy 4096 bufsize 8000 maxblocks        625563.5 KBps  (30.0 s, 2 samples)
Pipe Throughput                              327805.5 lps   (10.0 s, 7 samples)
Pipe-based Context Switching                  59234.7 lps   (10.0 s, 7 samples)
Process Creation                               2380.9 lps   (30.0 s, 2 samples)
Shell Scripts (1 concurrent)                   2537.4 lpm   (60.0 s, 2 samples)
Shell Scripts (8 concurrent)                    321.9 lpm   (60.2 s, 2 samples)
System Call Overhead                         362203.8 lps   (10.0 s, 7 samples)

System Benchmarks Index Values               BASELINE       RESULT    INDEX
Dhrystone 2 using register variables         116700.0   17513291.8   1500.7
Double-Precision Whetstone                       55.0       2179.2    396.2
Execl Throughput                                 43.0       1250.5    290.8
File Copy 1024 bufsize 2000 maxblocks          3960.0     203106.6    512.9
File Copy 256 bufsize 500 maxblocks            1655.0      55388.7    334.7
File Copy 4096 bufsize 8000 maxblocks          5800.0     625563.5   1078.6
Pipe Throughput                               12440.0     327805.5    263.5
Pipe-based Context Switching                   4000.0      59234.7    148.1
Process Creation                                126.0       2380.9    189.0
Shell Scripts (1 concurrent)                     42.4       2537.4    598.5
Shell Scripts (8 concurrent)                      6.0        321.9    536.5
System Call Overhead                          15000.0     362203.8    241.5
                                                                   ========
System Benchmarks Index Score                                         402.9
Test again showed almost the same results:
   #    #  #    #  #  #    #          #####   ######  #    #   ####   #    #
   #    #  ##   #  #   #  #           #    #  #       ##   #  #    #  #    #
   #    #  # #  #  #    ##            #####   #####   # #  #  #       ######
   #    #  #  # #  #    ##            #    #  #       #  # #  #       #    #
   #    #  #   ##  #   #  #           #    #  #       #   ##  #    #  #    #
    ####   #    #  #  #    #          #####   ######  #    #   ####   #    #

   Version 5.1.3                      Based on the Byte Magazine Unix Benchmark

   Multi-CPU version                  Version 5 revisions by Ian Smith,
                                      Sunnyvale, CA, USA
   January 13, 2011                   johantheghost at yahoo period com

1 x Dhrystone 2 using register variables  1 2 3 4 5 6 7 8 9 10

1 x Double-Precision Whetstone  1 2 3 4 5 6 7 8 9 10

1 x Execl Throughput  1 2 3

1 x File Copy 1024 bufsize 2000 maxblocks  1 2 3

1 x File Copy 256 bufsize 500 maxblocks  1 2 3

1 x File Copy 4096 bufsize 8000 maxblocks  1 2 3

1 x Pipe Throughput  1 2 3 4 5 6 7 8 9 10

1 x Pipe-based Context Switching  1 2 3 4 5 6 7 8 9 10

1 x Process Creation  1 2 3

1 x System Call Overhead  1 2 3 4 5 6 7 8 9 10

1 x Shell Scripts (1 concurrent)  1 2 3

1 x Shell Scripts (8 concurrent)  1 2 3

========================================================================
   BYTE UNIX Benchmarks (Version 5.1.3)

   System: *******: GNU/Linux
   OS: GNU/Linux -- 2.6.32-5-amd64 -- #1 SMP Mon Oct 3 03:59:20 UTC 2011
   Machine: x86_64 (unknown)
   Language: en_US.utf8 (charmap="UTF-8", collate="UTF-8")
   CPU 0: Intel(R) Xeon(R) CPU E5620 @ 2.40GHz (4788.0 bogomips)
          Hyper-Threading, x86-64, MMX, Physical Address Ext, SYSCALL/SYSRET, Intel virtualization
   11:17:18 up  4:12,  1 user,  load average: 0.00, 0.00, 0.05; runlevel 2

------------------------------------------------------------------------
Benchmark Run: Wed Dec 28 2011 11:17:18 - 11:45:00
1 CPU in system; running 1 parallel copy of tests

Dhrystone 2 using register variables       17130505.4 lps   (10.0 s, 7 samples)
Double-Precision Whetstone                     2342.4 MWIPS (8.4 s, 7 samples)
Execl Throughput                               1250.9 lps   (30.0 s, 2 samples)
File Copy 1024 bufsize 2000 maxblocks        209431.8 KBps  (30.0 s, 2 samples)
File Copy 256 bufsize 500 maxblocks           52894.0 KBps  (30.0 s, 2 samples)
File Copy 4096 bufsize 8000 maxblocks        609856.6 KBps  (30.0 s, 2 samples)
Pipe Throughput                              333491.7 lps   (10.0 s, 7 samples)
Pipe-based Context Switching                  67126.6 lps   (10.0 s, 7 samples)
Process Creation                               2365.8 lps   (30.0 s, 2 samples)
Shell Scripts (1 concurrent)                   2486.8 lpm   (60.0 s, 2 samples)
Shell Scripts (8 concurrent)                    323.8 lpm   (60.1 s, 2 samples)
System Call Overhead                         356025.6 lps   (10.0 s, 7 samples)

System Benchmarks Index Values               BASELINE       RESULT    INDEX
Dhrystone 2 using register variables         116700.0   17130505.4   1467.9
Double-Precision Whetstone                       55.0       2342.4    425.9
Execl Throughput                                 43.0       1250.9    290.9
File Copy 1024 bufsize 2000 maxblocks          3960.0     209431.8    528.9
File Copy 256 bufsize 500 maxblocks            1655.0      52894.0    319.6
File Copy 4096 bufsize 8000 maxblocks          5800.0     609856.6   1051.5
Pipe Throughput                               12440.0     333491.7    268.1
Pipe-based Context Switching                   4000.0      67126.6    167.8
Process Creation                                126.0       2365.8    187.8
Shell Scripts (1 concurrent)                     42.4       2486.8    586.5
Shell Scripts (8 concurrent)                      6.0        323.8    539.7
System Call Overhead                          15000.0     356025.6    237.4
                                                                   ========
System Benchmarks Index Score                                         406.8
GeekBench results was definitely a lot better:
System Information
  Platform:                  Linux x86 (32-bit)
  Compiler:                  GCC 4.1.2 20070925 (Red Hat 4.1.2-33)
  Operating System:          Linux 2.6.32-5-686-bigmem i686
  Model:                     Linux PC (Intel(R) Xeon(R) CPU           E5620  @ 2.40GHz)
  Motherboard:               Unknown Motherboard
  Processor:                 Intel(R) Xeon(R) CPU           E5620  @ 2.40GHz
  Processor ID:              GenuineIntel Family 6 Model 44 Stepping 2
  Logical Processors:        1
  Physical Processors:       1
  Processor Frequency:       2.39 GHz
  L1 Instruction Cache:      0.00 B
  L1 Data Cache:             0.00 B
  L2 Cache:                  256 KB
  L3 Cache:                  0.00 B
  Bus Frequency:             0.00 Hz
  Memory:                    501 MB
  Memory Type:               N/A
  SIMD:                      1
  BIOS:                      N/A
  Processor Model:           Intel(R) Xeon(R) CPU           E5620  @ 2.40GHz
  Processor Cores:           1

Integer
  Blowfish
    single-threaded scalar    1110 ||||
    multi-threaded scalar     1882 |||||||
  Text Compress
    single-threaded scalar    1275 |||||
    multi-threaded scalar     1439 |||||
  Text Decompress
    single-threaded scalar    1792 |||||||
    multi-threaded scalar     2104 ||||||||
  Image Compress
    single-threaded scalar    1676 ||||||
    multi-threaded scalar     1643 ||||||
  Image Decompress
    single-threaded scalar    1532 ||||||
    multi-threaded scalar     1574 ||||||
  Lua
    single-threaded scalar    2481 |||||||||
    multi-threaded scalar     3136 ||||||||||||

Floating Point
  Mandelbrot
    single-threaded scalar    2120 ||||||||
    multi-threaded scalar     2152 ||||||||
  Dot Product
    single-threaded scalar    3458 |||||||||||||
    multi-threaded scalar     3663 ||||||||||||||
    single-threaded vector    4105 ||||||||||||||||
    multi-threaded vector     4729 ||||||||||||||||||
  LU Decomposition
    single-threaded scalar    2414 |||||||||
    multi-threaded scalar     2454 |||||||||
  Primality Test
    single-threaded scalar    3010 ||||||||||||
    multi-threaded scalar     2779 |||||||||||
  Sharpen Image
    single-threaded scalar    5757 |||||||||||||||||||||||
    multi-threaded scalar     4889 |||||||||||||||||||
  Blur Image
    single-threaded scalar    5351 |||||||||||||||||||||
    multi-threaded scalar     5356 |||||||||||||||||||||

Memory
  Read Sequential
    single-threaded scalar    3331 |||||||||||||
  Write Sequential
    single-threaded scalar    6241 ||||||||||||||||||||||||
  Stdlib Allocate
    single-threaded scalar    3777 |||||||||||||||
  Stdlib Write
    single-threaded scalar    3507 ||||||||||||||
  Stdlib Copy
    single-threaded scalar    6981 |||||||||||||||||||||||||||

Stream
  Stream Copy
    single-threaded scalar    4011 ||||||||||||||||
    single-threaded vector    6606 ||||||||||||||||||||||||||
  Stream Scale
    single-threaded scalar    2921 |||||||||||
    single-threaded vector    6601 ||||||||||||||||||||||||||
  Stream Add
    single-threaded scalar    3312 |||||||||||||
    single-threaded vector    6354 |||||||||||||||||||||||||
  Stream Triad
    single-threaded scalar    3932 |||||||||||||||
    single-threaded vector    4668 ||||||||||||||||||

Integer Score:                1803 |||||||
Floating Point Score:         3731 ||||||||||||||
Memory Score:                 4767 |||||||||||||||||||
Stream Score:                 4800 |||||||||||||||||||

Overall Geekbench Score:      3370 |||||||||||||
Testing again gives consistent results:
System Information
  Platform:                  Linux x86 (32-bit)
  Compiler:                  GCC 4.1.2 20070925 (Red Hat 4.1.2-33)
  Operating System:          Linux 2.6.32-5-686-bigmem i686
  Model:                     Linux PC (Intel(R) Xeon(R) CPU           E5620  @ 2.40GHz)
  Motherboard:               Unknown Motherboard
  Processor:                 Intel(R) Xeon(R) CPU           E5620  @ 2.40GHz
  Processor ID:              GenuineIntel Family 6 Model 44 Stepping 2
  Logical Processors:        1
  Physical Processors:       1
  Processor Frequency:       2.39 GHz
  L1 Instruction Cache:      0.00 B
  L1 Data Cache:             0.00 B
  L2 Cache:                  256 KB
  L3 Cache:                  0.00 B
  Bus Frequency:             0.00 Hz
  Memory:                    501 MB
  Memory Type:               N/A
  SIMD:                      1
  BIOS:                      N/A
  Processor Model:           Intel(R) Xeon(R) CPU           E5620  @ 2.40GHz
  Processor Cores:           1

Integer
  Blowfish
    single-threaded scalar    1125 ||||
    multi-threaded scalar     1660 ||||||
  Text Compress
    single-threaded scalar    1996 |||||||
    multi-threaded scalar     1867 |||||||
  Text Decompress
    single-threaded scalar    1495 |||||
    multi-threaded scalar     1986 |||||||
  Image Compress
    single-threaded scalar    1216 ||||
    multi-threaded scalar     1646 ||||||
  Image Decompress
    single-threaded scalar    1532 ||||||
    multi-threaded scalar     1575 ||||||
  Lua
    single-threaded scalar    3136 ||||||||||||
    multi-threaded scalar     2676 ||||||||||

Floating Point
  Mandelbrot
    single-threaded scalar    1338 |||||
    multi-threaded scalar     2155 ||||||||
  Dot Product
    single-threaded scalar    3458 |||||||||||||
    multi-threaded scalar     3665 ||||||||||||||
    single-threaded vector    4116 ||||||||||||||||
    multi-threaded vector     4746 ||||||||||||||||||
  LU Decomposition
    single-threaded scalar    2416 |||||||||
    multi-threaded scalar     2462 |||||||||
  Primality Test
    single-threaded scalar    3483 |||||||||||||
    multi-threaded scalar     2792 |||||||||||
  Sharpen Image
    single-threaded scalar    3628 ||||||||||||||
    multi-threaded scalar     3665 ||||||||||||||
  Blur Image
    single-threaded scalar    3514 ||||||||||||||
    multi-threaded scalar     4884 |||||||||||||||||||

Memory
  Read Sequential
    single-threaded scalar    3282 |||||||||||||
  Write Sequential
    single-threaded scalar    5404 |||||||||||||||||||||
  Stdlib Allocate
    single-threaded scalar    2384 |||||||||
  Stdlib Write
    single-threaded scalar    2914 |||||||||||
  Stdlib Copy
    single-threaded scalar    5932 |||||||||||||||||||||||

Stream
  Stream Copy
    single-threaded scalar    3939 |||||||||||||||
    single-threaded vector    5635 ||||||||||||||||||||||
  Stream Scale
    single-threaded scalar    2891 |||||||||||
    single-threaded vector    6623 ||||||||||||||||||||||||||
  Stream Add
    single-threaded scalar    3568 ||||||||||||||
    single-threaded vector    6344 |||||||||||||||||||||||||
  Stream Triad
    single-threaded scalar    3493 |||||||||||||
    single-threaded vector    4013 ||||||||||||||||

Integer Score:                1825 |||||||
Floating Point Score:         3308 |||||||||||||
Memory Score:                 3983 |||||||||||||||
Stream Score:                 4563 ||||||||||||||||||

Overall Geekbench Score:      3049 ||||||||||||
Customer Service and Support
Nate seems to do a pretty good job in the customer support, my support ticket with him was answered in about 20 minutes and the response was pretty professional as well, which is something the providers fail to recognize. More often than not, I see responses that are misspelled, or just a plain “yes” or “no” type of one-word answer. I know this is low end VPS and perhaps the person who is sending the email is looking to response another 200 emails in the next hour. However, as an online business, how one present themselves online is actually pretty important. I have to say, from that aspect, Nate did a pretty good in presenting their company in a professional manner.
Conclusion
What Kazila has impressed me the most is not really the amount of the resources they have offered, nor the price tag that is attached to the VPS, but the stability of the VPS. More often than not, many VPS providers promises large amount of resources at an incredibly cheap price, only to make everything “burstable”, for one second I could get disk I/O in 3 digit range, the next second the DD test running on the same VPS would only give me low 30. However, at least during the short period of time that I was reviewing this VPS, the incident has not happened to me. Therefore, I have to say I am actually really pleased with the consistency of the performance of the VPS, together with the ample amount of options for the OS templates (including pyGrub templates), made it a budget choice for the performance-conscious VPS users.
Pingback: 96MB Low End VPS Review Part XXXX – DotVPS | | 96MB.com96MB.com