
96MB Low End VPS Review Part XXXIV – Up2VPS 2GB OpenVZ
Note: Apologies for the delay in publishing this review, this was supposedly to be published for last week, however, I hope you can forgive my delay considering that I have only slept for 5 hours altogether during the first three days of last week. There will be another review published in the next few hours for this week as well.
As far as I can remember, there were only three providers who have tried to offer the 2GB that were listed in LowEndBox.com – IPAP.co, eNetSouth and Up2VPS. IPAP has recently changed their company name, and the owner of eNetSouth, Brandon, has recently disappeared with his servers goes offline for weeks without any response (even before I get a chance to write a review for them). So how about the last survivor, Up2VPS? After they have decided to offer a $1 deal on LowEndTalk.com for people to “play with”, I decided to give them a try and see how things goes.
Basic Information and Set Up
As per the advertisement on LowEndTalk, here is what you get for $1:
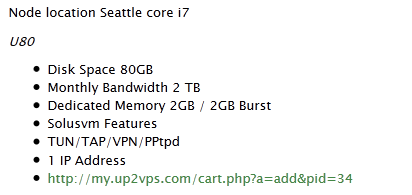
As you can see, the sign up page in on HTTP, but it will redirect you to HTTPS protocol automatically upon clicking the address.
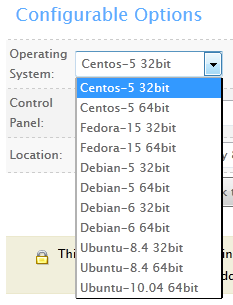
There are several options you can choose from while signing up. One of them is the OS distributions, which you can choose pretty much all the latest versions of major Linux OS distributions:
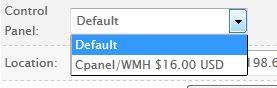
Only CPanel is available as the control panel and this option cost 16 USD per month, slightly higher than the cost you can obtain the VPS from CPanel directly.
For the location, obviously there is only Seattle that was listed.
There seems to be some issues with the checkout system that Up2VPS was using and I kept getting “unable to get authorization” errors when I was trying to pay using Paypal. Eventually, I had to use my credit card to pay for it and it finally went through.
Provision was instant and I was able to receive the VPS information the moment my account was paid. Root password was in plain text and the control panel is on HTTPS connection (redirected from the HTTP URL in the welcome email). It is also pretty interesting that Up2VPS offers a domain reseller program to those who wants to resell domain names:

Once log into the WHMCS system via HTTPS connection, the following control panel was displayed. As you can see, all graphs and percentage bars are there and the control options seems to work as well, I was able to reboot and change my root password on WHMCS without log into the SolusVM panel.
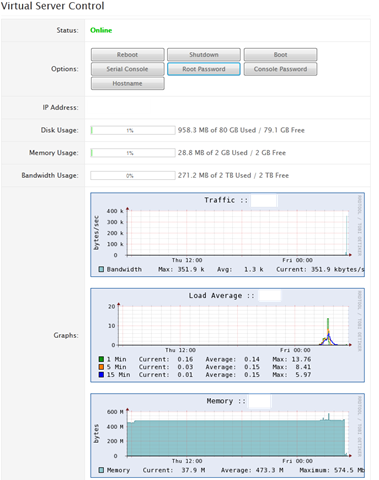
Logging into the SolusVM control panel using the user name assigned, you are able to see the standard new SolusVM control panel. As you can see, there is no IPV6 address assigned and there is no tab for backups as well.
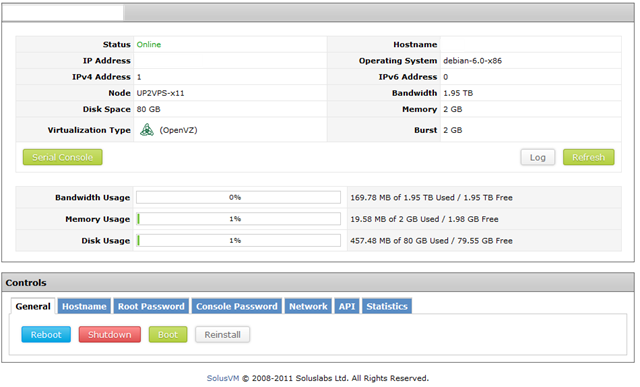
Instant rDNS is not available also, you will need to submit a ticket to get the rDNS changed:

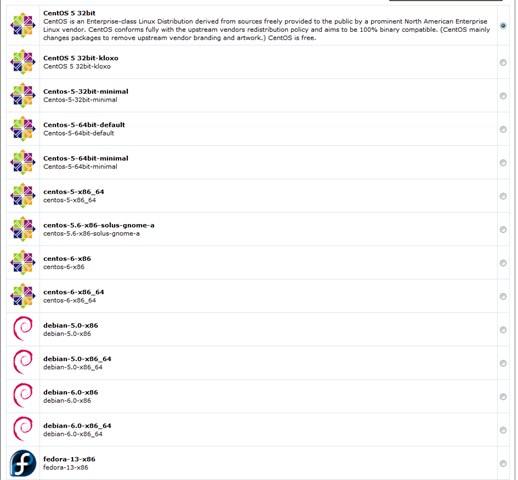
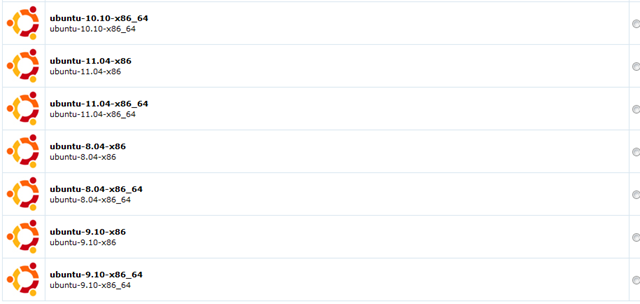
There are quite a lot of OS templates available though covering pretty much all the last few versions of the major Linux OS distributions, such as CentOS, Debian and Ubuntu. Interestingly, Scientific Linux seems to be a recent favourite among the LEB community and obviously Up2VPS has kept up with the trend and added two Scientific Linux templates as well:

Test on the VPS
As mentioned above, the VPS has 2GB of dedicated RAM, (although it seems to me there should be another 2GB of burstable RAM, but it does not seems to be there as far as I can see) and 80GB of hard drive space, it is in the ??? data centre in Seattle, WA and I have installed Debian 6, 32 bit OS template for testing purposes:
 uname -a
Linux **** 2.6.32-274.3.1.el5.028stab094.3 #1 SMP Thu Sep 22 13:24:07 MSD 2011 i686 GNU/Linux
When the OS template was loaded, 16MB of RAM was used:
 free -m
             total       used       free     shared    buffers     cached
Mem:          2048         16       2031          0          0          0
-/+ buffers/cache:         16       2031
Swap:            0          0          0
And the top output showing the processes running:
top - 21:36:00 up 9 min,  1 user,  load average: 0.00, 0.00, 0.00
Tasks:  16 total,   2 running,  14 sleeping,   0 stopped,   0 zombie
Cpu(s):  1.1%us,  0.0%sy,  0.0%ni, 98.9%id,  0.0%wa,  0.0%hi,  0.0%si,  0.0%st
Mem:   2097152k total,    20036k used,  2077116k free,        0k buffers
Swap:        0k total,        0k used,        0k free,        0k cached

  PID USER      PR  NI  VIRT  RES  SHR S %CPU %MEM    TIME+  COMMAND
 1642 root      16   0  8672 3024 2468 R    0  0.1   0:00.06 sshd
 1842 root      19   0  7324 2752 2228 S    5  0.1   0:00.05 sshd
 1410 root      18   0  5132 2428 1180 S    0  0.1   0:00.00 apache2
 1411 www-data  25   0  5132 1840  584 S    0  0.1   0:00.00 apache2
 1666 root      15   0  2956 1620 1292 S    0  0.1   0:00.00 bash
 1607 root      15   0  9992 1548  500 S    0  0.1   0:00.00 sendmail-mta
 1844 sshd      15   0  6828 1188  728 S    0  0.1   0:00.00 sshd
 1843 root      15   0  2324 1064  872 R    0  0.1   0:00.00 top
 1622 root      15   0  5484  964  576 S    0  0.0   0:00.00 sshd
 1432 root      18   0  2284  844  660 S    0  0.0   0:00.00 cron
 1581 root      25   0  2388  832  668 S    0  0.0   0:00.00 xinetd
 1381 root      18   0  8664  792  448 S    0  0.0   0:00.00 saslauthd
 1400 root      18   0  1888  776  648 S    0  0.0   0:00.00 anacron
    1 root      18   0  2024  676  584 S    0  0.0   0:00.03 init
 1396 root      15   0  1732  632  504 S    0  0.0   0:00.00 syslogd
 1382 root      18   0  8664  508  164 S    0  0.0   0:00.00 saslauthd
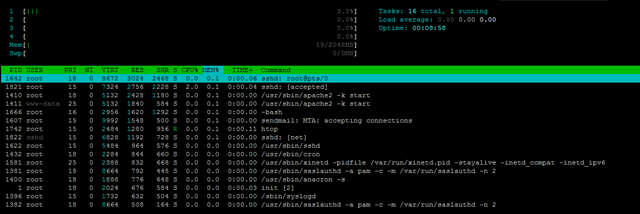
And of course, htop output for the htop fans:
Slightly more than 400MB of hard drive space was used, which is pretty standard:
df -h
Filesystem            Size  Used Avail Use% Mounted on
/dev/simfs             80G  413M   80G   1% /
tmpfs                 1.0G     0  1.0G   0% /lib/init/rw
tmpfs                 1.0G     0  1.0G   0% /dev/shm
The inode was set to pretty high values:
df -i
Filesystem            Inodes   IUsed   IFree IUse% Mounted on
/dev/simfs           41943040   26125 41916915    1% /
tmpfs                 262144       4  262140    1% /lib/init/rw
tmpfs                 262144       1  262143    1% /dev/shm
When the full LNMP stack was installed, 64MB of RAM was used:
free -m
             total       used       free     shared    buffers     cached
Mem:          2048         64       1983          0          0          0
-/+ buffers/cache:         64       1983
Swap:            0          0          0
And the top output showing the full LNMP stack running:
top - 02:16:12 up 49 min,  1 user,  load average: 0.00, 0.03, 0.24
Tasks:  21 total,   1 running,  20 sleeping,   0 stopped,   0 zombie
Cpu(s):  0.0%us,  0.0%sy,  0.0%ni,100.0%id,  0.0%wa,  0.0%hi,  0.0%si,  0.0%st
Mem:   2097152k total,    63896k used,  2033256k free,        0k buffers
Swap:        0k total,        0k used,        0k free,        0k cached

  PID USER      PR  NI  VIRT  RES  SHR S %CPU %MEM    TIME+  COMMAND
28197 www       15   0 14496  10m  724 S    0  0.5   0:00.22 nginx
16042 mysql     19   0 34792 5832 3152 S    0  0.3   0:00.00 mysqld
28174 root      18   0 22700 4532 1380 S    0  0.2   0:00.00 php-cgi
28176 www       22   0 22700 4152 1000 S    0  0.2   0:00.00 php-cgi
28179 www       22   0 22700 4152 1000 S    0  0.2   0:00.00 php-cgi
28181 www       22   0 22700 4152 1000 S    0  0.2   0:00.00 php-cgi
28182 www       22   0 22700 4152 1000 S    0  0.2   0:00.00 php-cgi
28185 www       25   0 22700 4152 1000 S    0  0.2   0:00.00 php-cgi
 1642 root      18   0  8672 3036 2468 S    0  0.1   0:01.22 sshd
 1666 root      15   0  2956 1652 1324 S    0  0.1   0:00.00 bash
 1607 root      15   0  9992 1548  500 S    0  0.1   0:00.04 sendmail-mta
15939 root      18   0  2680 1212 1000 S    0  0.1   0:00.00 mysqld_safe
28293 root      15   0  2324 1076  876 R    0  0.1   0:00.00 top
 1622 root      15   0  5484  964  576 S    0  0.0   0:00.01 sshd
 1432 root      15   0  2284  848  664 S    0  0.0   0:00.00 cron
 1581 root      25   0  2388  832  668 S    0  0.0   0:00.00 xinetd
 1381 root      18   0  8664  792  448 S    0  0.0   0:00.00 saslauthd
And of course, the htop output as well:
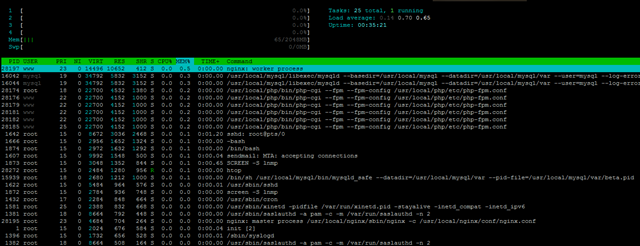
About 1.7GB of hard drive space was taken away:
df -h
Filesystem            Size  Used Avail Use% Mounted on
/dev/simfs             80G  1.7G   79G   3% /
tmpfs                 1.0G     0  1.0G   0% /lib/init/rw
tmpfs                 1.0G     0  1.0G   0% /dev/shm
And the Inodes, as I have mentioned before, is set to pretty high values.
 df -i
Filesystem            Inodes   IUsed   IFree IUse% Mounted on
/dev/simfs           41943040   69556 41873484    1% /
tmpfs                 262144       4  262140    1% /lib/init/rw
tmpfs                 262144       1  262143    1% /dev/shm
Vmstat was run right after the LNMP installation, so the usage was a bit higher than usual:
vmstat
procs -----------memory---------- ---swap-- -----io---- -system-- ----cpu----
 r  b   swpd   free   buff  cache   si   so    bi    bo   in   cs us sy id wa
 2  0      0 2030932      0      0    0    0     8   230    0 1767 11  2 87  0
So was the output for uptime:
uptime
 02:05:26 up 39 min,  1 user,  load average: 0.00, 0.33, 0.51
The beacounters are set to some pretty interesting values:
 cat /proc/user_beancounters
Version: 2.5
       uid  resource                     held              maxheld              barrier                limit              failcnt
      486:  kmemsize                  3113858             19944497           2147483646           2147483646                    0
            lockedpages                     0                  448               999999               999999                    0
            privvmpages                 16452               173030               524288               524288                    0
            shmpages                      642                 3232               524288               524288                    0
            dummy                           0                    0                    0                    0                    0
            numproc                        25                  122               999999               999999                    0
            physpages                    7527                37514                    0           2147483647                    0
            vmguarpages                     0                    0               524288           2147483647                    0
            oomguarpages                 7527                37514               524288           2147483647                    0
            numtcpsock                      7                   17              7999992              7999992                    0
            numflock                        4                   10               999999               999999                    0
            numpty                          2                    3               500000               500000                    0
            numsiginfo                      0                    9               999999               999999                    0
            tcpsndbuf                  221128               363768            214748160            396774400                    0
            tcprcvbuf                  114688              2910952            214748160            396774400                    0
            othersockbuf                11640                38408            214748160            396774400                    0
            dgramrcvbuf                     0                 8472            214748160            396774400                    0
            numothersock                   14                   22              7999992              7999992                    0
            dcachesize                      0                    0           2147483646           2147483646                    0
            numfile                       568                 2260             23999976             23999976                    0
            dummy                           0                    0                    0                    0                    0
            dummy                           0                    0                    0                    0                    0
            dummy                           0                    0                    0                    0                    0
            numiptent                      24                   24               999999               999999                    0
However I do not seems to see any sign of overselling judging from the output of vzfree:
vzfree
             Total     Used     Free
Kernel:   2048.00M    2.73M 2045.27M
Allocate: 2048.00M   62.40M 1985.60M (2048M Guaranteed)
Commit:   2048.00M   30.97M 2017.03M (45.3% of Allocated)
Swap:                 0.00M          (0.0% of Committed)
There are four processor cores assigned to the VPS, however they seems to be all throttled to 1GHz:
cat /proc/cpuinfo
processor       : 0
vendor_id       : GenuineIntel
cpu family      : 6
model           : 26
model name      : Intel(R) Core(TM) i7 CPU         920  @ 2.67GHz
stepping        : 5
cpu MHz         : 1000.068
cache size      : 8192 KB
physical id     : 0
siblings        : 8
core id         : 0
cpu cores       : 4
apicid          : 0
fpu             : yes
fpu_exception   : yes
cpuid level     : 11
wp              : yes
flags           : fpu vme de pse tsc msr pae mce cx8 apic sep mtrr pge mca cmov pat pse36 clflush dts acpi mmx fxsr sse sse2 ss ht tm syscall rdtscp lm constant_tsc nonstop_tsc pni monitor ds_cpl vmx est tm2 ssse3 cx16 xtpr sse4_1 sse4_2 popcnt lahf_lm
bogomips        : 5333.70
clflush size    : 64
cache_alignment : 64
address sizes   : 36 bits physical, 48 bits virtual
power management: [8]

processor       : 1
vendor_id       : GenuineIntel
cpu family      : 6
model           : 26
model name      : Intel(R) Core(TM) i7 CPU         920  @ 2.67GHz
stepping        : 5
cpu MHz         : 1000.068
cache size      : 8192 KB
physical id     : 0
siblings        : 8
core id         : 1
cpu cores       : 4
apicid          : 2
fpu             : yes
fpu_exception   : yes
cpuid level     : 11
wp              : yes
flags           : fpu vme de pse tsc msr pae mce cx8 apic sep mtrr pge mca cmov pat pse36 clflush dts acpi mmx fxsr sse sse2 ss ht tm syscall rdtscp lm constant_tsc nonstop_tsc pni monitor ds_cpl vmx est tm2 ssse3 cx16 xtpr sse4_1 sse4_2 popcnt lahf_lm
bogomips        : 5333.45
clflush size    : 64
cache_alignment : 64
address sizes   : 36 bits physical, 48 bits virtual
power management: [8]

processor       : 2
vendor_id       : GenuineIntel
cpu family      : 6
model           : 26
model name      : Intel(R) Core(TM) i7 CPU         920  @ 2.67GHz
stepping        : 5
cpu MHz         : 1000.068
cache size      : 8192 KB
physical id     : 0
siblings        : 8
core id         : 2
cpu cores       : 4
apicid          : 4
fpu             : yes
fpu_exception   : yes
cpuid level     : 11
wp              : yes
flags           : fpu vme de pse tsc msr pae mce cx8 apic sep mtrr pge mca cmov pat pse36 clflush dts acpi mmx fxsr sse sse2 ss ht tm syscall rdtscp lm constant_tsc nonstop_tsc pni monitor ds_cpl vmx est tm2 ssse3 cx16 xtpr sse4_1 sse4_2 popcnt lahf_lm
bogomips        : 5333.47
clflush size    : 64
cache_alignment : 64
address sizes   : 36 bits physical, 48 bits virtual
power management: [8]

processor       : 3
vendor_id       : GenuineIntel
cpu family      : 6
model           : 26
model name      : Intel(R) Core(TM) i7 CPU         920  @ 2.67GHz
stepping        : 5
cpu MHz         : 1000.068
cache size      : 8192 KB
physical id     : 0
siblings        : 8
core id         : 3
cpu cores       : 4
apicid          : 6
fpu             : yes
fpu_exception   : yes
cpuid level     : 11
wp              : yes
flags           : fpu vme de pse tsc msr pae mce cx8 apic sep mtrr pge mca cmov pat pse36 clflush dts acpi mmx fxsr sse sse2 ss ht tm syscall rdtscp lm constant_tsc nonstop_tsc pni monitor ds_cpl vmx est tm2 ssse3 cx16 xtpr sse4_1 sse4_2 popcnt lahf_lm
bogomips        : 5333.48
clflush size    : 64
cache_alignment : 64
address sizes   : 36 bits physical, 48 bits virtual
power management: [8]
As of most of the OpenVZ plans, the meminfo output has a lot of zeros:
 cat /proc/meminfo
MemTotal:      2097152 kB
MemFree:       2033268 kB
Buffers:             0 kB
Cached:              0 kB
SwapCached:          0 kB
Active:              0 kB
Inactive:            0 kB
HighTotal:           0 kB
HighFree:            0 kB
LowTotal:      2097152 kB
LowFree:       2033268 kB
SwapTotal:           0 kB
SwapFree:            0 kB
Dirty:           98540 kB
Writeback:           0 kB
AnonPages:           0 kB
Mapped:              0 kB
Slab:                0 kB
PageTables:          0 kB
NFS_Unstable:        0 kB
Bounce:              0 kB
CommitLimit:         0 kB
Committed_AS:        0 kB
VmallocTotal:        0 kB
VmallocUsed:         0 kB
VmallocChunk:        0 kB
HugePages_Total:     0
HugePages_Free:      0
HugePages_Rsvd:      0
Hugepagesize:     2048 kB
And here is the output of time sync:
time sync

real    0m0.021s
user    0m0.000s
sys     0m0.021s
Although the issue with the node seems to be with the disk I/O, when I was testing it at least, the disk I/O seems to be pretty good:
 dd if=/dev/zero of=test bs=64k count=16k conv=fdatasync
16384+0 records in
16384+0 records out
1073741824 bytes (1.1 GB) copied, 10.0014 s, 107 MB/s
Testing again actually give me even better results:
dd if=/dev/zero of=test bs=64k count=16k conv=fdatasync
16384+0 records in
16384+0 records out
1073741824 bytes (1.1 GB) copied, 9.51405 s, 113 MB/s
IOping is actually not that stable though, which is interesting:
 ioping -c 10 .
4096 bytes from . (simfs /dev/simfs): request=1 time=0.5 ms
4096 bytes from . (simfs /dev/simfs): request=2 time=0.1 ms
4096 bytes from . (simfs /dev/simfs): request=3 time=3.0 ms
4096 bytes from . (simfs /dev/simfs): request=4 time=15.7 ms
4096 bytes from . (simfs /dev/simfs): request=5 time=0.1 ms
4096 bytes from . (simfs /dev/simfs): request=6 time=0.1 ms
4096 bytes from . (simfs /dev/simfs): request=7 time=0.2 ms
4096 bytes from . (simfs /dev/simfs): request=8 time=2.2 ms
4096 bytes from . (simfs /dev/simfs): request=9 time=0.2 ms
4096 bytes from . (simfs /dev/simfs): request=10 time=2.2 ms

--- . (simfs /dev/simfs) ioping statistics ---
10 requests completed in 9034.3 ms, 410 iops, 1.6 mb/s
min/avg/max/mdev = 0.1/2.4/15.7/4.6 ms
The second time seems to be a lot better though:
ioping -c 10 .
4096 bytes from . (simfs /dev/simfs): request=1 time=0.2 ms
4096 bytes from . (simfs /dev/simfs): request=2 time=0.1 ms
4096 bytes from . (simfs /dev/simfs): request=3 time=0.2 ms
4096 bytes from . (simfs /dev/simfs): request=4 time=3.3 ms
4096 bytes from . (simfs /dev/simfs): request=5 time=0.1 ms
4096 bytes from . (simfs /dev/simfs): request=6 time=0.2 ms
4096 bytes from . (simfs /dev/simfs): request=7 time=0.2 ms
4096 bytes from . (simfs /dev/simfs): request=8 time=0.1 ms
4096 bytes from . (simfs /dev/simfs): request=9 time=0.1 ms
4096 bytes from . (simfs /dev/simfs): request=10 time=0.1 ms

--- . (simfs /dev/simfs) ioping statistics ---
10 requests completed in 9013.9 ms, 2166 iops, 8.5 mb/s
min/avg/max/mdev = 0.1/0.5/3.3/0.9 ms
The network is pretty decent as well, I was able to get a good speed in the Cachefly test:
wget cachefly.cachefly.net/100mb.test -O /dev/null
--2011-10-28 02:07:07--  http://cachefly.cachefly.net/100mb.test
Resolving cachefly.cachefly.net... 205.234.175.175
Connecting to cachefly.cachefly.net|205.234.175.175|:80... connected.
HTTP request sent, awaiting response... 200 OK
Length: 104857600 (100M) [application/octet-stream]
Saving to: `/dev/null'

100%[======================================>] 104,857,600 11.2M/s   in 9.4s

2011-10-28 02:07:16 (10.6 MB/s) - `/dev/null' saved [104857600/104857600]
Testing again actually give me the same results, which I was pretty amazed:
 wget cachefly.cachefly.net/100mb.test -O /dev/null
--2011-10-28 02:16:48--  http://cachefly.cachefly.net/100mb.test
Resolving cachefly.cachefly.net... 205.234.175.175
Connecting to cachefly.cachefly.net|205.234.175.175|:80... connected.
HTTP request sent, awaiting response... 200 OK
Length: 104857600 (100M) [application/octet-stream]
Saving to: `/dev/null'

100%[======================================>] 104,857,600 11.2M/s   in 9.5s

2011-10-28 02:16:58 (10.5 MB/s) - `/dev/null' saved [104857600/104857600]
The upload speed is pretty decent as well, with the fastest upload speed using my testing VPS from BuffaloVPS:
wget -O /dev/null 76.191.104.101/100mb.test
--2011-10-27 21:57:09--  http://76.191.104.101/100mb.test
Connecting to 76.191.104.101:80... connected.
HTTP request sent, awaiting response... 200 OK
Length: 104857600 (100M) [application/octet-stream]
Saving to: `/dev/null'

100%[======================================>] 104,857,600 9.45M/s   in 11s

2011-10-27 21:57:20 (8.84 MB/s) - `/dev/null' saved [104857600/104857600]
For the BuyVM VPS, although I was expecting the upload speed to be the fastest since they are both along the west coast, it is actually pretty slow:
wget -O /dev/null 76.191.104.101/100mb.test
--2011-10-27 22:00:58--  http://76.191.104.101/100mb.test
Connecting to 76.191.104.101:80... connected.
HTTP request sent, awaiting response... 200 OK
Length: 104857600 (100M) [application/octet-stream]
Saving to: `/dev/null'

100%[======================================>] 104,857,600 3.16M/s   in 17s

2011-10-27 22:01:15 (5.85 MB/s) - `/dev/null' saved [104857600/104857600]
And the upload speed from Quickweb is almost as same as my BuyVM VPS:
wget -O /dev/null 76.191.104.101/100mb.test
--2011-10-27 22:02:07--  http://76.191.104.101/100mb.test
Connecting to 76.191.104.101:80... connected.
HTTP request sent, awaiting response... 200 OK
Length: 104857600 (100M) [application/octet-stream]
Saving to: `/dev/null'

100%[======================================>] 104,857,600 8.11M/s   in 17s
2011-10-27 22:02:25 (5.88 MB/s) - `/dev/null' saved [104857600/104857600]
Finally the Benchmark time. Unixbench results is actually pretty good, well, for a throttled CPU at least:
   #    #  #    #  #  #    #          #####   ######  #    #   ####   #    #
   #    #  ##   #  #   #  #           #    #  #       ##   #  #    #  #    #
   #    #  # #  #  #    ##            #####   #####   # #  #  #       ######
   #    #  #  # #  #    ##            #    #  #       #  # #  #       #    #
   #    #  #   ##  #   #  #           #    #  #       #   ##  #    #  #    #
    ####   #    #  #  #    #          #####   ######  #    #   ####   #    #

   Version 5.1.3                      Based on the Byte Magazine Unix Benchmark

   Multi-CPU version                  Version 5 revisions by Ian Smith,
                                      Sunnyvale, CA, USA
   January 13, 2011                   johantheghost at yahoo period com


1 x Dhrystone 2 using register variables  1 2 3 4 5 6 7 8 9 10

1 x Double-Precision Whetstone  1 2 3 4 5 6 7 8 9 10

1 x Execl Throughput  1 2 3

1 x File Copy 1024 bufsize 2000 maxblocks  1 2 3

1 x File Copy 256 bufsize 500 maxblocks  1 2 3

1 x File Copy 4096 bufsize 8000 maxblocks  1 2 3

1 x Pipe Throughput  1 2 3 4 5 6 7 8 9 10

1 x Pipe-based Context Switching  1 2 3 4 5 6 7 8 9 10

1 x Process Creation  1 2 3

1 x System Call Overhead  1 2 3 4 5 6 7 8 9 10

1 x Shell Scripts (1 concurrent)  1 2 3

1 x Shell Scripts (8 concurrent)  1 2 3

4 x Dhrystone 2 using register variables  1 2 3 4 5 6 7 8 9 10

4 x Double-Precision Whetstone  1 2 3 4 5 6 7 8 9 10

4 x Execl Throughput  1 2 3

4 x File Copy 1024 bufsize 2000 maxblocks  1 2 3

4 x File Copy 256 bufsize 500 maxblocks  1 2 3

4 x File Copy 4096 bufsize 8000 maxblocks  1 2 3

4 x Pipe Throughput  1 2 3 4 5 6 7 8 9 10

4 x Pipe-based Context Switching  1 2 3 4 5 6 7 8 9 10

4 x Process Creation  1 2 3

4 x System Call Overhead  1 2 3 4 5 6 7 8 9 10

4 x Shell Scripts (1 concurrent)  1 2 3

4 x Shell Scripts (8 concurrent)  1 2 3

========================================================================
   BYTE UNIX Benchmarks (Version 5.1.3)

   System: beta: GNU/Linux
   OS: GNU/Linux -- 2.6.32-274.3.1.el5.028stab094.3 -- #1 SMP Thu Sep 22 13:24:07 MSD 2011
   Machine: i686 (unknown)
   Language: en_US.utf8 (charmap="ANSI_X3.4-1968", collate="ANSI_X3.4-1968")
   CPU 0: Intel(R) Core(TM) i7 CPU 920 @ 2.67GHz (5333.7 bogomips)
          Hyper-Threading, x86-64, MMX, Physical Address Ext, SYSENTER/SYSEXIT, SYSCALL/SYSRET, Intel virtualization
   CPU 1: Intel(R) Core(TM) i7 CPU 920 @ 2.67GHz (5333.4 bogomips)
          Hyper-Threading, x86-64, MMX, Physical Address Ext, SYSENTER/SYSEXIT, SYSCALL/SYSRET, Intel virtualization
   CPU 2: Intel(R) Core(TM) i7 CPU 920 @ 2.67GHz (5333.5 bogomips)
          Hyper-Threading, x86-64, MMX, Physical Address Ext, SYSENTER/SYSEXIT, SYSCALL/SYSRET, Intel virtualization
   CPU 3: Intel(R) Core(TM) i7 CPU 920 @ 2.67GHz (5333.5 bogomips)
          Hyper-Threading, x86-64, MMX, Physical Address Ext, SYSENTER/SYSEXIT, SYSCALL/SYSRET, Intel virtualization
   03:34:52 up  2:08,  1 user,  load average: 0.03, 0.85, 2.71; runlevel 2

------------------------------------------------------------------------
Benchmark Run: Fri Oct 28 2011 03:34:52 - 04:03:05
4 CPUs in system; running 1 parallel copy of tests

Dhrystone 2 using register variables       14087714.6 lps   (10.0 s, 7 samples)
Double-Precision Whetstone                     2759.5 MWIPS (10.1 s, 7 samples)
Execl Throughput                               4661.4 lps   (30.0 s, 2 samples)
File Copy 1024 bufsize 2000 maxblocks        579872.4 KBps  (30.0 s, 2 samples)
File Copy 256 bufsize 500 maxblocks          153434.5 KBps  (30.0 s, 2 samples)
File Copy 4096 bufsize 8000 maxblocks       1451064.9 KBps  (30.0 s, 2 samples)
Pipe Throughput                              965658.1 lps   (10.0 s, 7 samples)
Pipe-based Context Switching                 307186.2 lps   (10.0 s, 7 samples)
Process Creation                              14232.4 lps   (30.0 s, 2 samples)
Shell Scripts (1 concurrent)                   6405.4 lpm   (60.0 s, 2 samples)
Shell Scripts (8 concurrent)                    970.0 lpm   (60.0 s, 2 samples)
System Call Overhead                         732300.3 lps   (10.0 s, 7 samples)

System Benchmarks Index Values               BASELINE       RESULT    INDEX
Dhrystone 2 using register variables         116700.0   14087714.6   1207.2
Double-Precision Whetstone                       55.0       2759.5    501.7
Execl Throughput                                 43.0       4661.4   1084.1
File Copy 1024 bufsize 2000 maxblocks          3960.0     579872.4   1464.3
File Copy 256 bufsize 500 maxblocks            1655.0     153434.5    927.1
File Copy 4096 bufsize 8000 maxblocks          5800.0    1451064.9   2501.8
Pipe Throughput                               12440.0     965658.1    776.3
Pipe-based Context Switching                   4000.0     307186.2    768.0
Process Creation                                126.0      14232.4   1129.6
Shell Scripts (1 concurrent)                     42.4       6405.4   1510.7
Shell Scripts (8 concurrent)                      6.0        970.0   1616.6
System Call Overhead                          15000.0     732300.3    488.2
                                                                   ========
System Benchmarks Index Score                                        1049.7

------------------------------------------------------------------------
Benchmark Run: Fri Oct 28 2011 04:03:05 - 04:35:02
4 CPUs in system; running 4 parallel copies of tests

Dhrystone 2 using register variables       21082297.2 lps   (10.0 s, 7 samples)
Double-Precision Whetstone                    10985.8 MWIPS (10.1 s, 7 samples)
Execl Throughput                               6861.0 lps   (30.0 s, 2 samples)
File Copy 1024 bufsize 2000 maxblocks        378721.0 KBps  (30.0 s, 2 samples)
File Copy 256 bufsize 500 maxblocks           90864.1 KBps  (30.0 s, 2 samples)
File Copy 4096 bufsize 8000 maxblocks       1113855.8 KBps  (30.0 s, 2 samples)
Pipe Throughput                             1418491.1 lps   (10.0 s, 7 samples)
Pipe-based Context Switching                 473535.6 lps   (10.0 s, 7 samples)
Process Creation                              20991.8 lps   (30.0 s, 2 samples)
Shell Scripts (1 concurrent)                   8145.5 lpm   (60.0 s, 2 samples)
Shell Scripts (8 concurrent)                   1101.2 lpm   (60.1 s, 2 samples)
System Call Overhead                        1067595.6 lps   (10.0 s, 7 samples)

System Benchmarks Index Values               BASELINE       RESULT    INDEX
Dhrystone 2 using register variables         116700.0   21082297.2   1806.5
Double-Precision Whetstone                       55.0      10985.8   1997.4
Execl Throughput                                 43.0       6861.0   1595.6
File Copy 1024 bufsize 2000 maxblocks          3960.0     378721.0    956.4
File Copy 256 bufsize 500 maxblocks            1655.0      90864.1    549.0
File Copy 4096 bufsize 8000 maxblocks          5800.0    1113855.8   1920.4
Pipe Throughput                               12440.0    1418491.1   1140.3
Pipe-based Context Switching                   4000.0     473535.6   1183.8
Process Creation                                126.0      20991.8   1666.0
Shell Scripts (1 concurrent)                     42.4       8145.5   1921.1
Shell Scripts (8 concurrent)                      6.0       1101.2   1835.4
System Call Overhead                          15000.0    1067595.6    711.7
                                                                   ========
System Benchmarks Index Score                                        1337.5
The GeekBench score is prety impressive as well, at close to 5000 points:
System Information
  Platform:                  Linux x86 (32-bit)
  Compiler:                  GCC 4.1.2 20070925 (Red Hat 4.1.2-33)
  Operating System:          Linux 2.6.32-274.3.1.el5.028stab094.3 i686
  Model:                     Linux PC (Intel Core i7 920)
  Motherboard:               Unknown Motherboard
  Processor:                 Intel Core i7 920
  Processor ID:              GenuineIntel Family 6 Model 26 Stepping 5
  Logical Processors:        4
  Physical Processors:       1
  Processor Frequency:       1.00 GHz
  L1 Instruction Cache:      0.00 B
  L1 Data Cache:             0.00 B
  L2 Cache:                  256 KB
  L3 Cache:                  0.00 B
  Bus Frequency:             0.00 Hz
  Memory:                    11.7 GB
  Memory Type:               N/A
  SIMD:                      1
  BIOS:                      N/A
  Processor Model:           Intel Core i7 920
  Processor Cores:           4

Integer
  Blowfish
    single-threaded scalar    1864 |||||||
    multi-threaded scalar     4533 ||||||||||||||||||
  Text Compress
    single-threaded scalar    1642 ||||||
    multi-threaded scalar     3463 |||||||||||||
  Text Decompress
    single-threaded scalar    2160 ||||||||
    multi-threaded scalar     4210 ||||||||||||||||
  Image Compress
    single-threaded scalar    1766 |||||||
    multi-threaded scalar     3409 |||||||||||||
  Image Decompress
    single-threaded scalar    1625 ||||||
    multi-threaded scalar     3392 |||||||||||||
  Lua
    single-threaded scalar    3318 |||||||||||||
    multi-threaded scalar     5324 |||||||||||||||||||||

Floating Point
  Mandelbrot
    single-threaded scalar    2238 ||||||||
    multi-threaded scalar     4528 ||||||||||||||||||
  Dot Product
    single-threaded scalar    3645 ||||||||||||||
    multi-threaded scalar     7594 ||||||||||||||||||||||||||||||
    single-threaded vector    4360 |||||||||||||||||
    multi-threaded vector     9872 |||||||||||||||||||||||||||||||||||||||
  LU Decomposition
    single-threaded scalar    2552 ||||||||||
    multi-threaded scalar     5145 ||||||||||||||||||||
  Primality Test
    single-threaded scalar    3645 ||||||||||||||
    multi-threaded scalar     4807 |||||||||||||||||||
  Sharpen Image
    single-threaded scalar    6150 ||||||||||||||||||||||||
    multi-threaded scalar    12901 |||||||||||||||||||||||||||||||||||||||||||||||||||
  Blur Image
    single-threaded scalar    5623 ||||||||||||||||||||||
    multi-threaded scalar    11069 ||||||||||||||||||||||||||||||||||||||||||||

Memory
  Read Sequential
    single-threaded scalar    5249 ||||||||||||||||||||
  Write Sequential
    single-threaded scalar    9403 |||||||||||||||||||||||||||||||||||||
  Stdlib Allocate
    single-threaded scalar    4083 ||||||||||||||||
  Stdlib Write
    single-threaded scalar    4581 ||||||||||||||||||
  Stdlib Copy
    single-threaded scalar    9071 ||||||||||||||||||||||||||||||||||||

Stream
  Stream Copy
    single-threaded scalar    4841 |||||||||||||||||||
    single-threaded vector    6250 |||||||||||||||||||||||||
  Stream Scale
    single-threaded scalar    4234 ||||||||||||||||
    single-threaded vector    5889 |||||||||||||||||||||||
  Stream Add
    single-threaded scalar    4154 ||||||||||||||||
    single-threaded vector    5684 ||||||||||||||||||||||
  Stream Triad
    single-threaded scalar    4318 |||||||||||||||||
    single-threaded vector    3985 |||||||||||||||

Integer Score:                3058 ||||||||||||
Floating Point Score:         6009 ||||||||||||||||||||||||
Memory Score:                 6477 |||||||||||||||||||||||||
Stream Score:                 4919 |||||||||||||||||||

Overall Geekbench Score:      4960 |||||||||||||||||||
Testing again showed a similar result:
System Information
  Platform:                  Linux x86 (32-bit)
  Compiler:                  GCC 4.1.2 20070925 (Red Hat 4.1.2-33)
  Operating System:          Linux 2.6.32-274.3.1.el5.028stab094.3 i686
  Model:                     Linux PC (Intel Core i7 920)
  Motherboard:               Unknown Motherboard
  Processor:                 Intel Core i7 920
  Processor ID:              GenuineIntel Family 6 Model 26 Stepping 5
  Logical Processors:        4
  Physical Processors:       1
  Processor Frequency:       1.00 GHz
  L1 Instruction Cache:      0.00 B
  L1 Data Cache:             0.00 B
  L2 Cache:                  256 KB
  L3 Cache:                  0.00 B
  Bus Frequency:             0.00 Hz
  Memory:                    11.7 GB
  Memory Type:               N/A
  SIMD:                      1
  BIOS:                      N/A
  Processor Model:           Intel Core i7 920
  Processor Cores:           4

Integer
  Blowfish
    single-threaded scalar    1863 |||||||
    multi-threaded scalar     4055 ||||||||||||||||
  Text Compress
    single-threaded scalar    2132 ||||||||
    multi-threaded scalar     3528 ||||||||||||||
  Text Decompress
    single-threaded scalar    2145 ||||||||
    multi-threaded scalar     4162 ||||||||||||||||
  Image Compress
    single-threaded scalar    1761 |||||||
    multi-threaded scalar     3412 |||||||||||||
  Image Decompress
    single-threaded scalar    1650 ||||||
    multi-threaded scalar     3333 |||||||||||||
  Lua
    single-threaded scalar    3308 |||||||||||||
    multi-threaded scalar     5527 ||||||||||||||||||||||

Floating Point
  Mandelbrot
    single-threaded scalar    2233 ||||||||
    multi-threaded scalar     4580 ||||||||||||||||||
  Dot Product
    single-threaded scalar    3645 ||||||||||||||
    multi-threaded scalar     7727 ||||||||||||||||||||||||||||||
    single-threaded vector    4334 |||||||||||||||||
    multi-threaded vector     9850 |||||||||||||||||||||||||||||||||||||||
  LU Decomposition
    single-threaded scalar    2557 ||||||||||
    multi-threaded scalar     3527 ||||||||||||||
  Primality Test
    single-threaded scalar    3688 ||||||||||||||
    multi-threaded scalar     4962 |||||||||||||||||||
  Sharpen Image
    single-threaded scalar    6151 ||||||||||||||||||||||||
    multi-threaded scalar    12305 |||||||||||||||||||||||||||||||||||||||||||||||||
  Blur Image
    single-threaded scalar    5616 ||||||||||||||||||||||
    multi-threaded scalar    11074 ||||||||||||||||||||||||||||||||||||||||||||

Memory
  Read Sequential
    single-threaded scalar    5249 ||||||||||||||||||||
  Write Sequential
    single-threaded scalar    9400 |||||||||||||||||||||||||||||||||||||
  Stdlib Allocate
    single-threaded scalar    4090 ||||||||||||||||
  Stdlib Write
    single-threaded scalar    4685 ||||||||||||||||||
  Stdlib Copy
    single-threaded scalar    9349 |||||||||||||||||||||||||||||||||||||

Stream
  Stream Copy
    single-threaded scalar    4883 |||||||||||||||||||
    single-threaded vector    6396 |||||||||||||||||||||||||
  Stream Scale
    single-threaded scalar    4216 ||||||||||||||||
    single-threaded vector    6080 ||||||||||||||||||||||||
  Stream Add
    single-threaded scalar    4095 ||||||||||||||||
    single-threaded vector    5571 ||||||||||||||||||||||
  Stream Triad
    single-threaded scalar    4275 |||||||||||||||||
    single-threaded vector    3845 |||||||||||||||

Integer Score:                3073 ||||||||||||
Floating Point Score:         5874 |||||||||||||||||||||||
Memory Score:                 6554 ||||||||||||||||||||||||||
Stream Score:                 4920 |||||||||||||||||||

Overall Geekbench Score:      4934 |||||||||||||||||||
Customer Service and Support
With regards to the support of Up2VPS, I have a conflicting view about it. On one hand, their support is really fast and a ticket I have sent in on a Friday at 5:40AM (and no, it is not related to how much beer I have had) was responded with 2 minutes. However, on the other hand, their ability to comprehend the questions is really what made me a little cautious before recommending them. I do understand that keeping the tickets answered fast is important, however reading tickets carefully (and posting advertisements carefully, as illustrated by their advertisement on LowEndTalk. Is the server going to be shut down on November 1, as indicated in the title, or November 11, as indicated in the actual post) is pretty important as well.
Conclusion
Overall, the VPS they have provided for “playing around” was pretty solid, other than having a throttled CPU, everything else looks really great. However, although the customer service and support is fast, you might not get the answer you are exactly looking for. Therefore, I can really recommend them if you just need a VPS “for just play”.
Hi,
Thanks You for list it.i would provide more info he node you have tested old node and we go to shoutdown it in 11th our new Germany and Seattle more Reliable ,
Intel® Xeon® E3-1245 3.30gz
i/O test on not refresh node
[root@xxxx ~]# dd if=/dev/zero of=test bs=16k count=16k conv=fdatasync
16384+0 records in
16384+0 records out
268435456 bytes (268 MB) copied, 1.14895 seconds, 234 MB/s
We have offer before 2Gb 7$ in France last month ago and this month in Germany and Seattle so we can survivor 😀
Also we offer this node for 1$ only becuse will shoutdown on 11th as we planning and no one already use it
Before considering doing business with UP2VPS, read through the comments and replies at Low End Box:
http://www.lowendbox.com/blog/up2vps-7-2gb-openvz-vps-in-scranton-or-france/
These guys are dishonest, they mistreat their customers, and are difficult to work with. Buyer beware.
@d’Armond: I share the pain, what they promised to be up by November 11 was down by November 1, gotta be the most expensive VPS I have purchased ever haha 🙂
@ d’Armond , we won’t explain anymore belive or not it’s back for you
@admin , the server never shutdown on 1th , the we shutdown server on 16th not 1th if you are said that becuse go offline on solusvm this becuse we have removed node from solusvm surly it will be offline in panel but node was up till 16th or so
@ d’Armond , we won’t explain anymore belive or not it’s back for you
@admin , the server never shutdown on 1th , the we shutdown server on 16th not 1th if you are said that becuse go offline on solusvm this becuse we have removed node from solusvm surly it will be offline in panel but node was up till 16th or so
@Daniel: Sorry I have removed the monitoring record for that VPS so I can not substantiate my claim. However I do log into the VPS via putty to check if they are offline or not, I know SolusVM sometimes says ridiculous things 🙂 Anyways, I’ll take my claim back since I can not substantiate that, sorry.
ok no problem 😀
about solusvm no we have removed this node on 1th from solusvm and add new one so it shows offline but the vps was up 😀
Wow, completely incomprehensible. I almost can’t understand a word Daniel says.
This is typical of this guy. He’s never answered my questions anywhere, but he claims he did and then runs away. He is a liar. Don’t do business with him, ever.
Daniel, I am still waiting for a clear answer from you on what your SLA policy is. You’ve never answered that question anywhere. Was the 10+ hours of downtime I experienced on your POS service covered? I believe it should have been and I believe you should refund me the money I wasted. All you’ve ever said is, basically, “too bad,” which isn’t an SLA. I don’t even think you know what an SLA is.
You lure people to purchase your crap service with the promise of an SLA, then refuse to stand by the SLA when you can’t keep your servers up. This is fraudulent advertising and is no way to treat your customers.
Daniel, if you’re going to respond to this, please take a moment to carefully work on your English. It is nearly impossible to understand you (or anyone else at your company, for that matter).
read
http://up2vps.com/tog.php
we have issue with this page we will fix it as soon as possible
After months of asking, this is what you come up with? Why could nobody provide this information before? Why, if this is your policy, was I refused recompense by your company for the downtime I experienced? Again, over 10 hours of downtime in over 5 separate outages over 3 weeks, at least one of which was caused by you taking my server down without cause or notice.
Unless you stand by your claimed SLA, it’s just bull$#!\ to trick gullible people into making the mistake of doing business with you. Man up and admit you were wrong and that your customer was right. Stop hiding behind lies and bad English.
You used to offer $2 refund for every 2 hours of downtime. Now this page says $0.50 credit for every 2 hours. Either way you cheated me by not acknowledging my downtime, but clearly you’re heading in the wrong direction. You clearly don’t care about your customers at all.
You are missed something there if you are get less than 99.94% Uptime i can give you credit to can up to 99.94% .
PS: credit not mean refunded your payment it’s credit under your account with us