
96MB Low End VPS Review Part XXXII – EDIS
OK, so I have had some fun in doing the review for QualityServers (which was completed unscheduled), now it is back to the schedule again. Flipping through the list, I realised I have promised circus more than a month ago for a review on EDIS.at, which I have not done so yet, so here we go.
General Information and Set Up
Being an Austrian company, EDIS for sure have enjoyed quite a bit of freedom in the online contents as per William (who is now working for EDIS), another strength with their services is the fact that they are using Linux VServer and actually have their own control panel, which seems to be an indication of they know what they are doing (since Linux VServer is much harder to set up and maintain compare to the standard virtualization platforms such as OpenVZ and Xen), but obviously, it could also be a more risky bet if things are not working properly, so let’s take a look to see how it does.
There are three data centres that EDIS have been selling VPS from, in Austria, Italy, UK and Switzerland (with US coming this month). If you enter the EDIS website via just the edis.at, you will be greeted with German language (in fact, this is the first time I know Austrians actually speak German, see you get to learn a lot in the VPS world!)

Switching to English can be done via the link on the top right hand side corner, or going to en.edis.at, which would make the website much more readable to people who are not German speakers.

Instead of being called VPS, their VPS service is named as VRS (Virtual Root Server) and as per their website, here is what you will be getting for 2.99 Euro per month (plus VAT if you are in European Union):
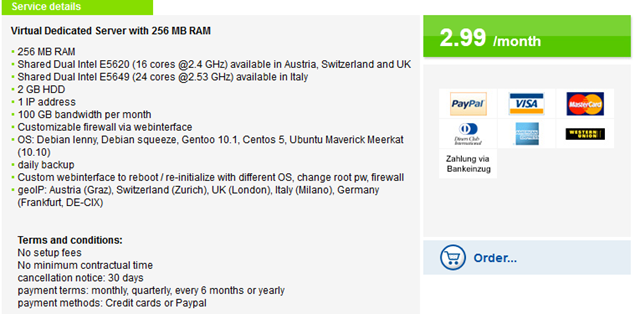
However, if 2GB is too small for you, BESMART is what you want to type in the promo code field to receive 5GB of hard drive space, as per their advertisement on LEB:

5GB still may be quite small for many people, however I guess the real deal is the 16 core processor that you get.
The sign up page is also in Germen using HTTPS connection, with a link to the English sign up page at the bottom:

Once clicking on the English version link, here is what you see:
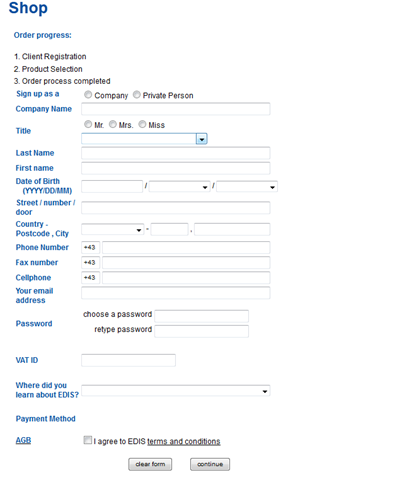
Once you have entered all your details, an account will be created for you and you will be emailed your client ID in English and password in plaintext.
After the order is made, you will receive two emails, one in English and one in German, describing the products you have signed up with.
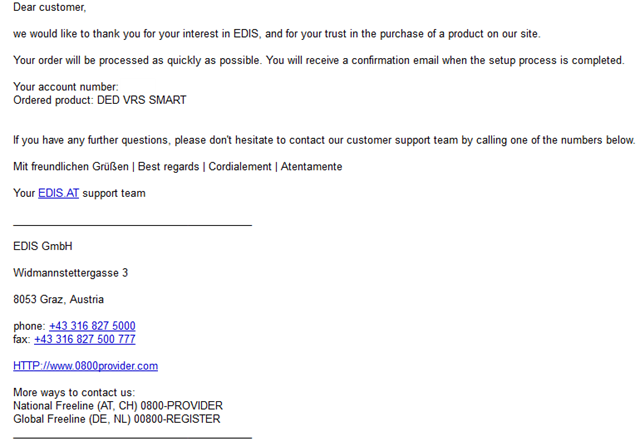
Interestingly enough, the link in the signature area is 0800provider.com, instead of edis.at. However, clicking on 0800provider.com does lead to edis.at, so I guess it is just another name that they conduct business with.
The VPS set up is not instant, however is pretty fast, I have received the order confirmation email at 9:41pm and the VPS credential came in at 11:13pm, about 1.5 hours later, and again, two emails came in, one in English and one in Germen.
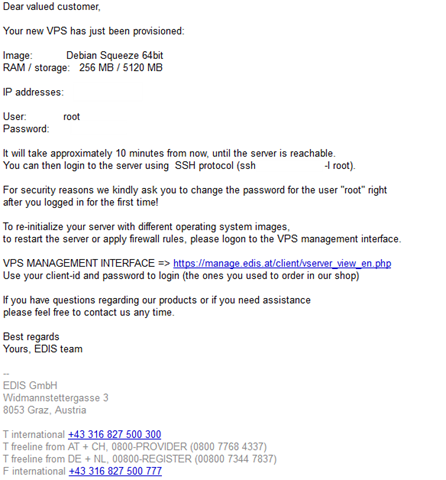
As you can see, the password is in plain text and the management portal interface is on HTTPS connection with a URL that seems to say that the control portal is in English.
However, the interesting part is that after you first entered the control portal, it is actually in German language:
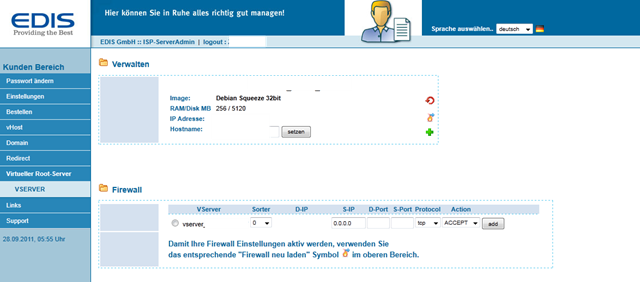
You actually need to click on the top right corner to switch to English interface, which is just a single click. However, you can see that even the English interface still have some Germen words in it on the top, which is not really a big deal:
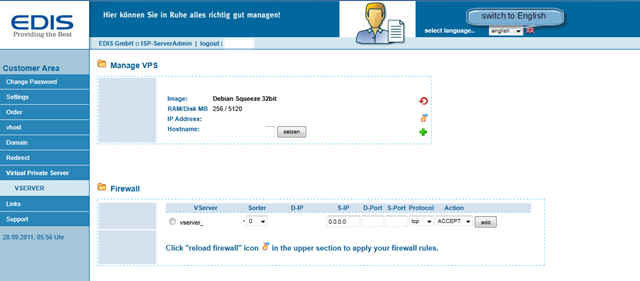
There are basically 3 buttons on the top half of the VPS control panel, for rebooting the VPS, reload firewall rules and reload OS (restore VRS). Although reboot server and reload OS templates are pretty common in the SolusVM control panel, the ability to create firewall rules in the graphical interface is definitely the first I have seen. I think to those people who knows next to nothing about IP Tables (for example, me), it would be really helpful.
Clicking on the green plus button in the main control panel shows the following options which will allow you to restore your VRS:
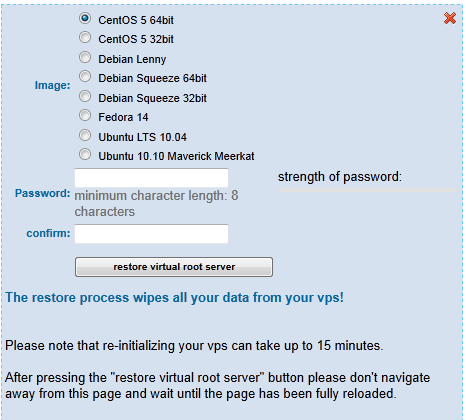
As you can see, there are a few OS templates available, although relatively limited, definitely covered majority of the Linux users. One interesting feature is that you will need to set your root password every time you reload the OS. I guess you can view it in two ways, although it does makes reloading the OS a little more troublesome, it probably means EDIS is not going to store your password on their server, which is different from SolusVM, where the password is actually stored on the SolusVM master, if I remember it correctly.
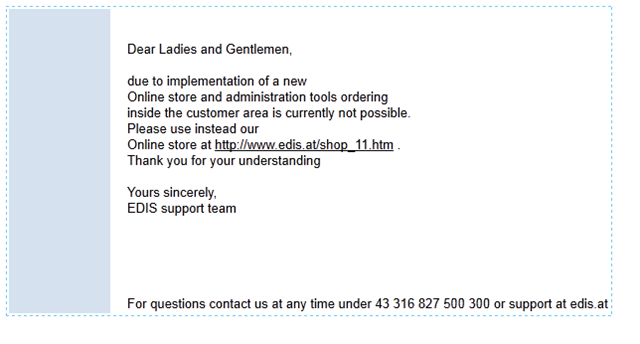
Apparently some parts of the control panel are still under construction, for instance, this is what I see when I clicked on the order button:
One interesting fact here is that EDIS has a very interesting way of billing the VPS users. Instead of the pre-pay system that almost all VPS providers use, EDIS actually bring the VPS online for you first, and you do not get invoiced until a few days later. The first invoice is for 2 months, covering both the month you have used (or a portion of that month) plus the next month. For example, I have signed up on September 18, and received an invoice on September 30 asking me to pay from September 20 to October 19 as well as October 20 to November 19.
Test on the VPS
As mentioned above, the VPS that I have used for testing is a VPS Smart that has 256MB of RAM (although I am not too sure what the 5120MB in my welcome email represent), 5GB of hard drive space (you have to use coupon code BESMART, although it was added when the VPS was first provisioned, i.e., no separate ticket/request is needed) which seems to be on SSD Correction: As per William’s comment here, it is RAID10 SAS. The VPS is based in Switzerland (although the city advertised is Zurich, the results of some of the IP tracking tools seems to indicate the VPS is actually in Bern, although I highly doubt how much differences it will make although just on a completely unrelated note, I like Zurich as a city much more than Bern (apologies to the fellows in Bundesstadt).
For some reason, Debian 6 64 bit was provisioned although I seemed to have chosen 32 bit during the sign up process (I could be wrong though):
 uname -a
Linux  2.6.32-5-vserver-amd64 #1 SMP Thu May 19 00:37:17 UTC 2011 x86_64 GNU/Linux
With a fresh reload of the OS template, only 7MB of memory was used:
 free -m
             total       used       free     shared    buffers     cached
Mem:           256          7        248          0          0          0
-/+ buffers/cache:          7        248
Swap:            0          0          0
And top output to show that very few processes were running:
top - 05:33:20 up 18 min,  1 user,  load average: 1.79, 1.81, 1.66
Tasks:   6 total,   1 running,   5 sleeping,   0 stopped,   0 zombie
Cpu(s): 16.1%us, 23.7%sy,  0.0%ni, 60.1%id,  0.0%wa,  0.0%hi,  0.1%si,  0.0%st
Mem:    262144k total,     8652k used,   253492k free,      192k buffers
Swap:        0k total,        0k used,        0k free,        0k cached

  PID USER      PR  NI  VIRT  RES  SHR S %CPU %MEM    TIME+  COMMAND
31062 root      20   0 70488 3396 2640 S    0  1.3   0:00.03 sshd
32567 root      20   0 19216 2004 1528 S    0  0.8   0:00.00 bash
19555 root      20   0 18932 1236 1000 R    0  0.5   0:00.00 top
 1626 root      20   0 49168 1168  616 S    0  0.4   0:00.00 sshd
 1619 root      20   0 22392  848  648 S    0  0.3   0:00.00 cron
    1 root      20   0  8352  696  644 S    0  0.3  10:38.99 init
Little hard drive space was taken up as well:
 df -h
Filesystem            Size  Used Avail Use% Mounted on
/dev/hdv1             5.0G  237M  4.8G   5% /
none                   16M     0   16M   0% /stmp
I then loaded the 32 bit OS template, although for some reason, x86_84 was still displayed, I guess the host is running on a 64 bit OS:
 uname -a
Linux vserver***** 2.6.32-5-vserver-amd64 #1 SMP Thu May 19 00:37:17 UTC 2011 x86_64 GNU/Linux
Surprisingly, the memory usage is the same:
 free -m
             total       used       free     shared    buffers     cached
Mem:           256          7        248          0          0          0
-/+ buffers/cache:          7        248
Swap:            0          0          0
And the top output appears to be almost the same as well:
top - 14:13:33 up 10:37,  1 user,  load average: 1.82, 1.77, 1.85
Tasks:   6 total,   1 running,   5 sleeping,   0 stopped,   0 zombie
Cpu(s):  8.9%us, 12.0%sy,  0.0%ni, 78.9%id,  0.0%wa,  0.0%hi,  0.2%si,  0.0%st
Mem:    262144k total,     8024k used,   254120k free,      192k buffers
Swap:        0k total,        0k used,        0k free,        0k cached

  PID USER      PR  NI  VIRT  RES  SHR S %CPU %MEM    TIME+  COMMAND
13468 root      20   0  8464 2972 2324 S    0  1.1   0:00.04 sshd
13940 root      20   0  2960 1620 1296 S    0  0.6   0:00.00 bash
 8548 root      20   0 19104 1372 1024 S    0  0.5   0:00.00 rsyslogd
17076 root      20   0  2328 1068  876 R    0  0.4   0:00.00 top
 8562 root      20   0  5488  992  604 S    0  0.4   0:00.00 sshd
    1 root      20   0  8352  696  644 S    0  0.3  10:40.56 init
Hard drive spaced used by the 32 bit version is in fact more than the amount used by the 64 bit version.
df -h
Filesystem            Size  Used Avail Use% Mounted on
/dev/hdv1             5.0G  248M  4.8G   5% /
none                   16M     0   16M   0% /stmp
With the full LNMP stack installed, more than 50MB of RAM was used:
 free -m
             total       used       free     shared    buffers     cached
Mem:           256         51        204          0          0          0
-/+ buffers/cache:         51        204
Swap:            0          0          0
Corresponding top output showing the full LNMP stack running:
top - 00:50:45 up 7 days, 10:02,  1 user,  load average: 0.26, 0.27, 0.20
Tasks:  17 total,   1 running,  16 sleeping,   0 stopped,   0 zombie
Cpu(s):  0.9%us,  0.4%sy,  0.0%ni, 98.7%id,  0.0%wa,  0.0%hi,  0.0%si,  0.0%st
Mem:    262144k total,    53192k used,   208952k free,      360k buffers
Swap:        0k total,        0k used,        0k free,        0k cached

  PID USER      PR  NI  VIRT  RES  SHR S %CPU %MEM    TIME+  COMMAND
13277 www       20   0 14872  10m  828 S    0  4.3   0:00.09 nginx
12997 mysql     20   0 34796 5792 3108 S    0  2.2   0:00.01 mysqld
13305 www       20   0 22532 4724 1592 S    0  1.8   0:00.00 php-cgi
13306 www       20   0 22532 4724 1592 S    0  1.8   0:00.00 php-cgi
13304 root      20   0 22532 4472 1364 S    0  1.7   1:41.16 php-cgi
13307 www       20   0 22532 4104  996 S    0  1.6   0:00.00 php-cgi
13308 www       20   0 22532 4104  996 S    0  1.6   0:00.00 php-cgi
13311 www       20   0 22532 4104  996 S    0  1.6   0:00.00 php-cgi
22308 root      20   0  8252 2840 2328 S    0  1.1   0:00.10 sshd
22485 root      20   0  2968 1624 1292 S    0  0.6   0:00.00 bash
12871 root      20   0 20128 1460 1064 S    0  0.6   0:01.86 rsyslogd
23206 root      20   0  2328 1076  880 R    0  0.4   0:00.00 top
13002 root      20   0  5488 1000  612 S    0  0.4   0:02.47 sshd
13009 root      20   0  2288  764  600 S    0  0.3   0:00.49 cron
13275 root      20   0  4684  700  264 S    0  0.3   0:00.00 nginx
    1 root      20   0  8352  692  640 S    0  0.3  12:46.84 init
12866 root      20   0  1744  528  444 S    0  0.2   0:00.00 mysqld_safe
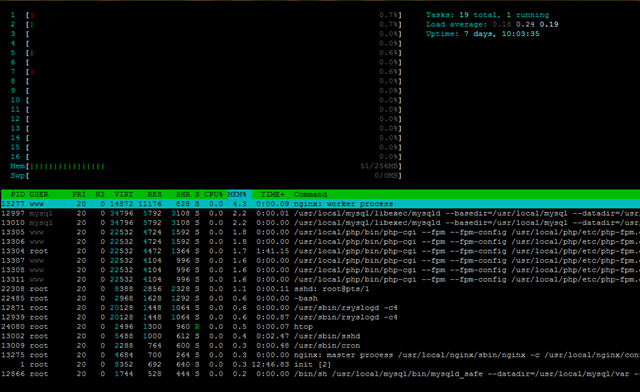
And htop output, as usual, for the htop fans:
About 2.8GB of hard drive space was used:
 df -h
Filesystem            Size  Used Avail Use% Mounted on
/dev/hdv1             5.0G  2.8G  2.3G  55% /
none                   16M     0   16M   0% /stmp
The Inodes are set to pretty high values as well, which is good:
 df -i
Filesystem            Inodes   IUsed   IFree IUse% Mounted on
/dev/hdv1            976564288 7053383 969510905    1% /
none                 6194305       1 6194304    1% /stmp
As the virtualization platform is Linux vserver, many of the tests designed for OpenVZ won’t work here, for example, here is what I see when I run vmstat:
 vmstat
procs -----------memory---------- ---swap-- -----io---- -system-- ----cpu----
 r  b   swpd   free   buff  cache   si   so    bi    bo   in   cs us sy id wa
Error: /proc must be mounted
  To mount /proc at boot you need an /etc/fstab line like:
      /proc   /proc   proc    defaults
  In the meantime, run "mount /proc /proc -t proc"
And of course, there is also no beancounters to start with.
Uptime showed pretty high load averages:
uptime
 14:45:57 up 11:10,  1 user,  load average: 1.82, 2.04, 1.92
However, this is not an issue once you see this:
cat /proc/cpuinfo | grep processor
processor       : 0
processor       : 1
processor       : 2
processor       : 3
processor       : 4
processor       : 5
processor       : 6
processor       : 7
processor       : 8
processor       : 9
processor       : 10
processor       : 11
processor       : 12
processor       : 13
processor       : 14
processor       : 15
Yes, as described in the sections above, this VPS, although really tiny,actually have access to 16 shared CPU cores, which is definitely one of the low end VPS services that offer the most number of CPU cores I have ever seen. From what I can see, none of the cores appears to be throttled as well:
vendor_id       : GenuineIntel
cpu family      : 6
model           : 44
model name      : Intel(R) Xeon(R) CPU           E5620  @ 2.40GHz
stepping        : 2
cpu MHz         : 2400.132
cache size      : 12288 KB
physical id     : 1
siblings        : 8
core id         : 0
cpu cores       : 4
apicid          : 33
initial apicid  : 33
fpu             : yes
fpu_exception   : yes
cpuid level     : 11
wp              : yes
flags           : fpu vme de pse tsc msr pae mce cx8 apic sep mtrr pge mca cmov pat pse36 clflush dts acpi mmx fxsr sse sse2 ss ht tm pbe syscall nx pdpe1gb rdtscp lm constant_tsc arch_perfmon pebs bts rep_good xtopology nonstop_tsc aperfmperf pni pclmulqdq dtes64 monitor ds_cpl vmx smx est tm2 ssse3 cx16 xtpr pdcm dca sse4_1 sse4_2 popcnt aes lahf_lm ida arat tpr_shadow vnmi flexpriority ept vpid
bogomips        : 4800.20
clflush size    : 64
cache_alignment : 64
address sizes   : 40 bits physical, 48 bits virtual
power management:

processor       : 10
vendor_id       : GenuineIntel
cpu family      : 6
model           : 44
model name      : Intel(R) Xeon(R) CPU           E5620  @ 2.40GHz
stepping        : 2
cpu MHz         : 2400.132
cache size      : 12288 KB
physical id     : 0
siblings        : 8
core id         : 10
cpu cores       : 4
apicid          : 21
initial apicid  : 21
fpu             : yes
fpu_exception   : yes
cpuid level     : 11
wp              : yes
flags           : fpu vme de pse tsc msr pae mce cx8 apic sep mtrr pge mca cmov pat pse36 clflush dts acpi mmx fxsr sse sse2 ss ht tm pbe syscall nx pdpe1gb rdtscp lm constant_tsc arch_perfmon pebs bts rep_good xtopology nonstop_tsc aperfmperf pni pclmulqdq dtes64 monitor ds_cpl vmx smx est tm2 ssse3 cx16 xtpr pdcm dca sse4_1 sse4_2 popcnt aes lahf_lm ida arat tpr_shadow vnmi flexpriority ept vpid
bogomips        : 4800.18
clflush size    : 64
cache_alignment : 64
address sizes   : 40 bits physical, 48 bits virtual
power management:

processor       : 11
vendor_id       : GenuineIntel
cpu family      : 6
model           : 44
model name      : Intel(R) Xeon(R) CPU           E5620  @ 2.40GHz
stepping        : 2
cpu MHz         : 2400.132
cache size      : 12288 KB
physical id     : 1
siblings        : 8
core id         : 10
cpu cores       : 4
apicid          : 53
initial apicid  : 53
fpu             : yes
fpu_exception   : yes
cpuid level     : 11
wp              : yes
flags           : fpu vme de pse tsc msr pae mce cx8 apic sep mtrr pge mca cmov pat pse36 clflush dts acpi mmx fxsr sse sse2 ss ht tm pbe syscall nx pdpe1gb rdtscp lm constant_tsc arch_perfmon pebs bts rep_good xtopology nonstop_tsc aperfmperf pni pclmulqdq dtes64 monitor ds_cpl vmx smx est tm2 ssse3 cx16 xtpr pdcm dca sse4_1 sse4_2 popcnt aes lahf_lm ida arat tpr_shadow vnmi flexpriority ept vpid
bogomips        : 4800.19
clflush size    : 64
cache_alignment : 64
address sizes   : 40 bits physical, 48 bits virtual
power management:

processor       : 12
vendor_id       : GenuineIntel
cpu family      : 6
model           : 44
model name      : Intel(R) Xeon(R) CPU           E5620  @ 2.40GHz
stepping        : 2
cpu MHz         : 2400.132
cache size      : 12288 KB
physical id     : 0
siblings        : 8
core id         : 1
cpu cores       : 4
apicid          : 3
initial apicid  : 3
fpu             : yes
fpu_exception   : yes
cpuid level     : 11
wp              : yes
flags           : fpu vme de pse tsc msr pae mce cx8 apic sep mtrr pge mca cmov pat pse36 clflush dts acpi mmx fxsr sse sse2 ss ht tm pbe syscall nx pdpe1gb rdtscp lm constant_tsc arch_perfmon pebs bts rep_good xtopology nonstop_tsc aperfmperf pni pclmulqdq dtes64 monitor ds_cpl vmx smx est tm2 ssse3 cx16 xtpr pdcm dca sse4_1 sse4_2 popcnt aes lahf_lm ida arat tpr_shadow vnmi flexpriority ept vpid
bogomips        : 4800.18
clflush size    : 64
cache_alignment : 64
address sizes   : 40 bits physical, 48 bits virtual
power management:

processor       : 13
vendor_id       : GenuineIntel
cpu family      : 6
model           : 44
model name      : Intel(R) Xeon(R) CPU           E5620  @ 2.40GHz
stepping        : 2
cpu MHz         : 2400.132
cache size      : 12288 KB
physical id     : 1
siblings        : 8
core id         : 1
cpu cores       : 4
apicid          : 35
initial apicid  : 35
fpu             : yes
fpu_exception   : yes
cpuid level     : 11
wp              : yes
flags           : fpu vme de pse tsc msr pae mce cx8 apic sep mtrr pge mca cmov pat pse36 clflush dts acpi mmx fxsr sse sse2 ss ht tm pbe syscall nx pdpe1gb rdtscp lm constant_tsc arch_perfmon pebs bts rep_good xtopology nonstop_tsc aperfmperf pni pclmulqdq dtes64 monitor ds_cpl vmx smx est tm2 ssse3 cx16 xtpr pdcm dca sse4_1 sse4_2 popcnt aes lahf_lm ida arat tpr_shadow vnmi flexpriority ept vpid
bogomips        : 4800.20
clflush size    : 64
cache_alignment : 64
address sizes   : 40 bits physical, 48 bits virtual
power management:

processor       : 14
vendor_id       : GenuineIntel
cpu family      : 6
model           : 44
model name      : Intel(R) Xeon(R) CPU           E5620  @ 2.40GHz
stepping        : 2
cpu MHz         : 2400.132
cache size      : 12288 KB
physical id     : 0
siblings        : 8
core id         : 9
cpu cores       : 4
apicid          : 19
initial apicid  : 19
fpu             : yes
fpu_exception   : yes
cpuid level     : 11
wp              : yes
flags           : fpu vme de pse tsc msr pae mce cx8 apic sep mtrr pge mca cmov pat pse36 clflush dts acpi mmx fxsr sse sse2 ss ht tm pbe syscall nx pdpe1gb rdtscp lm constant_tsc arch_perfmon pebs bts rep_good xtopology nonstop_tsc aperfmperf pni pclmulqdq dtes64 monitor ds_cpl vmx smx est tm2 ssse3 cx16 xtpr pdcm dca sse4_1 sse4_2 popcnt aes lahf_lm ida arat tpr_shadow vnmi flexpriority ept vpid
bogomips        : 4800.19
clflush size    : 64
cache_alignment : 64
address sizes   : 40 bits physical, 48 bits virtual
power management:

processor       : 15
vendor_id       : GenuineIntel
cpu family      : 6
model           : 44
model name      : Intel(R) Xeon(R) CPU           E5620  @ 2.40GHz
stepping        : 2
cpu MHz         : 2400.132
cache size      : 12288 KB
physical id     : 1
siblings        : 8
core id         : 9
cpu cores       : 4
apicid          : 51
initial apicid  : 51
fpu             : yes
fpu_exception   : yes
cpuid level     : 11
wp              : yes
flags           : fpu vme de pse tsc msr pae mce cx8 apic sep mtrr pge mca cmov pat pse36 clflush dts acpi mmx fxsr sse sse2 ss ht tm pbe syscall nx pdpe1gb rdtscp lm constant_tsc arch_perfmon pebs bts rep_good xtopology nonstop_tsc aperfmperf pni pclmulqdq dtes64 monitor ds_cpl vmx smx est tm2 ssse3 cx16 xtpr pdcm dca sse4_1 sse4_2 popcnt aes lahf_lm ida arat tpr_shadow vnmi flexpriority ept vpid
bogomips        : 4800.19
clflush size    : 64
cache_alignment : 64
address sizes   : 40 bits physical, 48 bits virtual
power management:
Note that here some of the information were truncated as they are exactly the same for all cores.
If this does not surprise you enough, the disk I/O on these SSD VPS are definitely very remarkable as well:
dd if=/dev/zero of=test bs=64k count=16k conv=fdatasync
16384+0 records in
16384+0 records out
1073741824 bytes (1.1 GB) copied, 5.66685 s, 189 MB/s
Test again showed slightly “worse” results, but they are definitely very impressive:
 dd if=/dev/zero of=test bs=64k count=16k conv=fdatasync
16384+0 records in
16384+0 records out
1073741824 bytes (1.1 GB) copied, 5.93992 s, 181 MB/s
Network speed does seems to be pretty good as well:
wget cachefly.cachefly.net/100mb.test -O /dev/null
--2011-09-20 14:46:56--  http://cachefly.cachefly.net/100mb.test
Resolving cachefly.cachefly.net... 205.234.175.175
Connecting to cachefly.cachefly.net|205.234.175.175|:80... connected.
HTTP request sent, awaiting response... 200 OK
Length: 104857600 (100M) [application/octet-stream]
Saving to: `/dev/null'

100%[======================================>] 104,857,600 10.4M/s   in 9.5s

2011-09-20 14:47:05 (10.6 MB/s) - `/dev/null' saved [104857600/104857600]
Bear in mind this is a 100mbit port (you can only get 1Gbit port if you are having the VPS in Austria.
Upload speed varies, however they all appears to be within the acceptable range:
First is the Nix Communication’s VPS in Montreal, Canada:
 wget 178.209.40.79/100mb.test -O /dev/null
--2011-09-28 11:53:31--  http://178.209.40.79/100mb.test
Connecting to 178.209.40.79:80... connected.
HTTP request sent, awaiting response... 200 OK
Length: 104857600 (100M) [application/octet-stream]
Saving to: `/dev/null'

100%[======================================>] 104,857,600 1.16M/s   in 96s

2011-09-28 11:55:07 (1.04 MB/s) - `/dev/null' saved [104857600/104857600]
Note that this will be the last review that is using this VPS to test the network speed as Nix Communication’s has officially ended business as of this past weekend.
Replacing this Nix Communication’s VPS for testing the upload speed on the East Coast, is a VPS from BuffaloVPS in Chicago with ColoCrossing, which showed pretty good output in the wget test.
wget 178.209.40.79/100mb.test -O /dev/null
--2011-09-27 23:58:09--  http://178.209.40.79/100mb.test
Connecting to 178.209.40.79:80... connected.
HTTP request sent, awaiting response... 200 OK
Length: 104857600 (100M) [application/octet-stream]
Saving to: `/dev/null'

100%[======================================>] 104,857,600 11.2M/s   in 11s

2011-09-27 23:58:19 (9.50 MB/s) - `/dev/null' saved [104857600/104857600]
I think this is more representative of the upload speed I was getting in general from the test VPS.
The next one is my BuyVM VPS in San Jose, CA, which is somewhat better than the test with Nix Communications, but quite low, although this could due to the relatively poor network connection they have with Europe.
wget 178.209.40.79/100mb.test -O /dev/null
--2011-09-27 23:59:00--  http://178.209.40.79/100mb.test
Connecting to 178.209.40.79:80... connected.
HTTP request sent, awaiting response... 200 OK
Length: 104857600 (100M) [application/octet-stream]
Saving to: `/dev/null'

100%[======================================>] 104,857,600 1000K/s   in 57s

2011-09-27 23:59:58 (1.74 MB/s) - `/dev/null' saved [104857600/104857600]
Finally, my QuickWeb VPS in London, UK. Although geographically much closer, it actually showed similar speed to what I have with the Bufflo VPS:
 wget 178.209.40.79/100mb.test -O /dev/null
--2011-09-28 00:01:35--  http://178.209.40.79/100mb.test
Connecting to 178.209.40.79:80... connected.
HTTP request sent, awaiting response... 200 OK
Length: 104857600 (100M) [application/octet-stream]
Saving to: `/dev/null'

100%[======================================>] 104,857,600 11.2M/s   in 9.2s

2011-09-28 00:01:44 (10.9 MB/s) - `/dev/null' saved [104857600/104857600]
With such great configuration, there was little doubt that the benchmarks would be really good. In fact, the overall UnixBench score is perhaps one of the best I have seen:
   #    #  #    #  #  #    #          #####   ######  #    #   ####   #    #
   #    #  ##   #  #   #  #           #    #  #       ##   #  #    #  #    #
   #    #  # #  #  #    ##            #####   #####   # #  #  #       ######
   #    #  #  # #  #    ##            #    #  #       #  # #  #       #    #
   #    #  #   ##  #   #  #           #    #  #       #   ##  #    #  #    #
    ####   #    #  #  #    #          #####   ######  #    #   ####   #    #

   Version 5.1.3                      Based on the Byte Magazine Unix Benchmark

   Multi-CPU version                  Version 5 revisions by Ian Smith,
                                      Sunnyvale, CA, USA
   January 13, 2011                   johantheghost at yahoo period com

1 x Dhrystone 2 using register variables  1 2 3 4 5 6 7 8 9 10

1 x Double-Precision Whetstone  1 2 3 4 5 6 7 8 9 10

1 x Execl Throughput  1 2 3

1 x File Copy 1024 bufsize 2000 maxblocks  1 2 3

1 x File Copy 256 bufsize 500 maxblocks  1 2 3

1 x File Copy 4096 bufsize 8000 maxblocks  1 2 3

1 x Pipe Throughput  1 2 3 4 5 6 7 8 9 10

1 x Pipe-based Context Switching  1 2 3 4 5 6 7 8 9 10

1 x Process Creation  1 2 3

1 x System Call Overhead  1 2 3 4 5 6 7 8 9 10

1 x Shell Scripts (1 concurrent)  1 2 3

1 x Shell Scripts (8 concurrent)  1 2 3

16 x Dhrystone 2 using register variables  1 2 3 4 5 6 7 8 9 10

16 x Double-Precision Whetstone  1 2 3 4 5 6 7 8 9 10

16 x Execl Throughput  1 2 3

16 x File Copy 1024 bufsize 2000 maxblocks  1 2 3

16 x File Copy 256 bufsize 500 maxblocks  1 2 3

16 x File Copy 4096 bufsize 8000 maxblocks  1 2 3

16 x Pipe Throughput  1 2 3 4 5 6 7 8 9 10

16 x Pipe-based Context Switching  1 2 3 4 5 6 7 8 9 10

16 x Process Creation  1 2 3

16 x System Call Overhead  1 2 3 4 5 6 7 8 9 10

16 x Shell Scripts (1 concurrent)  1 2 3

16 x Shell Scripts (8 concurrent)  1 2 3

========================================================================
   BYTE UNIX Benchmarks (Version 5.1.3)

   System: vserver20576: GNU/Linux
   OS: GNU/Linux -- 2.6.32-5-vserver-amd64 -- #1 SMP Thu May 19 00:37:17 UTC 2011
   Machine: x86_64 (unknown)
   Language: en_US.utf8 (charmap="ANSI_X3.4-1968", collate="ANSI_X3.4-1968")
   CPU 0: Intel(R) Xeon(R) CPU E5620 @ 2.40GHz (4800.3 bogomips)
          Hyper-Threading, x86-64, MMX, Physical Address Ext, SYSENTER/SYSEXIT, SYSCALL/SYSRET, Intel virtualization
   CPU 1: Intel(R) Xeon(R) CPU E5620 @ 2.40GHz (4800.2 bogomips)
          Hyper-Threading, x86-64, MMX, Physical Address Ext, SYSENTER/SYSEXIT, SYSCALL/SYSRET, Intel virtualization
   CPU 2: Intel(R) Xeon(R) CPU E5620 @ 2.40GHz (4800.2 bogomips)
          Hyper-Threading, x86-64, MMX, Physical Address Ext, SYSENTER/SYSEXIT, SYSCALL/SYSRET, Intel virtualization
   CPU 3: Intel(R) Xeon(R) CPU E5620 @ 2.40GHz (4800.2 bogomips)
          Hyper-Threading, x86-64, MMX, Physical Address Ext, SYSENTER/SYSEXIT, SYSCALL/SYSRET, Intel virtualization
   CPU 4: Intel(R) Xeon(R) CPU E5620 @ 2.40GHz (4800.2 bogomips)
          Hyper-Threading, x86-64, MMX, Physical Address Ext, SYSENTER/SYSEXIT, SYSCALL/SYSRET, Intel virtualization
   CPU 5: Intel(R) Xeon(R) CPU E5620 @ 2.40GHz (4800.2 bogomips)
          Hyper-Threading, x86-64, MMX, Physical Address Ext, SYSENTER/SYSEXIT, SYSCALL/SYSRET, Intel virtualization
   CPU 6: Intel(R) Xeon(R) CPU E5620 @ 2.40GHz (4800.2 bogomips)
          Hyper-Threading, x86-64, MMX, Physical Address Ext, SYSENTER/SYSEXIT, SYSCALL/SYSRET, Intel virtualization
   CPU 7: Intel(R) Xeon(R) CPU E5620 @ 2.40GHz (4800.2 bogomips)
          Hyper-Threading, x86-64, MMX, Physical Address Ext, SYSENTER/SYSEXIT, SYSCALL/SYSRET, Intel virtualization
   CPU 8: Intel(R) Xeon(R) CPU E5620 @ 2.40GHz (4800.2 bogomips)
          Hyper-Threading, x86-64, MMX, Physical Address Ext, SYSENTER/SYSEXIT, SYSCALL/SYSRET, Intel virtualization
   CPU 9: Intel(R) Xeon(R) CPU E5620 @ 2.40GHz (4800.2 bogomips)
          Hyper-Threading, x86-64, MMX, Physical Address Ext, SYSENTER/SYSEXIT, SYSCALL/SYSRET, Intel virtualization
   CPU 10: Intel(R) Xeon(R) CPU E5620 @ 2.40GHz (4800.2 bogomips)
          Hyper-Threading, x86-64, MMX, Physical Address Ext, SYSENTER/SYSEXIT, SYSCALL/SYSRET, Intel virtualization
   CPU 11: Intel(R) Xeon(R) CPU E5620 @ 2.40GHz (4800.2 bogomips)
          Hyper-Threading, x86-64, MMX, Physical Address Ext, SYSENTER/SYSEXIT, SYSCALL/SYSRET, Intel virtualization
   CPU 12: Intel(R) Xeon(R) CPU E5620 @ 2.40GHz (4800.2 bogomips)
          Hyper-Threading, x86-64, MMX, Physical Address Ext, SYSENTER/SYSEXIT, SYSCALL/SYSRET, Intel virtualization
   CPU 13: Intel(R) Xeon(R) CPU E5620 @ 2.40GHz (4800.2 bogomips)
          Hyper-Threading, x86-64, MMX, Physical Address Ext, SYSENTER/SYSEXIT, SYSCALL/SYSRET, Intel virtualization
   CPU 14: Intel(R) Xeon(R) CPU E5620 @ 2.40GHz (4800.2 bogomips)
          Hyper-Threading, x86-64, MMX, Physical Address Ext, SYSENTER/SYSEXIT, SYSCALL/SYSRET, Intel virtualization
   CPU 15: Intel(R) Xeon(R) CPU E5620 @ 2.40GHz (4800.2 bogomips)
          Hyper-Threading, x86-64, MMX, Physical Address Ext, SYSENTER/SYSEXIT, SYSCALL/SYSRET, Intel virtualization
   17:26:59 up 1 day,  2:38,  1 user,  load average: 2.91, 3.02, 2.90; runlevel 3

------------------------------------------------------------------------
Benchmark Run: Wed Sep 28 2011 17:26:59 - 18:20:50
16 CPUs in system; running 1 parallel copy of tests

Dhrystone 2 using register variables       12773892.2 lps   (10.0 s, 7 samples)
Double-Precision Whetstone                     2592.1 MWIPS (10.0 s, 7 samples)
Execl Throughput                               2757.6 lps   (29.5 s, 2 samples)
File Copy 1024 bufsize 2000 maxblocks        600715.8 KBps  (30.0 s, 2 samples)
File Copy 256 bufsize 500 maxblocks          200143.2 KBps  (30.0 s, 2 samples)
File Copy 4096 bufsize 8000 maxblocks       1024865.8 KBps  (30.0 s, 2 samples)
Pipe Throughput                             1064814.6 lps   (10.0 s, 7 samples)
Pipe-based Context Switching                 130135.8 lps   (10.0 s, 7 samples)
Process Creation                               8455.3 lps   (30.0 s, 2 samples)
Shell Scripts (1 concurrent)                   4816.4 lpm   (60.0 s, 2 samples)
Shell Scripts (8 concurrent)                   1951.5 lpm   (60.0 s, 2 samples)
System Call Overhead                         873163.6 lps   (10.0 s, 7 samples)

System Benchmarks Index Values               BASELINE       RESULT    INDEX
Dhrystone 2 using register variables         116700.0   12773892.2   1094.6
Double-Precision Whetstone                       55.0       2592.1    471.3
Execl Throughput                                 43.0       2757.6    641.3
File Copy 1024 bufsize 2000 maxblocks          3960.0     600715.8   1517.0
File Copy 256 bufsize 500 maxblocks            1655.0     200143.2   1209.3
File Copy 4096 bufsize 8000 maxblocks          5800.0    1024865.8   1767.0
Pipe Throughput                               12440.0    1064814.6    856.0
Pipe-based Context Switching                   4000.0     130135.8    325.3
Process Creation                                126.0       8455.3    671.1
Shell Scripts (1 concurrent)                     42.4       4816.4   1136.0
Shell Scripts (8 concurrent)                      6.0       1951.5   3252.5
System Call Overhead                          15000.0     873163.6    582.1
                                                                   ========
System Benchmarks Index Score                                         932.3

------------------------------------------------------------------------
Benchmark Run: Wed Sep 28 2011 18:20:50 - 20:48:43
16 CPUs in system; running 16 parallel copies of tests

Dhrystone 2 using register variables      107983337.5 lps   (10.0 s, 7 samples)
Double-Precision Whetstone                    35748.0 MWIPS (10.2 s, 7 samples)
Execl Throughput                              31657.7 lps   (29.8 s, 2 samples)
File Copy 1024 bufsize 2000 maxblocks       4658247.4 KBps  (30.0 s, 2 samples)
File Copy 256 bufsize 500 maxblocks         1313620.1 KBps  (30.0 s, 2 samples)
File Copy 4096 bufsize 8000 maxblocks      11525786.5 KBps  (30.0 s, 2 samples)
Pipe Throughput                            10203409.2 lps   (10.0 s, 7 samples)
Pipe-based Context Switching                1032198.6 lps   (10.0 s, 7 samples)
Process Creation                              73403.8 lps   (30.0 s, 2 samples)
Shell Scripts (1 concurrent)                  10990.8 lpm   (60.0 s, 2 samples)
Shell Scripts (8 concurrent)                   2289.9 lpm   (60.1 s, 2 samples)
System Call Overhead                        5006513.7 lps   (10.0 s, 7 samples)

System Benchmarks Index Values               BASELINE       RESULT    INDEX
Dhrystone 2 using register variables         116700.0  107983337.5   9253.1
Double-Precision Whetstone                       55.0      35748.0   6499.6
Execl Throughput                                 43.0      31657.7   7362.3
File Copy 1024 bufsize 2000 maxblocks          3960.0    4658247.4  11763.3
File Copy 256 bufsize 500 maxblocks            1655.0    1313620.1   7937.3
File Copy 4096 bufsize 8000 maxblocks          5800.0   11525786.5  19872.0
Pipe Throughput                               12440.0   10203409.2   8202.1
Pipe-based Context Switching                   4000.0    1032198.6   2580.5
Process Creation                                126.0      73403.8   5825.7
Shell Scripts (1 concurrent)                     42.4      10990.8   2592.2
Shell Scripts (8 concurrent)                      6.0       2289.9   3816.4
System Call Overhead                          15000.0    5006513.7   3337.7
                                                                   ========
System Benchmarks Index Score                                        6218.7
And test again:
   #    #  #    #  #  #    #          #####   ######  #    #   ####   #    #
   #    #  ##   #  #   #  #           #    #  #       ##   #  #    #  #    #
   #    #  # #  #  #    ##            #####   #####   # #  #  #       ######
   #    #  #  # #  #    ##            #    #  #       #  # #  #       #    #
   #    #  #   ##  #   #  #           #    #  #       #   ##  #    #  #    #
    ####   #    #  #  #    #          #####   ######  #    #   ####   #    #

   Version 5.1.3                      Based on the Byte Magazine Unix Benchmark

   Multi-CPU version                  Version 5 revisions by Ian Smith,
                                      Sunnyvale, CA, USA
   January 13, 2011                   johantheghost at yahoo period com

1 x Dhrystone 2 using register variables  1 2 3 4 5 6 7 8 9 10

1 x Double-Precision Whetstone  1 2 3 4 5 6 7 8 9 10

1 x Execl Throughput  1 2 3

1 x File Copy 1024 bufsize 2000 maxblocks  1 2 3

1 x File Copy 256 bufsize 500 maxblocks  1 2 3

1 x File Copy 4096 bufsize 8000 maxblocks  1 2 3

1 x Pipe Throughput  1 2 3 4 5 6 7 8 9 10

1 x Pipe-based Context Switching  1 2 3 4 5 6 7 8 9 10

1 x Process Creation  1 2 3

1 x System Call Overhead  1 2 3 4 5 6 7 8 9 10

1 x Shell Scripts (1 concurrent)  1 2 3

1 x Shell Scripts (8 concurrent)  1 2 3

16 x Dhrystone 2 using register variables  1 2 3 4 5 6 7 8 9 10

16 x Double-Precision Whetstone  1 2 3 4 5 6 7 8 9 10

16 x Execl Throughput  1 2 3

16 x File Copy 1024 bufsize 2000 maxblocks  1 2 3

16 x File Copy 256 bufsize 500 maxblocks  1   2 3

16 x File Copy 4096 bufsize 8000 maxblocks  1  2 3

16 x Pipe Throughput  1 2 3 4 5 6 7 8 9 10

16 x Pipe-based Context Switching  1 2 3 4 5 6 7 8 9 10

16 x Process Creation  1 2 3

16 x System Call Overhead  1 2 3 4 5 6 7 8 9 10

16 x Shell Scripts (1 concurrent)  1 2 3

16 x Shell Scripts (8 concurrent)  1 2 3

========================================================================
   BYTE UNIX Benchmarks (Version 5.1.3)

   System: vserver20576: GNU/Linux
   OS: GNU/Linux -- 2.6.32-5-vserver-amd64 -- #1 SMP Thu May 19 00:37:17 UTC 2011
   Machine: x86_64 (unknown)
   Language: en_US.utf8 (charmap="ANSI_X3.4-1968", collate="ANSI_X3.4-1968")
   CPU 0: Intel(R) Xeon(R) CPU E5620 @ 2.40GHz (4800.3 bogomips)
          Hyper-Threading, x86-64, MMX, Physical Address Ext, SYSENTER/SYSEXIT, SYSCALL/SYSRET, Intel virtualization
   CPU 1: Intel(R) Xeon(R) CPU E5620 @ 2.40GHz (4800.2 bogomips)
          Hyper-Threading, x86-64, MMX, Physical Address Ext, SYSENTER/SYSEXIT, SYSCALL/SYSRET, Intel virtualization
   CPU 2: Intel(R) Xeon(R) CPU E5620 @ 2.40GHz (4800.2 bogomips)
          Hyper-Threading, x86-64, MMX, Physical Address Ext, SYSENTER/SYSEXIT, SYSCALL/SYSRET, Intel virtualization
   CPU 3: Intel(R) Xeon(R) CPU E5620 @ 2.40GHz (4800.2 bogomips)
          Hyper-Threading, x86-64, MMX, Physical Address Ext, SYSENTER/SYSEXIT, SYSCALL/SYSRET, Intel virtualization
   CPU 4: Intel(R) Xeon(R) CPU E5620 @ 2.40GHz (4800.2 bogomips)
          Hyper-Threading, x86-64, MMX, Physical Address Ext, SYSENTER/SYSEXIT, SYSCALL/SYSRET, Intel virtualization
   CPU 5: Intel(R) Xeon(R) CPU E5620 @ 2.40GHz (4800.2 bogomips)
          Hyper-Threading, x86-64, MMX, Physical Address Ext, SYSENTER/SYSEXIT, SYSCALL/SYSRET, Intel virtualization
   CPU 6: Intel(R) Xeon(R) CPU E5620 @ 2.40GHz (4800.2 bogomips)
          Hyper-Threading, x86-64, MMX, Physical Address Ext, SYSENTER/SYSEXIT, SYSCALL/SYSRET, Intel virtualization
   CPU 7: Intel(R) Xeon(R) CPU E5620 @ 2.40GHz (4800.2 bogomips)
          Hyper-Threading, x86-64, MMX, Physical Address Ext, SYSENTER/SYSEXIT, SYSCALL/SYSRET, Intel virtualization
   CPU 8: Intel(R) Xeon(R) CPU E5620 @ 2.40GHz (4800.2 bogomips)
          Hyper-Threading, x86-64, MMX, Physical Address Ext, SYSENTER/SYSEXIT, SYSCALL/SYSRET, Intel virtualization
   CPU 9: Intel(R) Xeon(R) CPU E5620 @ 2.40GHz (4800.2 bogomips)
          Hyper-Threading, x86-64, MMX, Physical Address Ext, SYSENTER/SYSEXIT, SYSCALL/SYSRET, Intel virtualization
   CPU 10: Intel(R) Xeon(R) CPU E5620 @ 2.40GHz (4800.2 bogomips)
          Hyper-Threading, x86-64, MMX, Physical Address Ext, SYSENTER/SYSEXIT, SYSCALL/SYSRET, Intel virtualization
   CPU 11: Intel(R) Xeon(R) CPU E5620 @ 2.40GHz (4800.2 bogomips)
          Hyper-Threading, x86-64, MMX, Physical Address Ext, SYSENTER/SYSEXIT, SYSCALL/SYSRET, Intel virtualization
   CPU 12: Intel(R) Xeon(R) CPU E5620 @ 2.40GHz (4800.2 bogomips)
          Hyper-Threading, x86-64, MMX, Physical Address Ext, SYSENTER/SYSEXIT, SYSCALL/SYSRET, Intel virtualization
   CPU 13: Intel(R) Xeon(R) CPU E5620 @ 2.40GHz (4800.2 bogomips)
          Hyper-Threading, x86-64, MMX, Physical Address Ext, SYSENTER/SYSEXIT, SYSCALL/SYSRET, Intel virtualization
   CPU 14: Intel(R) Xeon(R) CPU E5620 @ 2.40GHz (4800.2 bogomips)
          Hyper-Threading, x86-64, MMX, Physical Address Ext, SYSENTER/SYSEXIT, SYSCALL/SYSRET, Intel virtualization
   CPU 15: Intel(R) Xeon(R) CPU E5620 @ 2.40GHz (4800.2 bogomips)
          Hyper-Threading, x86-64, MMX, Physical Address Ext, SYSENTER/SYSEXIT, SYSCALL/SYSRET, Intel virtualization
   07:37:13 up 16:48,  1 user,  load average: 3.24, 3.25, 4.26; runlevel 3

------------------------------------------------------------------------
Benchmark Run: Wed Sep 28 2011 07:37:13 - 08:51:11
16 CPUs in system; running 1 parallel copy of tests

Dhrystone 2 using register variables       13011158.2 lps   (10.0 s, 7 samples)
Double-Precision Whetstone                     2574.4 MWIPS (9.9 s, 7 samples)
Execl Throughput                               2981.0 lps   (29.5 s, 2 samples)
File Copy 1024 bufsize 2000 maxblocks        550126.4 KBps  (30.0 s, 2 samples)
File Copy 256 bufsize 500 maxblocks          199279.2 KBps  (30.0 s, 2 samples)
File Copy 4096 bufsize 8000 maxblocks       1208687.2 KBps  (30.0 s, 2 samples)
Pipe Throughput                             1087439.6 lps   (10.0 s, 7 samples)
Pipe-based Context Switching                 128031.2 lps   (10.0 s, 7 samples)
Process Creation                               7905.0 lps   (30.0 s, 2 samples)
Shell Scripts (1 concurrent)                   4529.7 lpm   (60.0 s, 2 samples)
Shell Scripts (8 concurrent)                   1664.4 lpm   (60.0 s, 2 samples)
System Call Overhead                         873844.1 lps   (10.0 s, 7 samples)

System Benchmarks Index Values               BASELINE       RESULT    INDEX
Dhrystone 2 using register variables         116700.0   13011158.2   1114.9
Double-Precision Whetstone                       55.0       2574.4    468.1
Execl Throughput                                 43.0       2981.0    693.3
File Copy 1024 bufsize 2000 maxblocks          3960.0     550126.4   1389.2
File Copy 256 bufsize 500 maxblocks            1655.0     199279.2   1204.1
File Copy 4096 bufsize 8000 maxblocks          5800.0    1208687.2   2083.9
Pipe Throughput                               12440.0    1087439.6    874.1
Pipe-based Context Switching                   4000.0     128031.2    320.1
Process Creation                                126.0       7905.0    627.4
Shell Scripts (1 concurrent)                     42.4       4529.7   1068.3
Shell Scripts (8 concurrent)                      6.0       1664.4   2773.9
System Call Overhead                          15000.0     873844.1    582.6
                                                                   ========
System Benchmarks Index Score                                         923.0

------------------------------------------------------------------------
Benchmark Run: Wed Sep 28 2011 08:51:11 - 11:33:48
16 CPUs in system; running 16 parallel copies of tests

Dhrystone 2 using register variables       99314087.5 lps   (10.0 s, 7 samples)
Double-Precision Whetstone                    35761.5 MWIPS (10.2 s, 7 samples)
Execl Throughput                              27856.4 lps   (29.7 s, 2 samples)
File Copy 1024 bufsize 2000 maxblocks       5264319.4 KBps  (30.0 s, 2 samples)
File Copy 256 bufsize 500 maxblocks         1624317.1 KBps  (30.0 s, 2 samples)
File Copy 4096 bufsize 8000 maxblocks      10485810.9 KBps  (30.0 s, 2 samples)
Pipe Throughput                             9182946.2 lps   (10.0 s, 7 samples)
Pipe-based Context Switching                1117143.7 lps   (10.0 s, 7 samples)
Process Creation                              55056.4 lps   (30.0 s, 2 samples)
Shell Scripts (1 concurrent)                  15613.7 lpm   (60.0 s, 2 samples)
Shell Scripts (8 concurrent)                   2452.3 lpm   (60.3 s, 2 samples)
System Call Overhead                        4509758.7 lps   (10.0 s, 7 samples)

System Benchmarks Index Values               BASELINE       RESULT    INDEX
Dhrystone 2 using register variables         116700.0   99314087.5   8510.2
Double-Precision Whetstone                       55.0      35761.5   6502.1
Execl Throughput                                 43.0      27856.4   6478.2
File Copy 1024 bufsize 2000 maxblocks          3960.0    5264319.4  13293.7
File Copy 256 bufsize 500 maxblocks            1655.0    1624317.1   9814.6
File Copy 4096 bufsize 8000 maxblocks          5800.0   10485810.9  18079.0
Pipe Throughput                               12440.0    9182946.2   7381.8
Pipe-based Context Switching                   4000.0    1117143.7   2792.9
Process Creation                                126.0      55056.4   4369.6
Shell Scripts (1 concurrent)                     42.4      15613.7   3682.5
Shell Scripts (8 concurrent)                      6.0       2452.3   4087.1
System Call Overhead                          15000.0    4509758.7   3006.5
                                                                   ========
System Benchmarks Index Score                                        6234.2
For the GeekBench, I encountered the same issue as before when running v2.2:
System Information
  Operating System      Linux 2.6.32-5-vserver-amd64 x86_64
  Model                 N/A
  Motherboard           N/A
  Processor             Intel(R) Xeon(R) CPU           E5620  @ 2.40GHz @ 0.00 Hz
                        2 Processors, 4 Cores, 16 Threads
  Processor ID          GenuineIntel Family 6 Model 44 Stepping 2
  L1 Instruction Cache  32.0 KB x 4
  L1 Data Cache         32.0 KB x 4
  L2 Cache              256 KB x 4
  L3 Cache              12.0 MB
  Memory                256 MB N/A
  BIOS                  N/A

Integer
  Blowfish
    single-threaded scalar   2011 ||||||||
    multi-threaded scalar   18854 ||||||||||||||||||||||||||||||||||||||||
  Text Compress
    single-threaded scalar   1903 |||||||
    multi-threaded scalar   14409 ||||||||||||||||||||||||||||||||||||||||
  Text Decompress
    single-threaded scalar   2154 ||||||||
    multi-threaded scalar   16077 ||||||||||||||||||||||||||||||||||||||||
  Image Compress
    single-threaded scalar   1926 |||||||
    multi-threaded scalar   12990 ||||||||||||||||||||||||||||||||||||||||
  Image Decompress
    single-threaded scalar   1757 |||||||
    multi-threaded scalar    9150 ||||||||||||||||||||||||||||||||||||
  Lua
    single-threaded scalar   3552 ||||||||||||||
    multi-threaded scalar   17969 ||||||||||||||||||||||||||||||||||||||||

Floating Point
  Mandelbrot
    single-threaded scalar   2127 ||||||||
    multi-threaded scalar   18886 ||||||||||||||||||||||||||||||||||||||||
  Dot Product
    single-threaded scalar   3507 ||||||||||||||
    multi-threaded scalar   22311 ||||||||||||||||||||||||||||||||||||||||
    single-threaded vector   3359 |||||||||||||
    multi-threaded vector   20192 ||||||||||||||||||||||||||||||||||||||||
  LU Decomposition
    single-threaded scalar   2394 |||||||||
    multi-threaded scalar    6994 |||||||||||||||||||||||||||
  Primality Test
    single-threaded scalar   3255 |||||||||||||
    multi-threaded scalar   23148 ||||||||||||||||||||||||||||||||||||||||
  Sharpen Image
    single-threaded scalar   8423 |||||||||||||||||||||||||||||||||
    multi-threaded scalar   47315 ||||||||||||||||||||||||||||||||||||||||
  Blur Image
    single-threaded scalar   8707 ||||||||||||||||||||||||||||||||||
    multi-threaded scalar   57136 ||||||||||||||||||||||||||||||||||||||||

Memory
Killed
However, you can see the some of the sub-scores are really impressive.
Here is the test again using v2.2:
System Information
  Operating System      Linux 2.6.32-5-vserver-amd64 x86_64
  Model                 N/A
  Motherboard           N/A
  Processor             Intel(R) Xeon(R) CPU           E5620  @ 2.40GHz @ 0.00 Hz
                        2 Processors, 4 Cores, 16 Threads
  Processor ID          GenuineIntel Family 6 Model 44 Stepping 2
  L1 Instruction Cache  32.0 KB x 4
  L1 Data Cache         32.0 KB x 4
  L2 Cache              256 KB x 4
  L3 Cache              12.0 MB
  Memory                256 MB N/A
  BIOS                  N/A

Integer
  Blowfish
    single-threaded scalar   2021 ||||||||
    multi-threaded scalar   19547 ||||||||||||||||||||||||||||||||||||||||
  Text Compress
    single-threaded scalar   1940 |||||||
    multi-threaded scalar   14976 ||||||||||||||||||||||||||||||||||||||||
  Text Decompress
    single-threaded scalar   2179 ||||||||
    multi-threaded scalar   16335 ||||||||||||||||||||||||||||||||||||||||
  Image Compress
    single-threaded scalar   1859 |||||||
    multi-threaded scalar   13005 ||||||||||||||||||||||||||||||||||||||||
  Image Decompress
    single-threaded scalar   1785 |||||||
    multi-threaded scalar    9112 ||||||||||||||||||||||||||||||||||||
  Lua
    single-threaded scalar   3569 ||||||||||||||
    multi-threaded scalar   19054 ||||||||||||||||||||||||||||||||||||||||

Floating Point
  Mandelbrot
    single-threaded scalar   2133 ||||||||
    multi-threaded scalar   19261 ||||||||||||||||||||||||||||||||||||||||
  Dot Product
    single-threaded scalar   3482 |||||||||||||
    multi-threaded scalar   21648 ||||||||||||||||||||||||||||||||||||||||
    single-threaded vector   3378 |||||||||||||
    multi-threaded vector   19763 ||||||||||||||||||||||||||||||||||||||||
  LU Decomposition
    single-threaded scalar   2358 |||||||||
    multi-threaded scalar    6180 ||||||||||||||||||||||||
  Primality Test
    single-threaded scalar   3163 ||||||||||||
    multi-threaded scalar   20955 ||||||||||||||||||||||||||||||||||||||||
  Sharpen Image
    single-threaded scalar   8477 |||||||||||||||||||||||||||||||||
    multi-threaded scalar   45269 ||||||||||||||||||||||||||||||||||||||||
  Blur Image
    single-threaded scalar   8796 |||||||||||||||||||||||||||||||||||
    multi-threaded scalar   58571 ||||||||||||||||||||||||||||||||||||||||

Memory
Killed
GeekBench v2.1 did run properly though:
System Information
  Platform:                  Linux x86 (32-bit)
  Compiler:                  GCC 4.1.2 20070925 (Red Hat 4.1.2-33)
  Operating System:          Linux 2.6.32-5-vserver-amd64 x86_64
  Model:                     Linux PC (Intel(R) Xeon(R) CPU           E5620  @ 2.40GHz)
  Motherboard:               Unknown Motherboard
  Processor:                 Intel(R) Xeon(R) CPU           E5620  @ 2.40GHz
  Processor ID:              GenuineIntel Family 6 Model 44 Stepping 2
  Logical Processors:        16
  Physical Processors:       2
  Processor Frequency:       2.40 GHz
  L1 Instruction Cache:      0.00 B
  L1 Data Cache:             0.00 B
  L2 Cache:                  256 KB
  L3 Cache:                  0.00 B
  Bus Frequency:             0.00 Hz
  Memory:                    256 MB
  Memory Type:               N/A
  SIMD:                      1
  BIOS:                      N/A
  Processor Model:           Intel(R) Xeon(R) CPU           E5620  @ 2.40GHz
  Processor Cores:           16

Integer
  Blowfish
    single-threaded scalar    1753 |||||||
    multi-threaded scalar    16598 ||||||||||||||||||||||||||||||||||||||||||||||||||||||||||||||||||
  Text Compress
    single-threaded scalar    1936 |||||||
    multi-threaded scalar    13485 |||||||||||||||||||||||||||||||||||||||||||||||||||||
  Text Decompress
    single-threaded scalar    1964 |||||||
    multi-threaded scalar    15988 |||||||||||||||||||||||||||||||||||||||||||||||||||||||||||||||
  Image Compress
    single-threaded scalar    1657 ||||||
    multi-threaded scalar    12118 ||||||||||||||||||||||||||||||||||||||||||||||||
  Image Decompress
    single-threaded scalar    1582 ||||||
    multi-threaded scalar     9241 ||||||||||||||||||||||||||||||||||||
  Lua
    single-threaded scalar    2994 |||||||||||
    multi-threaded scalar    18042 ||||||||||||||||||||||||||||||||||||||||||||||||||||||||||||||||||||||||

Floating Point
  Mandelbrot
    single-threaded scalar    2103 ||||||||
    multi-threaded scalar    18928 |||||||||||||||||||||||||||||||||||||||||||||||||||||||||||||||||||||||||||
  Dot Product
    single-threaded scalar    3444 |||||||||||||
    multi-threaded scalar    21640 ||||||||||||||||||||||||||||||||||||||||||||||||||||||||||||||||||||||||||||||||||||||
    single-threaded vector    4100 ||||||||||||||||
    multi-threaded vector    24727 ||||||||||||||||||||||||||||||||||||||||||||||||||||||||||||||||||||||||||||||||||||||||||||||||||
  LU Decomposition
    single-threaded scalar    2537 ||||||||||
    multi-threaded scalar    12579 ||||||||||||||||||||||||||||||||||||||||||||||||||
  Primality Test
    single-threaded scalar    3415 |||||||||||||
    multi-threaded scalar    21998 |||||||||||||||||||||||||||||||||||||||||||||||||||||||||||||||||||||||||||||||||||||||
  Sharpen Image
    single-threaded scalar    5790 |||||||||||||||||||||||
    multi-threaded scalar    32833 |||||||||||||||||||||||||||||||||||||||||||||||||||||||||||||||||||||||||||||||||||||||||||||||||||||||||||||||||||||||||||||||||||
  Blur Image
    single-threaded scalar    5318 |||||||||||||||||||||
    multi-threaded scalar    34153 ||||||||||||||||||||||||||||||||||||||||||||||||||||||||||||||||||||||||||||||||||||||||||||||||||||||||||||||||||||||||||||||||||||||||

Memory
  Read Sequential
    single-threaded scalar    3026 ||||||||||||
  Write Sequential
    single-threaded scalar    3855 |||||||||||||||
  Stdlib Allocate
    single-threaded scalar    3847 |||||||||||||||
  Stdlib Write
    single-threaded scalar    2571 ||||||||||
  Stdlib Copy
    single-threaded scalar    4335 |||||||||||||||||

Stream
  Stream Copy
    single-threaded scalar    2119 ||||||||
    single-threaded vector    2426 |||||||||
  Stream Scale
    single-threaded scalar    2241 ||||||||
    single-threaded vector    2675 ||||||||||
  Stream Add
    single-threaded scalar    2150 ||||||||
    single-threaded vector    2768 |||||||||||
  Stream Triad
    single-threaded scalar    2966 |||||||||||
    single-threaded vector    2135 ||||||||

Integer Score:                8113 ||||||||||||||||||||||||||||||||
Floating Point Score:        13826 |||||||||||||||||||||||||||||||||||||||||||||||||||||||
Memory Score:                 3526 ||||||||||||||
Stream Score:                 2435 |||||||||

Overall Geekbench Score:      8627 ||||||||||||||||||||||||||||||||||
As you can see, particularly in the image tests, the subscores are really high.
And test again:
System Information
  Platform:                  Linux x86 (32-bit)
  Compiler:                  GCC 4.1.2 20070925 (Red Hat 4.1.2-33)
  Operating System:          Linux 2.6.32-5-vserver-amd64 x86_64
  Model:                     Linux PC (Intel(R) Xeon(R) CPU           E5620  @ 2.40GHz)
  Motherboard:               Unknown Motherboard
  Processor:                 Intel(R) Xeon(R) CPU           E5620  @ 2.40GHz
  Processor ID:              GenuineIntel Family 6 Model 44 Stepping 2
  Logical Processors:        16
  Physical Processors:       2
  Processor Frequency:       2.40 GHz
  L1 Instruction Cache:      0.00 B
  L1 Data Cache:             0.00 B
  L2 Cache:                  256 KB
  L3 Cache:                  0.00 B
  Bus Frequency:             0.00 Hz
  Memory:                    256 MB
  Memory Type:               N/A
  SIMD:                      1
  BIOS:                      N/A
  Processor Model:           Intel(R) Xeon(R) CPU           E5620  @ 2.40GHz
  Processor Cores:           16

Integer
  Blowfish
    single-threaded scalar    1776 |||||||
    multi-threaded scalar    16494 |||||||||||||||||||||||||||||||||||||||||||||||||||||||||||||||||
  Text Compress
    single-threaded scalar    1935 |||||||
    multi-threaded scalar    13390 |||||||||||||||||||||||||||||||||||||||||||||||||||||
  Text Decompress
    single-threaded scalar    1968 |||||||
    multi-threaded scalar    15306 |||||||||||||||||||||||||||||||||||||||||||||||||||||||||||||
  Image Compress
    single-threaded scalar    1576 ||||||
    multi-threaded scalar    12211 ||||||||||||||||||||||||||||||||||||||||||||||||
  Image Decompress
    single-threaded scalar    1537 ||||||
    multi-threaded scalar     8846 |||||||||||||||||||||||||||||||||||
  Lua
    single-threaded scalar    3147 ||||||||||||
    multi-threaded scalar    16248 ||||||||||||||||||||||||||||||||||||||||||||||||||||||||||||||||

Floating Point
  Mandelbrot
    single-threaded scalar    1968 |||||||
    multi-threaded scalar    19967 |||||||||||||||||||||||||||||||||||||||||||||||||||||||||||||||||||||||||||||||
  Dot Product
    single-threaded scalar    3470 |||||||||||||
    multi-threaded scalar    22218 ||||||||||||||||||||||||||||||||||||||||||||||||||||||||||||||||||||||||||||||||||||||||
    single-threaded vector    4109 ||||||||||||||||
    multi-threaded vector    24220 ||||||||||||||||||||||||||||||||||||||||||||||||||||||||||||||||||||||||||||||||||||||||||||||||
  LU Decomposition
    single-threaded scalar    2335 |||||||||
    multi-threaded scalar    10568 ||||||||||||||||||||||||||||||||||||||||||
  Primality Test
    single-threaded scalar    3415 |||||||||||||
    multi-threaded scalar    22091 ||||||||||||||||||||||||||||||||||||||||||||||||||||||||||||||||||||||||||||||||||||||||
  Sharpen Image
    single-threaded scalar    5846 |||||||||||||||||||||||
    multi-threaded scalar    31004 ||||||||||||||||||||||||||||||||||||||||||||||||||||||||||||||||||||||||||||||||||||||||||||||||||||||||||||||||||||||||||||
  Blur Image
    single-threaded scalar    5336 |||||||||||||||||||||
    multi-threaded scalar    34706 ||||||||||||||||||||||||||||||||||||||||||||||||||||||||||||||||||||||||||||||||||||||||||||||||||||||||||||||||||||||||||||||||||||||||||

Memory
  Read Sequential
    single-threaded scalar    3814 |||||||||||||||
  Write Sequential
    single-threaded scalar    4889 |||||||||||||||||||
  Stdlib Allocate
    single-threaded scalar    2446 |||||||||
  Stdlib Write
    single-threaded scalar    2463 |||||||||
  Stdlib Copy
    single-threaded scalar    4890 |||||||||||||||||||

Stream
  Stream Copy
    single-threaded scalar    2557 ||||||||||
    single-threaded vector    3490 |||||||||||||
  Stream Scale
    single-threaded scalar    2483 |||||||||
    single-threaded vector    2851 |||||||||||
  Stream Add
    single-threaded scalar    2690 ||||||||||
    single-threaded vector    3078 ||||||||||||
  Stream Triad
    single-threaded scalar    2704 ||||||||||
    single-threaded vector    2346 |||||||||

Integer Score:                7869 |||||||||||||||||||||||||||||||
Floating Point Score:        13660 ||||||||||||||||||||||||||||||||||||||||||||||||||||||
Memory Score:                 3700 ||||||||||||||
Stream Score:                 2774 |||||||||||

Overall Geekbench Score:      8552 ||||||||||||||||||||||||||||||||||
Note that EDIS seems to have implemented some sort of mechanism to automatically stop those who use too much system resources. Although it was a little painful for me when running the benchmarks, I think it overall it would ensure you, as a VPS user, always have “friendly” neighbours.
Customer Service and Support
Since the control panel is currently working in progress, I believe the support system, as part of the overall control panel, is working in progress as well. Therefore, there are only two means you can contact EDIS at the moment, either by email or by phone. I have not tried to contact them by phone since I am physically far far away from them. For their email support though, everything seems to be pretty good, an email sent to them for a technical support question on a Thursday morning at 11:05AM was responded by 12:02PM, about an hour later and one of my billing questions sent at 10:21PM was responded by 2:42AM the next day, considering it was in the middle of the night in Europe when I emailed, it is actually not bad at all.
Conclusion
I remember once there was a VPS provider who has told me there are two different “schools” of philosophy when running a budget VPS business. One is that the users are supposed to get the least possible amount of resources possible, since that is the quickest way of making money and also since the customer should just get what they pay. On the other hand, there are also providers who would just throw in lots of resources, so that clients get things done quickly and together with a high level of monitoring, would actually ensure the system resources gets used by a single client in the least amount of time possible. I am very glad that EDIS has chosen the second path. Although not perfect (for example, their control panel is still not fully completed, hard drive space offered is really tiny and the billing process could be confusing sometimes), I have to say the VPS that they have provided is pretty solid. Regardless of whether it is disk I/O, benchmarks or network, EDIS has definitely one of the best results I have seen. Therefore, I would highly recommend them to those who would need a powerful but yet stable VPS to run tasks which does not take too much hard drive space.
Hello!
The space you are/were on is normal RAID10 SAS – not SSD 😉
The Kernel shows x86_64 because of the hostsystem, and the “high load” is not high since vServer does not show load per VPS but load for the whole node.
And the process killed was one of my coworkers here in the office – we would never kill some process automatically.
Greetings
William
@William: Post updated to reflect it is on SAS, thanks for your clarification on other ones 🙂
Hi!
and THANK YOU for reviewing our products 😉
Cheers,
Gerhard
@ExPI0ReR: No worries, and thanks for providing great VPS services!
“although I am not too sure what the 5120MB in my welcome email represent”. It represented the amount of HD storage you were getting, hence the “RAM / storage” before the two numbers.
@dan: Silly me, or I guess I am just not used to the idea of having 5120MB as the size of the HDD, 🙂
I actually just finished setting up vserver (just for fun ;-)), and by default (just using vserver kernel patch) /proc/cpuinfo inside vserver will always show you the host /proc/cpuinfo (all cores) even though you have already limit it (via cgroups).
I’m not so sure about this though, at least that what I got from asking around vserver irc channel, so CMIIW.