
96MB Low End VPS Review Part XXXI – QualityServers Xen Blowout
It is again another lazy weekend, I know I know, I am back to school now, and with work piling up (never thought a graduate degree would be more demanding than a undergraduate one!), I really should study day and night and should spend more time in the library. However, for anyone who have been working for a few years, you know how difficult it is to give up a lazy weekend and do something you really want to do (in my case, writing on 96MB.com!). Therefore, when I was contacted by a member of LowEndTalk asking me to do a review on one of the QualityServers VPS that he bought recently, I used that as an excuse (don’t like to borrow things from others for long!) and decided to put in another review for the week.
Disclosure: The member on LET has offered me a logo design for 96MB.com as a token of appreciation. Although he has told me he won’t be “offended” if I do not use it, but I figure I should try to avoid of getting myself into more trouble. I will get it applied to 96MB once I get a chance to rest my fingers. Do note, however, I have independently collected all the data and even reloaded OS from the SolusVM to make sure the data are as accurate as possible.
General Information and Set Up
I have not received a confirmation to release the LET member’s name or even his LET user name, so I guess I will just address him as Mr. A for now. In any case, Mr. A saw this great offer on LET and for 25 GBP a year, you get the following:

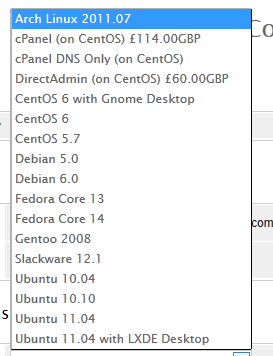
There are quite a few OS distributions you can choose from during sign up:
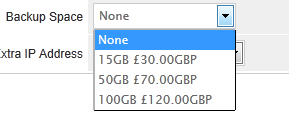
Backup space is definitely not cheap though, so you may want to think twice before getting more:
Although IP address is pretty standard price at 12GBP per year.
So Mr. A signed up for the deal and since he offered me access to his VPS, WHMCS system and SolusVM Control Panel for a short period of time, I was able to see and confirm a few things. For one, the provision was instant and the VPS login details was sent the moment payment was completed:

The welcome email was sent with root password in plain text and SolusVM on a non-standard HTTPS port with assigned user name. However, what makes it different is the number of IP addresses you get:
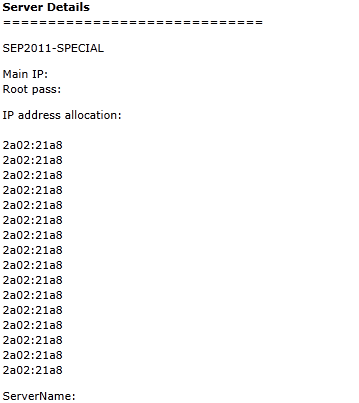
As you can see, there are 1 main IP (IPv4 IP and 16 IPv6 IPs), which is quite a few, although given the fact that IPv6 are basically for free these days, I guess it is really the time invested on doing all these custom scripting that are worth more than IP addresses themselves.
Once logged into their WHMCS, I was hoping to see the controls and statistics of my VPS under My Service, however, here is what I see when I clicked there:

I guess QualityServers has really tried hard to save the processing power of their main node.
After logged into the SolusVM control panel using HTTPS connection on non-standard port, a pretty standard interface of SolusVM shows:
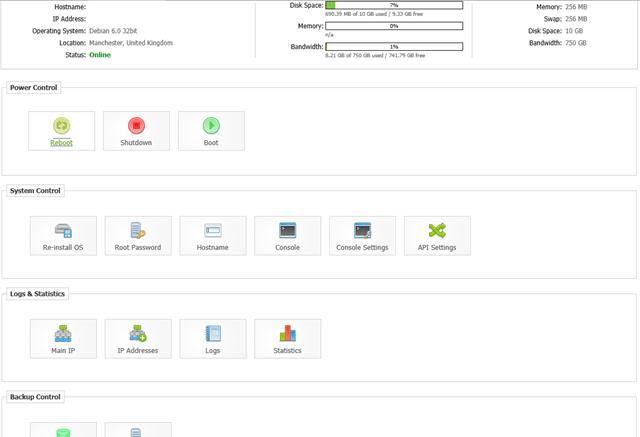
As usual, none of the backup methods are available, however, instant rDNS is available, for both IPV4 and IPV6, which is rather great:
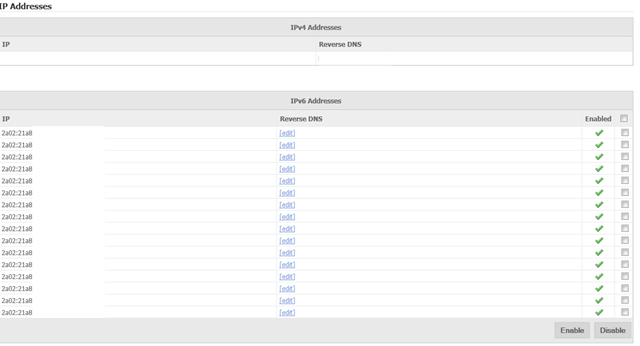
And the instant rDNS for IPv6 appears to be working as well:

There are quite a few OS templates available, covering many of the CentOS-based templates, as well as Debian 5 and 6 (both 32 and 64 bit OS templates), among others:
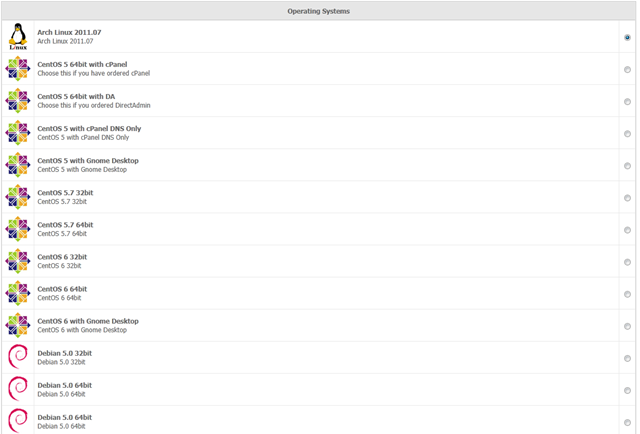
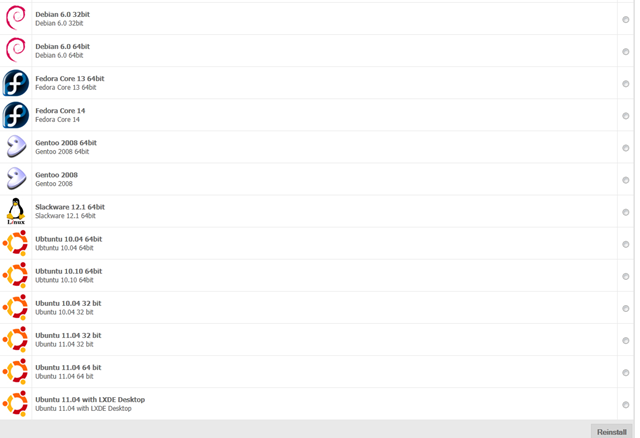
However, one thing I have noticed is that it took unusually long for the OS template to be reinstalled. I had to wait for almost a full 5 minutes before the OS templates are reloaded and the VPS is boot up so that I can SSH into the box.
Test on the VPS
As mentioned above, the VPS package has 256MB of dedicated RAM and 256MB of SWAP, and 10GB of hard drive space, and I used Debian 6 32 bit for the testing purposes. The OS was reloaded before I run all these tests to make sure everything is clean and there is no issue with the set up.
After the fresh reload of the OS template, the VPS used only 10MB of memory:
free -m
             total       used       free     shared    buffers     cached
Mem:           247         21        225          0          0         10
-/+ buffers/cache:         10        237
Swap:          255          0        255
The corresponding top output shows the processes running:
top - 04:21:56 up 28 min,  1 user,  load average: 0.06, 0.03, 0.00
Tasks:  70 total,   1 running,  69 sleeping,   0 stopped,   0 zombie
Cpu(s):  0.0%us,  0.0%sy,  0.0%ni,100.0%id,  0.0%wa,  0.0%hi,  0.0%si,  0.0%st
Mem:    253692k total,    22548k used,   231144k free,      984k buffers
Swap:   262136k total,        0k used,   262136k free,    10936k cached

  PID USER      PR  NI  VIRT  RES  SHR S %CPU %MEM    TIME+  COMMAND
  567 root      20   0  8264 2884 2332 S    0  1.1   0:00.03 sshd
  570 root      20   0  2972 1612 1284 S    0  0.6   0:00.00 bash
  508 root      20   0 28340 1476 1032 S    0  0.6   0:00.01 rsyslogd
  576 root      20   0  2340 1128  896 R    0  0.4   0:00.01 top
  536 root      20   0  5500  980  584 S    0  0.4   0:00.00 sshd
  529 root      20   0  2300  772  604 S    0  0.3   0:00.00 cron
  162 root      16  -4  2264  752  416 S    0  0.3   0:00.02 udevd
    1 root      20   0  2040  724  628 S    0  0.3   0:00.22 init
  195 root      18  -2  2260  648  316 S    0  0.3   0:00.00 udevd
  196 root      18  -2  2260  640  308 S    0  0.3   0:00.00 udevd
  559 root      20   0  1712  556  476 S    0  0.2   0:00.00 getty
  553 root      20   0  1712  552  476 S    0  0.2   0:00.00 getty
  554 root      20   0  1712  552  476 S    0  0.2   0:00.00 getty
  555 root      20   0  1712  552  476 S    0  0.2   0:00.00 getty
  556 root      20   0  1712  552  476 S    0  0.2   0:00.00 getty
  558 root      20   0  1712  552  476 S    0  0.2   0:00.00 getty
  557 root      20   0  1712  548  476 S    0  0.2   0:00.00 getty
And as usual, htop output for the htop fans:
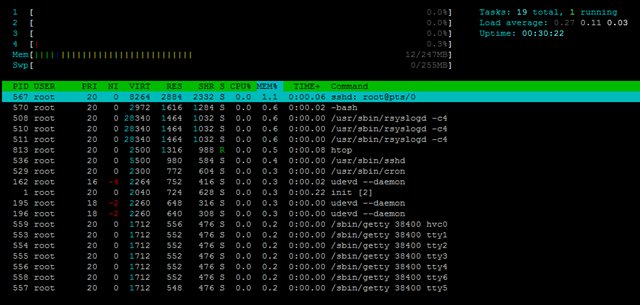
Close to 700MB of hard drive space were used for the OS template to be installed, which is pretty much the average:
df -h
Filesystem            Size  Used Avail Use% Mounted on
/dev/xvda1            9.9G  691M  8.7G   8% /
tmpfs                 124M     0  124M   0% /lib/init/rw
udev                  114M   24K  114M   1% /dev
tmpfs                 124M  4.0K  124M   1% /dev/shm
After the full LNMP stack was loaded, about 40MB of RAM were used, which is pretty good:
 free -m
             total       used       free     shared    buffers     cached
Mem:           247        198         49          0         10        148
-/+ buffers/cache:         39        208
Swap:          255          0        255
And the corresponding top output for the stack:
top - 20:49:49 up  8:56,  1 user,  load average: 0.00, 0.00, 0.00
Tasks:  79 total,   1 running,  78 sleeping,   0 stopped,   0 zombie
Cpu(s):  0.0%us,  0.0%sy,  0.0%ni, 99.9%id,  0.0%wa,  0.0%hi,  0.0%si,  0.0%st
Mem:    253692k total,   202908k used,    50784k free,    10304k buffers
Swap:   262136k total,      484k used,   261652k free,   152072k cached

  PID USER      PR  NI  VIRT  RES  SHR S %CPU %MEM    TIME+  COMMAND
 8943 www       20   0 14508  10m  412 S    0  4.2   0:00.01 nginx
21505 mysql     20   0 34816 5680 2996 S    0  2.2   0:00.00 mysqld
 8934 root      20   0 22716 4564 1404 S    0  1.8   0:04.14 php-cgi
 8935 www       20   0 22716 4168 1008 S    0  1.6   0:00.00 php-cgi
 8936 www       20   0 22716 4168 1008 S    0  1.6   0:00.00 php-cgi
 8937 www       20   0 22716 4168 1008 S    0  1.6   0:00.00 php-cgi
 8938 www       20   0 22716 4168 1008 S    0  1.6   0:00.00 php-cgi
 8939 www       20   0 22716 4168 1008 S    0  1.6   0:00.00 php-cgi
  567 root      20   0  8404 1740 1152 S    0  0.7   0:02.32 sshd
  570 root      20   0  2972 1424 1092 S    0  0.6   0:00.02 bash
  508 root      20   0 28340 1204  772 S    0  0.5   0:00.02 rsyslogd
 9246 root      20   0  2340 1140  900 R    0  0.4   0:00.01 top
  536 root      20   0  5500  864  468 S    0  0.3   0:00.02 sshd
 8942 root      20   0  4696  700  264 S    0  0.3   0:00.00 nginx
  529 root      20   0  2300  628  460 S    0  0.2   0:00.03 cron
    1 root      20   0  2040  588  544 S    0  0.2   0:00.48 init
21403 root      20   0  1756  552  464 S    0  0.2   0:00.01 mysqld_safe
And of course, htop output for the htop fans:
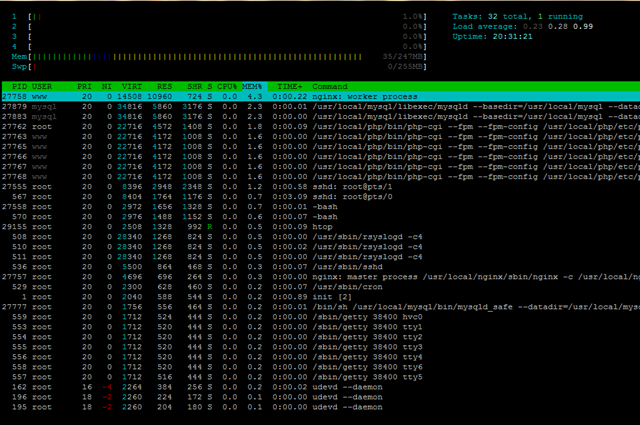
About 2.1GB of hard drive space were used, which is pretty standard for a Debian 6 installation:
 df -h
Filesystem            Size  Used Avail Use% Mounted on
/dev/xvda1            9.9G  2.1G  7.4G  22% /
tmpfs                 124M     0  124M   0% /lib/init/rw
udev                  114M   24K  114M   1% /dev
tmpfs                 124M  4.0K  124M   1% /dev/shm
Uptime showed the VPS is very lightly used:
uptime
 20:49:58 up  8:56,  1 user,  load average: 0.00, 0.00, 0.00
which is shown by the output of vmstat as well:
vmstat
procs -----------memory---------- ---swap-- -----io---- -system-- ----cpu----
 r  b   swpd   free   buff  cache   si   so    bi    bo   in   cs us sy id wa
 0  0    484  50784  10312 152076    0    0     2    10   13    9  1  0 98  1
the Inode was set to pretty good values as well, which is something I like:
 df -i
Filesystem            Inodes   IUsed   IFree IUse% Mounted on
/dev/xvda1           1310720   67927 1242793    6% /
tmpfs                  31711       4   31707    1% /lib/init/rw
udev                   29106     390   28716    2% /dev
tmpfs                  31711       3   31708    1% /dev/shm
CPUinfo shows that there are four cores available to the VPS, none of which are throttled, although for some interesting reason, the model of the CPU was not displayed properly:
 cat /proc/cpuinfo
processor       : 0
vendor_id       : GenuineIntel
cpu family      : 6
model           : 44
model name      : Genuine Intel(R) CPU             000  @ 2.27GHz
stepping        : 0
cpu MHz         : 2266.746
cache size      : 12288 KB
fdiv_bug        : no
hlt_bug         : no
f00f_bug        : no
coma_bug        : no
fpu             : yes
fpu_exception   : yes
cpuid level     : 11
wp              : yes
flags           : fpu tsc msr pae cx8 cmov pat clflush mmx fxsr sse sse2 ss ht nx constant_tsc nonstop_tsc aperfmperf pni vmx est ssse3 sse4_1 sse4_2 popcnt hypervisor ida arat tpr_shadow vnmi flexpriority ept vpid
bogomips        : 4533.49
clflush size    : 64
cache_alignment : 64
address sizes   : 40 bits physical, 48 bits virtual
power management:

processor       : 1
vendor_id       : GenuineIntel
cpu family      : 6
model           : 44
model name      : Genuine Intel(R) CPU             000  @ 2.27GHz
stepping        : 0
cpu MHz         : 2266.746
cache size      : 12288 KB
fdiv_bug        : no
hlt_bug         : no
f00f_bug        : no
coma_bug        : no
fpu             : yes
fpu_exception   : yes
cpuid level     : 11
wp              : yes
flags           : fpu tsc msr pae cx8 cmov pat clflush mmx fxsr sse sse2 ss ht nx constant_tsc nonstop_tsc aperfmperf pni vmx est ssse3 sse4_1 sse4_2 popcnt hypervisor ida arat tpr_shadow vnmi flexpriority ept vpid
bogomips        : 4533.49
clflush size    : 64
cache_alignment : 64
address sizes   : 40 bits physical, 48 bits virtual
power management:

processor       : 2
vendor_id       : GenuineIntel
cpu family      : 6
model           : 44
model name      : Genuine Intel(R) CPU             000  @ 2.27GHz
stepping        : 0
cpu MHz         : 2266.746
cache size      : 12288 KB
fdiv_bug        : no
hlt_bug         : no
f00f_bug        : no
coma_bug        : no
fpu             : yes
fpu_exception   : yes
cpuid level     : 11
wp              : yes
flags           : fpu tsc msr pae cx8 cmov pat clflush mmx fxsr sse sse2 ss ht nx constant_tsc nonstop_tsc aperfmperf pni vmx est ssse3 sse4_1 sse4_2 popcnt hypervisor ida arat tpr_shadow vnmi flexpriority ept vpid
bogomips        : 4533.49
clflush size    : 64
cache_alignment : 64
address sizes   : 40 bits physical, 48 bits virtual
power management:

processor       : 3
vendor_id       : GenuineIntel
cpu family      : 6
model           : 44
model name      : Genuine Intel(R) CPU             000  @ 2.27GHz
stepping        : 0
cpu MHz         : 2266.746
cache size      : 12288 KB
fdiv_bug        : no
hlt_bug         : no
f00f_bug        : no
coma_bug        : no
fpu             : yes
fpu_exception   : yes
cpuid level     : 11
wp              : yes
flags           : fpu tsc msr pae cx8 cmov pat clflush mmx fxsr sse sse2 ss ht nx constant_tsc nonstop_tsc aperfmperf pni vmx est ssse3 sse4_1 sse4_2 popcnt hypervisor ida arat tpr_shadow vnmi flexpriority ept vpid
bogomips        : 4533.49
clflush size    : 64
cache_alignment : 64
address sizes   : 40 bits physical, 48 bits virtual
power management:
Meminfo does not seems to show any overselling:
cat /proc/meminfo
MemTotal:         253692 kB
MemFree:            8964 kB
Buffers:            8204 kB
Cached:           201352 kB
SwapCached:          132 kB
Active:            42892 kB
Inactive:         187408 kB
Active(anon):       9320 kB
Inactive(anon):    11472 kB
Active(file):      33572 kB
Inactive(file):   175936 kB
Unevictable:           0 kB
Mlocked:               0 kB
HighTotal:             0 kB
HighFree:              0 kB
LowTotal:         253692 kB
LowFree:            8964 kB
SwapTotal:        262136 kB
SwapFree:         261652 kB
Dirty:               108 kB
Writeback:             0 kB
AnonPages:         20632 kB
Mapped:             5448 kB
Shmem:                36 kB
Slab:              10048 kB
SReclaimable:       6772 kB
SUnreclaim:         3276 kB
KernelStack:         680 kB
PageTables:          812 kB
NFS_Unstable:          0 kB
Bounce:                0 kB
WritebackTmp:          0 kB
CommitLimit:      388980 kB
Committed_AS:     101364 kB
VmallocTotal:     598008 kB
VmallocUsed:         840 kB
VmallocChunk:     597020 kB
HardwareCorrupted:     0 kB
HugePages_Total:       0
HugePages_Free:        0
HugePages_Rsvd:        0
HugePages_Surp:        0
Hugepagesize:       2048 kB
DirectMap4k:      262144 kB
DirectMap2M:           0 kB
Although I did not run vzfree since this is a Xen-based system.
Time sync results looks pretty OK too:
time sync

real    0m0.153s
user    0m0.004s
sys     0m0.000s
The really weird part comes when running the dd tests to see how the I/O is like:
dd if=/dev/zero of=test bs=64k count=16k conv=fdatasync
16384+0 records in
16384+0 records out
1073741824 bytes (1.1 GB) copied, 124.466 s, 8.6 MB/s
As you can see, the dd output seems rather low.
Since it is an otherwise pretty decent VPS, I was surprised to see this results and quickly ran another dd test, which showed similar results:
dd if=/dev/zero of=test bs=64k count=16k conv=fdatasync
16384+0 records in
16384+0 records out
1073741824 bytes (1.1 GB) copied, 147.529 s, 7.3 MB/s
I thought it was just a random abuser on the node, so I decided to wait for a day and re-run the dd test, the dd ran better but is nonetheless very low:
 dd if=/dev/zero of=test bs=64k count=16k conv=fdatasync
16384+0 records in
16384+0 records out
1073741824 bytes (1.1 GB) copied, 94.5905 s, 11.4 MB/s
As with many of the European VPS providers, network is something that really stand out, I was able to get more than 50MB/s on the download test from Cachefly:
wget cachefly.cachefly.net/100mb.test -O /dev/null
--2011-09-25 21:11:18--  http://cachefly.cachefly.net/100mb.test
Resolving cachefly.cachefly.net... 205.234.175.175
Connecting to cachefly.cachefly.net|205.234.175.175|:80... connected.
HTTP request sent, awaiting response... 200 OK
Length: 104857600 (100M) [application/octet-stream]
Saving to: `/dev/null'

100%[======================================>] 104,857,600 51.9M/s   in 1.9s

2011-09-25 21:11:20 (51.9 MB/s) - `/dev/null' saved [104857600/104857600]
Upload, on the other hand, is not that great, but still decent. First is the results from my Nix Communications VPS from Montreal, Canada:
 wget 91.227.124.118/100mb.test -O /dev/null
--2011-09-26 08:23:12--  http://91.227.124.118/100mb.test
Connecting to 91.227.124.118:80... connected.
HTTP request sent, awaiting response... 200 OK
Length: 104857600 (100M) [application/octet-stream]
Saving to: `/dev/null'

100%[======================================>] 104,857,600  912K/s   in 1m 56s
This seems to be rather low, however given that many of my uploading tests using this VPS has consistently showing really disappointing results, perhaps the issue is not with the QualityServers’ side.
Next is the result from my BuyVM VPS in San Jose, CA:
wget 91.227.124.118/100mb.test -O /dev/null
--2011-09-25 20:18:43--  http://91.227.124.118/100mb.test
Connecting to 91.227.124.118:80... connected.
HTTP request sent, awaiting response... 200 OK
Length: 104857600 (100M) [application/octet-stream]
Saving to: `/dev/null'

100%[======================================>] 104,857,600 1.30M/s   in 74s

2011-09-25 20:19:57 (1.36 MB/s) - `/dev/null' saved [104857600/104857600]
As you can see, this time the result is a lot better.
Finally, my QuickWeb VPS in London, UK:
 wget 91.227.124.118/100mb.test -O /dev/null
--2011-09-25 20:17:20--  http://91.227.124.118/100mb.test
Connecting to 91.227.124.118:80... connected.
HTTP request sent, awaiting response... 200 OK
Length: 104857600 (100M) [application/octet-stream]
Saving to: `/dev/null'

100%[======================================>] 104,857,600 4.38M/s   in 19s

2011-09-25 20:17:39 (5.29 MB/s) - `/dev/null' saved [104857600/104857600]
Being geographically the closest, there is little wonder this is the best results among the three tests.
Even though the disk I/O is almost terrible (at least from what I can see in the dd test), the benchmarks are not too bad – that is, if it runs, for some reason, initially when I ran UnixBench, I had a few errors:
   #    #  #    #  #  #    #          #####   ######  #    #   ####   #    #
   #    #  ##   #  #   #  #           #    #  #       ##   #  #    #  #    #
   #    #  # #  #  #    ##            #####   #####   # #  #  #       ######
   #    #  #  # #  #    ##            #    #  #       #  # #  #       #    #
   #    #  #   ##  #   #  #           #    #  #       #   ##  #    #  #    #
    ####   #    #  #  #    #          #####   ######  #    #   ####   #    #

   Version 5.1.3                      Based on the Byte Magazine Unix Benchmark

   Multi-CPU version                  Version 5 revisions by Ian Smith,
                                      Sunnyvale, CA, USA
   January 13, 2011                   johantheghost at yahoo period com


1 x Dhrystone 2 using register variables  1 2 3 4 5 6 7 8 9 10

1 x Double-Precision Whetstone  1 2 3 4 5 6 7 8 9 10

1 x Execl Throughput  1 2 3

1 x File Copy 1024 bufsize 2000 maxblocks  1 2 3

1 x File Copy 256 bufsize 500 maxblocks  1 2 3

1 x File Copy 4096 bufsize 8000 maxblocks  1 2 3

1 x Pipe Throughput  1 2 3 4 5 6 7 8 9 10

1 x Pipe-based Context Switching  1 2 3 4 5 6 7 8 9 10

1 x Process Creation  1 2 3

1 x System Call Overhead  1 2 3 4 5 6 7 8 9 10

1 x Shell Scripts (1 concurrent)  1 2 3

1 x Shell Scripts (8 concurrent)  1 2 3

4 x Dhrystone 2 using register variables  1 2 3 4 5 6 7 8 9 10

4 x Double-Precision Whetstone  1 2 3 4 5 6 7 8 9 10

4 x Execl Throughput  1 2 3

4 x File Copy 1024 bufsize 2000 maxblocks  1 2 3

4 x File Copy 256 bufsize 500 maxblocks  1 2 3

4 x File Copy 4096 bufsize 8000 maxblocks  1 2 3

4 x Pipe Throughput  1 2 3 4 5 6 7 8 9 10

4 x Pipe-based Context Switching  1 2 3 4 5 6 7 8 9 10

4 x Process Creation  1 2 3

4 x System Call Overhead  1 2 3 4 5 6 7 8 9 10

4 x Shell Scripts (1 concurrent)  1 2
**********************************************
Run: "Shell Scripts (1 concurrent)": /root/UnixBench/pgms/tst.sh: 18: srt: not found; aborting
Tried again and it went one test further:
   #    #  #    #  #  #    #          #####   ######  #    #   ####   #    #
   #    #  ##   #  #   #  #           #    #  #       ##   #  #    #  #    #
   #    #  # #  #  #    ##            #####   #####   # #  #  #       ######
   #    #  #  # #  #    ##            #    #  #       #  # #  #       #    #
   #    #  #   ##  #   #  #           #    #  #       #   ##  #    #  #    #
    ####   #    #  #  #    #          #####   ######  #    #   ####   #    #

   Version 5.1.3                      Based on the Byte Magazine Unix Benchmark

   Multi-CPU version                  Version 5 revisions by Ian Smith,
                                      Sunnyvale, CA, USA
   January 13, 2011                   johantheghost at yahoo period com


1 x Dhrystone 2 using register variables  1 2 3 4 5 6 7 8 9 10

1 x Double-Precision Whetstone  1 2 3 4 5 6 7 8 9 10

1 x Execl Throughput  1 2 3

1 x File Copy 1024 bufsize 2000 maxblocks  1 2 3

1 x File Copy 256 bufsize 500 maxblocks  1 2 3

1 x File Copy 4096 bufsize 8000 maxblocks  1 2 3

1 x Pipe Throughput  1 2 3 4 5 6 7 8 9 10

1 x Pipe-based Context Switching  1 2 3 4 5 6 7 8 9 10

1 x Process Creation  1 2 3

1 x System Call Overhead  1 2 3 4 5 6 7 8 9 10

1 x Shell Scripts (1 concurrent)  1 2 3

1 x Shell Scripts (8 concurrent)  1 2 3

4 x Dhrystone 2 using register variables  1 2 3 4 5 6 7 8 9 10

4 x Double-Precision Whetstone  1 2 3 4 5 6 7 8 9 10

4 x Execl Throughput  1 2 3

4 x File Copy 1024 bufsize 2000 maxblocks  1 2 3

4 x File Copy 256 bufsize 500 maxblocks  1 2 3

4 x File Copy 4096 bufsize 8000 maxblocks  1 2 3

4 x Pipe Throughput  1 2 3 4 5 6 7 8 9 10

4 x Pipe-based Context Switching  1 2 3 4 5 6 7 8 9 10

4 x Process Creation  1 2 3

4 x System Call Overhead  1 2 3 4 5 6 7 8 9 10

4 x Shell Scripts (1 concurrent)  1 2 3

4 x Shell Scripts (8 concurrent)  1 2 3
**********************************************
Run: "Shell Scripts (8 concurrent)": /root/UnixBench/pgms/tst.sh: 19: grp: not found; aborting
However, being a stubborn person, I gave this VPS yet another chance and finally it managed to run through and give me a score:
   #    #  #    #  #  #    #          #####   ######  #    #   ####   #    #
   #    #  ##   #  #   #  #           #    #  #       ##   #  #    #  #    #
   #    #  # #  #  #    ##            #####   #####   # #  #  #       ######
   #    #  #  # #  #    ##            #    #  #       #  # #  #       #    #
   #    #  #   ##  #   #  #           #    #  #       #   ##  #    #  #    #
    ####   #    #  #  #    #          #####   ######  #    #   ####   #    #

   Version 5.1.3                      Based on the Byte Magazine Unix Benchmark

   Multi-CPU version                  Version 5 revisions by Ian Smith,
                                      Sunnyvale, CA, USA
   January 13, 2011                   johantheghost at yahoo period com


1 x Dhrystone 2 using register variables  1 2 3 4 5 6 7 8 9 10

1 x Double-Precision Whetstone  1 2 3 4 5 6 7 8 9 10

1 x Execl Throughput  1 2 3

1 x File Copy 1024 bufsize 2000 maxblocks  1 2 3

1 x File Copy 256 bufsize 500 maxblocks  1 2 3

1 x File Copy 4096 bufsize 8000 maxblocks  1 2 3

1 x Pipe Throughput  1 2 3 4 5 6 7 8 9 10

1 x Pipe-based Context Switching  1 2 3 4 5 6 7 8 9 10

1 x Process Creation  1 2 3

1 x System Call Overhead  1 2 3 4 5 6 7 8 9 10

1 x Shell Scripts (1 concurrent)  1 2 3

1 x Shell Scripts (8 concurrent)  1 2 3

4 x Dhrystone 2 using register variables  1 2 3 4 5 6 7 8 9 10

4 x Double-Precision Whetstone  1 2 3 4 5 6 7 8 9 10

4 x Execl Throughput  1 2 3

4 x File Copy 1024 bufsize 2000 maxblocks  1 2 3

4 x File Copy 256 bufsize 500 maxblocks  1 2 3

4 x File Copy 4096 bufsize 8000 maxblocks  1 2 3

4 x Pipe Throughput  1 2 3 4 5 6 7 8 9 10

4 x Pipe-based Context Switching  1 2 3 4 5 6 7 8 9 10

4 x Process Creation  1 2 3

4 x System Call Overhead  1 2 3 4 5 6 7 8 9 10

4 x Shell Scripts (1 concurrent)  1 2 3

4 x Shell Scripts (8 concurrent)  1 2 3

========================================================================
   BYTE UNIX Benchmarks (Version 5.1.3)

   System: bob.infinitymedia.org.uk: GNU/Linux
   OS: GNU/Linux -- 2.6.32-5-686-bigmem -- #1 SMP Wed Jan 12 04:40:25 UTC 2011
   Machine: i686 (unknown)
   Language: en_US.utf8 (charmap="UTF-8", collate="UTF-8")
   CPU 0: Genuine Intel(R) CPU 000 @ 2.27GHz (4533.5 bogomips)
          Hyper-Threading, MMX, Physical Address Ext, Intel virtualization
   CPU 1: Genuine Intel(R) CPU 000 @ 2.27GHz (4533.5 bogomips)
          Hyper-Threading, MMX, Physical Address Ext, Intel virtualization
   CPU 2: Genuine Intel(R) CPU 000 @ 2.27GHz (4533.5 bogomips)
          Hyper-Threading, MMX, Physical Address Ext, Intel virtualization
   CPU 3: Genuine Intel(R) CPU 000 @ 2.27GHz (4533.5 bogomips)
          Hyper-Threading, MMX, Physical Address Ext, Intel virtualization
   06:56:49 up 19:03,  2 users,  load average: 0.00, 0.00, 0.00; runlevel 2

------------------------------------------------------------------------
Benchmark Run: Mon Sep 26 2011 06:56:49 - 07:25:04
4 CPUs in system; running 1 parallel copy of tests

Dhrystone 2 using register variables        9665509.8 lps   (10.0 s, 7 samples)
Double-Precision Whetstone                     1755.5 MWIPS (9.9 s, 7 samples)
Execl Throughput                               1282.8 lps   (29.8 s, 2 samples)
File Copy 1024 bufsize 2000 maxblocks        322124.4 KBps  (30.0 s, 2 samples)
File Copy 256 bufsize 500 maxblocks           88341.6 KBps  (30.0 s, 2 samples)
File Copy 4096 bufsize 8000 maxblocks        800716.5 KBps  (30.0 s, 2 samples)
Pipe Throughput                              538702.1 lps   (10.0 s, 7 samples)
Pipe-based Context Switching                  64481.7 lps   (10.0 s, 7 samples)
Process Creation                               2597.5 lps   (30.0 s, 2 samples)
Shell Scripts (1 concurrent)                   2921.6 lpm   (60.0 s, 2 samples)
Shell Scripts (8 concurrent)                    901.3 lpm   (60.0 s, 2 samples)
System Call Overhead                         379676.9 lps   (10.0 s, 7 samples)

System Benchmarks Index Values               BASELINE       RESULT    INDEX
Dhrystone 2 using register variables         116700.0    9665509.8    828.2
Double-Precision Whetstone                       55.0       1755.5    319.2
Execl Throughput                                 43.0       1282.8    298.3
File Copy 1024 bufsize 2000 maxblocks          3960.0     322124.4    813.4
File Copy 256 bufsize 500 maxblocks            1655.0      88341.6    533.8
File Copy 4096 bufsize 8000 maxblocks          5800.0     800716.5   1380.5
Pipe Throughput                               12440.0     538702.1    433.0
Pipe-based Context Switching                   4000.0      64481.7    161.2
Process Creation                                126.0       2597.5    206.1
Shell Scripts (1 concurrent)                     42.4       2921.6    689.1
Shell Scripts (8 concurrent)                      6.0        901.3   1502.1
System Call Overhead                          15000.0     379676.9    253.1
                                                                   ========
System Benchmarks Index Score                                         487.1

------------------------------------------------------------------------
Benchmark Run: Mon Sep 26 2011 07:25:04 - 07:53:25
4 CPUs in system; running 4 parallel copies of tests

Dhrystone 2 using register variables       44579134.3 lps   (10.0 s, 7 samples)
Double-Precision Whetstone                     8489.2 MWIPS (10.6 s, 7 samples)
Execl Throughput                               3766.3 lps   (29.9 s, 2 samples)
File Copy 1024 bufsize 2000 maxblocks        407964.3 KBps  (30.2 s, 2 samples)
File Copy 256 bufsize 500 maxblocks          104805.3 KBps  (30.4 s, 2 samples)
File Copy 4096 bufsize 8000 maxblocks       1182506.3 KBps  (30.0 s, 2 samples)
Pipe Throughput                             2436391.7 lps   (10.0 s, 7 samples)
Pipe-based Context Switching                 197604.5 lps   (10.0 s, 7 samples)
Process Creation                               4712.2 lps   (30.0 s, 2 samples)
Shell Scripts (1 concurrent)                   7816.6 lpm   (60.0 s, 2 samples)
Shell Scripts (8 concurrent)                   1120.5 lpm   (60.1 s, 2 samples)
System Call Overhead                        1624944.4 lps   (10.0 s, 7 samples)

System Benchmarks Index Values               BASELINE       RESULT    INDEX
Dhrystone 2 using register variables         116700.0   44579134.3   3820.0
Double-Precision Whetstone                       55.0       8489.2   1543.5
Execl Throughput                                 43.0       3766.3    875.9
File Copy 1024 bufsize 2000 maxblocks          3960.0     407964.3   1030.2
File Copy 256 bufsize 500 maxblocks            1655.0     104805.3    633.3
File Copy 4096 bufsize 8000 maxblocks          5800.0    1182506.3   2038.8
Pipe Throughput                               12440.0    2436391.7   1958.5
Pipe-based Context Switching                   4000.0     197604.5    494.0
Process Creation                                126.0       4712.2    374.0
Shell Scripts (1 concurrent)                     42.4       7816.6   1843.5
Shell Scripts (8 concurrent)                      6.0       1120.5   1867.5
System Call Overhead                          15000.0    1624944.4   1083.3
                                                                   ========
System Benchmarks Index Score                                        1203.9
For a small VPS like this, I would say the score is pretty OK, however I am curious as to why it failed several times before finally managed to run.
Next, the GeekBench scores, which, failed as well with GeekBench 2.2. Seriously, I am thinking for some reason, v2.2 is really VPS-unfriendly and I think most of the VPS that I have reviewed for the past few weeks have failed with GeekBench 2.2.
Geekbench 2.2.0 : http://www.primatelabs.ca/geekbench/

Geekbench is in tryout mode

Geekbench is limited to running 32-bit benchmarks while in tryout mode.
Please purchase Geekbench to remove all limitations found in tryout mode.

If you would like to purchase Geekbench you can do so online:

        http://store.primatelabs.ca/

If you have already purchased Geekbench, enter your email address and license
key from your email receipt with the following command line:

        dist/Geekbench-2.2.0-Linux/geekbench_x86_32 -r

Run Geekbench as root to gather accurate system information.

Floating point exception
However, I did have some luck using the older version 2.1 though, and the tests actually produced some decent scores:
System Information
  Platform:                  Linux x86 (32-bit)
  Compiler:                  GCC 4.1.2 20070925 (Red Hat 4.1.2-33)
  Operating System:          Linux 2.6.32-5-686-bigmem i686
  Model:                     Linux PC (Genuine Intel(R) CPU             000  @ 2.27GHz)
  Motherboard:               Unknown Motherboard
  Processor:                 Genuine Intel(R) CPU             000  @ 2.27GHz
  Processor ID:              GenuineIntel Family 6 Model 44 Stepping 0
  Logical Processors:        4
  Physical Processors:       1
  Processor Frequency:       2.27 GHz
  L1 Instruction Cache:      0.00 B
  L1 Data Cache:             0.00 B
  L2 Cache:                  256 KB
  L3 Cache:                  0.00 B
  Bus Frequency:             0.00 Hz
  Memory:                    248 MB
  Memory Type:               N/A
  SIMD:                      1
  BIOS:                      N/A
  Processor Model:           Genuine Intel(R) CPU             000  @ 2.27GHz
  Processor Cores:           4

Integer
  Blowfish
    single-threaded scalar    1101 ||||
    multi-threaded scalar     5289 |||||||||||||||||||||
  Text Compress
    single-threaded scalar    1459 |||||
    multi-threaded scalar     6252 |||||||||||||||||||||||||
  Text Decompress
    single-threaded scalar    1761 |||||||
    multi-threaded scalar     6873 |||||||||||||||||||||||||||
  Image Compress
    single-threaded scalar    1469 |||||
    multi-threaded scalar     3983 |||||||||||||||
  Image Decompress
    single-threaded scalar    1099 ||||
    multi-threaded scalar     3343 |||||||||||||
  Lua
    single-threaded scalar    1969 |||||||
    multi-threaded scalar     5891 |||||||||||||||||||||||

Floating Point
  Mandelbrot
    single-threaded scalar    1804 |||||||
    multi-threaded scalar     8137 ||||||||||||||||||||||||||||||||
  Dot Product
    single-threaded scalar    2904 |||||||||||
    multi-threaded scalar    13381 |||||||||||||||||||||||||||||||||||||||||||||||||||||
    single-threaded vector    3903 |||||||||||||||
    multi-threaded vector    11872 |||||||||||||||||||||||||||||||||||||||||||||||
  LU Decomposition
    single-threaded scalar    2283 |||||||||
    multi-threaded scalar     6101 ||||||||||||||||||||||||
  Primality Test
    single-threaded scalar    2651 ||||||||||
    multi-threaded scalar     9277 |||||||||||||||||||||||||||||||||||||
  Sharpen Image
    single-threaded scalar    5357 |||||||||||||||||||||
    multi-threaded scalar    14390 |||||||||||||||||||||||||||||||||||||||||||||||||||||||||
  Blur Image
    single-threaded scalar    4877 |||||||||||||||||||
    multi-threaded scalar    16961 |||||||||||||||||||||||||||||||||||||||||||||||||||||||||||||||||||

Memory
  Read Sequential
    single-threaded scalar    3585 ||||||||||||||
  Write Sequential
    single-threaded scalar    6164 ||||||||||||||||||||||||
  Stdlib Allocate
    single-threaded scalar    3571 ||||||||||||||
  Stdlib Write
    single-threaded scalar    2928 |||||||||||
  Stdlib Copy
    single-threaded scalar    6482 |||||||||||||||||||||||||

Stream
  Stream Copy
    single-threaded scalar    4498 |||||||||||||||||
    single-threaded vector    5578 ||||||||||||||||||||||
  Stream Scale
    single-threaded scalar    2751 |||||||||||
    single-threaded vector    3781 |||||||||||||||
  Stream Add
    single-threaded scalar    2976 |||||||||||
    single-threaded vector    4427 |||||||||||||||||
  Stream Triad
    single-threaded scalar    4320 |||||||||||||||||
    single-threaded vector    2618 ||||||||||

Integer Score:                3374 |||||||||||||
Floating Point Score:         7421 |||||||||||||||||||||||||||||
Memory Score:                 4546 ||||||||||||||||||
Stream Score:                 3868 |||||||||||||||

Overall Geekbench Score:      5074 ||||||||||||||||||||
Trying again showed pretty decent score too:
System Information
  Platform:                  Linux x86 (32-bit)
  Compiler:                  GCC 4.1.2 20070925 (Red Hat 4.1.2-33)
  Operating System:          Linux 2.6.32-5-686-bigmem i686
  Model:                     Linux PC (Genuine Intel(R) CPU             000  @ 2.27GHz)
  Motherboard:               Unknown Motherboard
  Processor:                 Genuine Intel(R) CPU             000  @ 2.27GHz
  Processor ID:              GenuineIntel Family 6 Model 44 Stepping 0
  Logical Processors:        4
  Physical Processors:       1
  Processor Frequency:       2.27 GHz
  L1 Instruction Cache:      0.00 B
  L1 Data Cache:             0.00 B
  L2 Cache:                  256 KB
  L3 Cache:                  0.00 B
  Bus Frequency:             0.00 Hz
  Memory:                    248 MB
  Memory Type:               N/A
  SIMD:                      1
  BIOS:                      N/A
  Processor Model:           Genuine Intel(R) CPU             000  @ 2.27GHz
  Processor Cores:           4

Integer
  Blowfish
    single-threaded scalar    1511 ||||||
    multi-threaded scalar     7015 ||||||||||||||||||||||||||||
  Text Compress
    single-threaded scalar    1540 ||||||
    multi-threaded scalar     5901 |||||||||||||||||||||||
  Text Decompress
    single-threaded scalar    1364 |||||
    multi-threaded scalar     5844 |||||||||||||||||||||||
  Image Compress
    single-threaded scalar    1407 |||||
    multi-threaded scalar     3998 |||||||||||||||
  Image Decompress
    single-threaded scalar     847 |||
    multi-threaded scalar     3141 ||||||||||||
  Lua
    single-threaded scalar    2115 ||||||||
    multi-threaded scalar     5906 |||||||||||||||||||||||

Floating Point
  Mandelbrot
    single-threaded scalar    1331 |||||
    multi-threaded scalar     5862 |||||||||||||||||||||||
  Dot Product
    single-threaded scalar    2580 ||||||||||
    multi-threaded scalar     9001 ||||||||||||||||||||||||||||||||||||
    single-threaded vector    2565 ||||||||||
    multi-threaded vector    11263 |||||||||||||||||||||||||||||||||||||||||||||
  LU Decomposition
    single-threaded scalar    1506 ||||||
    multi-threaded scalar     6059 ||||||||||||||||||||||||
  Primality Test
    single-threaded scalar    2142 ||||||||
    multi-threaded scalar     6705 ||||||||||||||||||||||||||
  Sharpen Image
    single-threaded scalar    3647 ||||||||||||||
    multi-threaded scalar    13317 |||||||||||||||||||||||||||||||||||||||||||||||||||||
  Blur Image
    single-threaded scalar    3326 |||||||||||||
    multi-threaded scalar    12633 ||||||||||||||||||||||||||||||||||||||||||||||||||

Memory
  Read Sequential
    single-threaded scalar    3465 |||||||||||||
  Write Sequential
    single-threaded scalar    5515 ||||||||||||||||||||||
  Stdlib Allocate
    single-threaded scalar    2296 |||||||||
  Stdlib Write
    single-threaded scalar    2783 |||||||||||
  Stdlib Copy
    single-threaded scalar    5580 ||||||||||||||||||||||

Stream
  Stream Copy
    single-threaded scalar    3559 ||||||||||||||
    single-threaded vector    4711 ||||||||||||||||||
  Stream Scale
    single-threaded scalar    2485 |||||||||
    single-threaded vector    4922 |||||||||||||||||||
  Stream Add
    single-threaded scalar    3341 |||||||||||||
    single-threaded vector    4436 |||||||||||||||||
  Stream Triad
    single-threaded scalar    3076 ||||||||||||
    single-threaded vector    3635 ||||||||||||||

Integer Score:                3382 |||||||||||||
Floating Point Score:         5852 |||||||||||||||||||||||
Memory Score:                 3927 |||||||||||||||
Stream Score:                 3770 |||||||||||||||

Overall Geekbench Score:      4394 |||||||||||||||||
It really surprised me, especially knowing that UnixBench and GeekBench sometime penalize heavily if a VPS has a low disk I/O and yet, despite the low disk I/O, both benchmark scores are pretty good for such a small VPS. I was thinking if there is any chance such issue was caused by the time issue in the 2.6.18 kernel, but it does not seem to be the case.
Customer Service and Support
As per my previous review on Quality Servers, Kayako Helpdesk continued to be integrated with the WHMCS system and when the user clicks on Support in the WHMCS system, they would be redirected to the Kayako Helpdesk. However, the WHMCS account does not work by default in the Kayako system. You will be assigned a new password when you try to create a ticket without sign in for the first time, based on your email address. After that, you will have to sign in to see the ticket replies or create a new ticket.
Same with the last time, QualityServers continued to have quite a few departments to handle different types of tickets:

One pretty annoying feature here is that you will have to supply IP addresses and root password when submitting the tickets, although I guess you can always just type in some random numbers for IP and root password:

Once the ticket is created, you can log back in to see the current status of the ticket as well as providing feedbacks to the satisfaction levels.
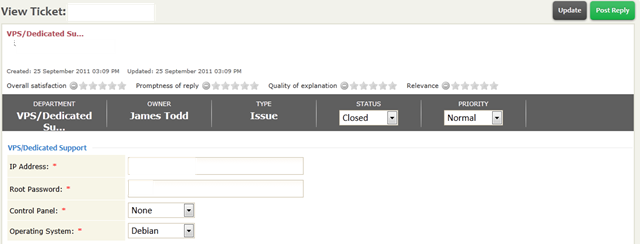
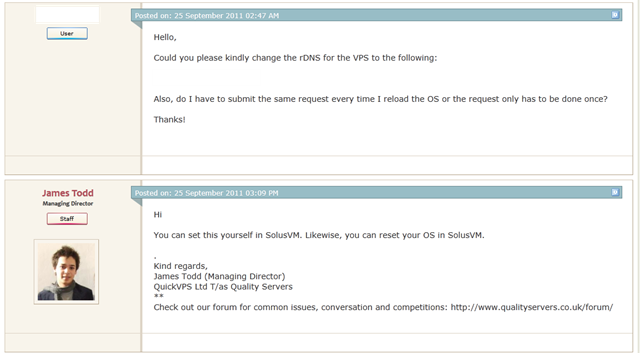
James seems to be the only one responding to all of the technical tickets, and I think sometimes it could take a while for him to reply although I think for a budget box, it is well within the acceptable range:
The first ticket was for an rDNS request, which was sent in at 02:47AM and did not get a reply until 03:09AM, about 12 hours later (they are all in UK time I believe). Note: I have received the permission from Mr. A to publish the screenshots of the tickets here.
The next one is a more bizarre one, after noticed that the disk I/O is somewhat low, a ticket was sent to James, and this time he replied relatively fast, within 3 minute:
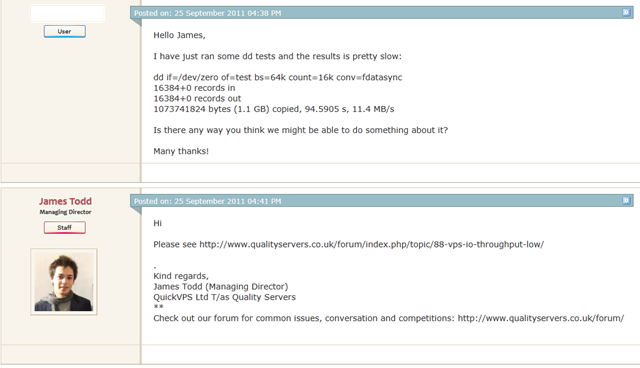
And from the link he sent, here is what I can see:

I have to agree with him on that since the benchmarks score is pretty good, therefore, I decided to ask James what would be a good way to test the VPS disk I/O and to my surprise (again), here is the response:

OK, so we do not care about the disk I/O as long as it is good enough for “normal use”. Fair enough, how about ioping? Is that another bad way to test the disk I/O?

Well, I guess not, but I would be surprised if I am getting a dd output of less than 10MB/s because people from LEB are trying to trash his servers.
In the end, I never get a concrete solution/explanation to the low I/O, and basically have to have the faith that the VPS is fast even though the dd tests and iopings are low.
Conclusion
There are indeed many great aspects of the QualityServers VPS, for example, network is fast, ticket response is acceptable and for a low end VPS, the benchmarks are actually pretty decent. However, the disk I/O is pretty disappointing, at least from the output of the dd tests, which James could not care less about. Although I have to agree with James that the VPS is relatively fast and I did not have to wait for 10 minutes just to log in via SSH (which happened to some of the VPS showing comparable dd results), the fact that I have no clue why it is so is something really puzzled me and would prevent me from considering using it as a production-grade VPS despite the cheap price.
Yep, that mysterious Mr. A is me 🙂 Mr. H to be precist 😛
“but I figure I should try to avoid of getting myself into more trouble” <– Nah, I'm not that kinda person!
@Humza: All right, I can confirm Mr. A is Mr. H 🙂 Thanks a lot for lending me the VPS for the review 🙂
No worries 🙂
Pingback: 96MB Low End VPS Review Part XXXII – EDIS | | 96MB.com96MB.com