
96MB Low End VPS Review Part XXX – BuffaloVPS
Recently, I was in need of a larger VPS to put a few of my dead projects on, which was originally placed on a Nix Communication’s VPS in Montreal (which also acted as a test server to test the upload speed, which resulted in some pretty harsh comments on LEB recently). I have a relatively limited budget and the sale from Buffalo VPS was definitely a great deal for me: cheap, great latency to Canada and the datacentre seems to have some DDOS protection, therefore, I decided to give them a shot and see how it goes.
General Information and Set Up
BuffaloVPS is a reseller of ChicagoVPS, and as such, they share the same hardware nodes and services, even the same SolusVM control panel.
In the particular promotion that I signed up for, here is what you get for 40 USD a year:
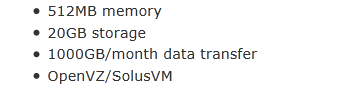
Note that there is no burstable memory and 512MB is all you have with this plan.
Sign up is via HTTPS protocol and needless to say, BuffaloVPS also requires you to put in the domain name during the sign up, which is similar to the set up in ChicagoVPS:

Payment to both ChicagoVPS and BuffaloVPS are also sent to the same company, New Wave NetConnect, LLC.
Provision is instant after payment, I was able to receive my VPS details within a minute. The welcome email comes from an email with BuffaloVPS in the name but actually an ChicagoVPS.net email address and with root password in plain text and quite a few things explained that are not really related to me but could be useful to some other clients with CPanel or Xen clients:
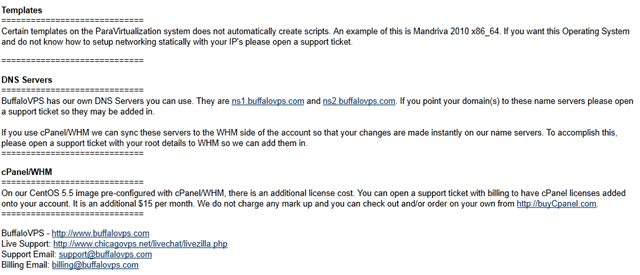
You could log into the WHMCS system via the login area on their home page, which is rather convenient:

Once logged in to the secured WHMCS system, you can see your VPS details under My Services:
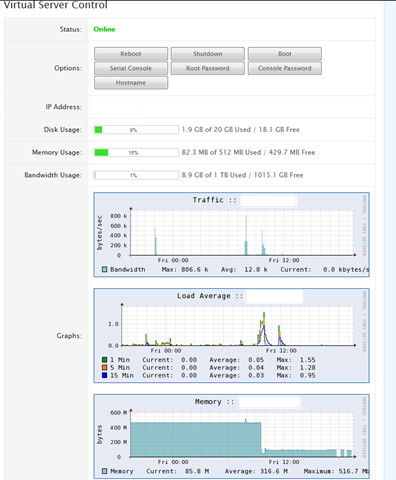
Note that all controls, as well as all resources usage percentage bars and graphs are available here. The control buttons appear to be working as well, I was able to use Reboot, Shutdown, Boot and Hostname without any issues.
BuffaloVPS and ChicagoVPS have recently upgraded their SolusVM system, and it certainly looks like there has been quite a few changes in the interface, once logged in through HTTPS connection using assigned user name, here is what you see:
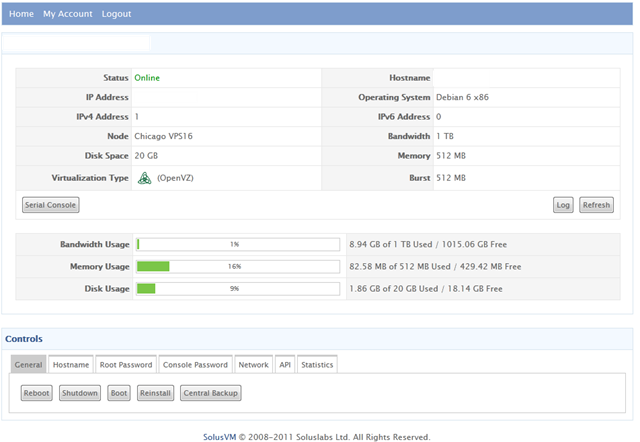
I am not sure about you, but if I were to make a choice, I will definitely choose the old interface over the new one, since everything was a click away using the old interface. Although I can see some improvements in the new interface where you can see the dedicated and burstable memory separately and also the number of IP addresses the VPS is assigned to.
Instant rDNS, although is available as an option in the Network tab, does not appear to work:
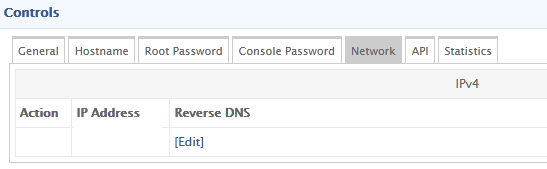
Click on Edit showed me this message:

The Central Backup button does work though, and I was able to get a backup done pretty quickly:
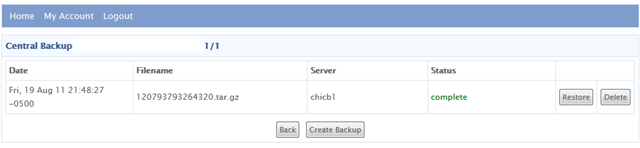
Reinstall button brings up the list of OS templates available, which I am pretty sure is a lot more than what I saw in ChicagoVPS last time:


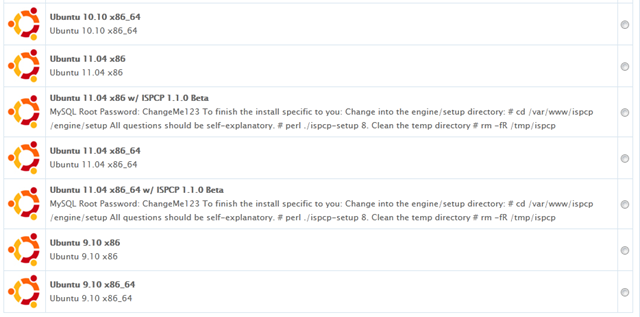
As you can see, not only they have quite a few of CentOS and Ubuntu pre-packaged templates, but also quite a few Linux distributions, anyone heard of Funtoo Linux?
Test on the VPS
As mentioned above, the VPS that I have used for testing has 512MB of dedicated RAM, no burstable RAM and it is located in ColoCrossing Data Centre in Chicago. As a side note, ChicagoVPS seems to be a pretty big client of ColoCrossing that they actually have ChicagoVPS as one of their case studies.
After the Debian 6 32 bit OS template was loaded, close to 40MB of RAM was used:
free -m
             total       used       free     shared    buffers     cached
Mem:           512         39        472          0          0          0
-/+ buffers/cache:         39        472
Swap:            0          0          0
And the corresponding top output:
top - 15:30:01 up 1 min,  1 user,  load average: 0.00, 0.00, 0.00
Tasks:   7 total,   1 running,   6 sleeping,   0 stopped,   0 zombie
Cpu(s):  0.2%us,  0.0%sy,  0.0%ni, 99.8%id,  0.0%wa,  0.0%hi,  0.0%si,  0.0%st
Mem:    524288k total,    40496k used,   483792k free,        0k buffers
Swap:        0k total,        0k used,        0k free,        0k cached

  PID USER      PR  NI  VIRT  RES  SHR S %CPU %MEM    TIME+  COMMAND
 1310 root      18   0  8452 2932 2320 S    0  0.6   0:00.10 sshd
 1312 root      15   0  2972 1640 1300 S    0  0.3   0:00.00 bash
 1265 root      25   0 33316 1304  952 S    0  0.2   0:00.00 rsyslogd
 1320 root      15   0  2324 1060  872 R    0  0.2   0:00.00 top
 1297 root      18   0  5484  988  600 S    0  0.2   0:00.00 sshd
 1291 root      18   0  2284  756  592 S    0  0.1   0:00.00 cron
    1 root      15   0  2024  676  584 S    0  0.1   0:00.54 init
And of course, htop output for htop fans:
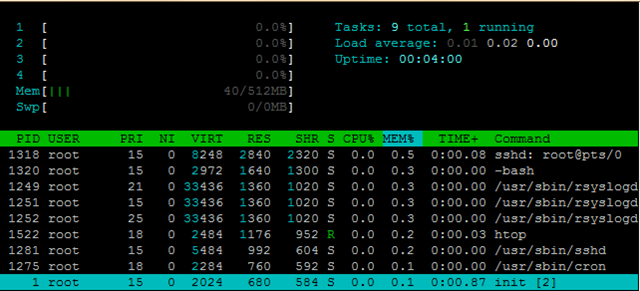
This is a bit higher than the normal empty Debian usage, which is normally single digit numbers after the initial OS reload. However the hard drive usage are not bad:
df -h
Filesystem            Size  Used Avail Use% Mounted on
/dev/simfs             20G  196M   20G   1% /
tmpfs                 256M     0  256M   0% /lib/init/rw
tmpfs                 256M     0  256M   0% /dev/shm
I tried to load the LNMP stack with MySQL 5.5 to the VPS, and after I did that, it used quite a lot of RAM:
free -m
             total       used       free     shared    buffers     cached
Mem:           512        396        115          0          0          0
-/+ buffers/cache:        396        115
Swap:            0          0          0
And the corresponding top output:
top - 12:02:00 up 2 min,  1 user,  load average: 0.00, 0.00, 0.00
Tasks:  14 total,   1 running,  13 sleeping,   0 stopped,   0 zombie
Cpu(s):  0.1%us,  0.0%sy,  0.0%ni, 99.9%id,  0.0%wa,  0.0%hi,  0.0%si,  0.0%st
Mem:    524288k total,   406196k used,   118092k free,        0k buffers
Swap:        0k total,        0k used,        0k free,        0k cached

  PID USER      PR  NI  VIRT  RES  SHR S %CPU %MEM    TIME+  COMMAND
 1511 mysql     19   0  311m  28m 4108 S    0  5.5   0:00.05 mysqld
 1580 www       18   0 15384  11m  812 S    0  2.2   0:00.03 nginx
 1535 www       15   0 36508 5632 2392 S    0  1.1   0:00.26 php-fpm
 1536 www       15   0 36508 5632 2392 S    0  1.1   0:00.25 php-fpm
 1534 root      18   0 36244 4152 1156 S    0  0.8   0:00.00 php-fpm
 1592 root      15   0  8248 2840 2316 S    0  0.5   0:00.06 sshd
 1595 root      18   0  2972 1632 1300 S    0  0.3   0:00.00 bash
 1540 root      25   0 33436 1368 1020 S    0  0.3   0:00.00 rsyslogd
 1618 root      15   0  2324 1064  872 R    0  0.2   0:00.00 top
 1573 root      15   0  5484  988  600 S    0  0.2   0:00.00 sshd
 1566 root      18   0  2284  748  592 S    0  0.1   0:00.00 cron
 1579 root      18   0  4780  732  272 S    0  0.1   0:00.00 nginx
    1 root      15   0  2024  680  584 S    0  0.1   0:00.45 init
 1273 root      18   0  1740  532  436 S    0  0.1   0:00.00 mysqld_safe
2.3G of hard drive space in total was used, which is pretty high as well:
 df -h
Filesystem            Size  Used Avail Use% Mounted on
/dev/simfs             20G  2.3G   18G  12% /
tmpfs                 256M     0  256M   0% /lib/init/rw
tmpfs                 256M     0  256M   0% /dev/shm
I then reloaded OS template again and switched back to MySQL 5.1, which is what I used to test most of the VPS and this time, everything appears to be a lot more "normal":
First the free -m output:
 free -m
             total       used       free     shared    buffers     cached
Mem:           512         87        424          0          0          0
-/+ buffers/cache:         87        424
Swap:            0          0          0
As you can see, this is definitely within a reasonable level. Next the top output:
top - 11:08:09 up 12:34,  1 user,  load average: 0.08, 0.02, 0.01
Tasks:  14 total,   2 running,  12 sleeping,   0 stopped,   0 zombie
Cpu(s):  0.0%us,  0.0%sy,  0.0%ni, 99.7%id,  0.3%wa,  0.0%hi,  0.0%si,  0.0%st
Mem:    524288k total,    89524k used,   434764k free,        0k buffers
Swap:        0k total,        0k used,        0k free,        0k cached

  PID USER      PR  NI  VIRT  RES  SHR S %CPU %MEM    TIME+  COMMAND
21796 www       15   0 15016  11m  816 S    0  2.2   0:00.00 nginx
13872 mysql     19   0 34792 5828 3152 S    0  1.1   0:00.00 mysqld
17560 root      18   0 23808 4168 1256 S    0  0.8   0:01.26 php-fpm
17561 www       25   0 23808 3656  744 S    0  0.7   0:00.00 php-fpm
17562 www       25   0 23808 3656  744 S    0  0.7   0:00.00 php-fpm
22108 root      16   0  8248 2832 2320 R    0  0.5   0:00.07 sshd
21795 root      20   0  4804 2180 1724 S    0  0.4   0:00.00 nginx
22111 root      16   0  2972 1632 1296 S    0  0.3   0:00.00 bash
 1249 root      23   0 33436 1364 1020 S    0  0.3   0:00.00 rsyslogd
22119 root      15   0  2324 1068  876 R    0  0.2   0:00.00 top
 1281 root      18   0  5484  988  604 S    0  0.2   0:00.00 sshd
 1275 root      15   0  2284  752  596 S    0  0.1   0:00.00 cron
    1 root      18   0  2024  676  584 S    0  0.1   0:00.79 init
13770 root      25   0  1740  524  436 S    0  0.1   0:00.00 mysqld_safe
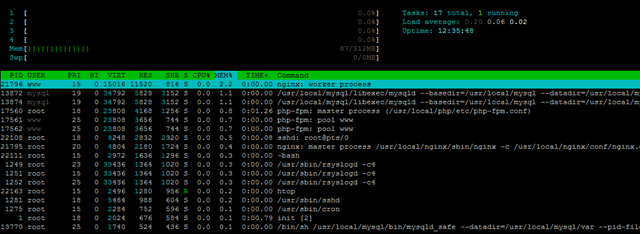
And the htop output:
The disk space usage is a lot less as well:
df -h
Filesystem            Size  Used Avail Use% Mounted on
/dev/simfs             20G  1.2G   19G   6% /
tmpfs                 256M     0  256M   0% /lib/init/rw
tmpfs                 256M     0  256M   0% /dev/shm
uptime shows the VPS is quite little used:
uptime
 11:00:04 up 1 day, 12:26,  1 user,  load average: 0.00, 0.00, 0.00
Which is also shown in vmstat:
vmstat
procs -----------memory---------- ---swap-- -----io---- -system-- ----cpu----
 r  b   swpd   free   buff  cache   si   so    bi    bo   in   cs us sy id wa
 1  0      0 367516      0      0    0    0    38    44    0   90  0  0 99  0
Inodes are set to pretty high value:
df -i
Filesystem            Inodes   IUsed   IFree IUse% Mounted on
/dev/simfs           10485760  105335 10380425    2% /
tmpfs                  65536       4   65532    1% /lib/init/rw
tmpfs                  65536       1   65535    1% /dev/shm
And beancounters values are good as well:
cat /proc/user_beancounters
Version: 2.5
       uid  resource                     held              maxheld              barrier                limit              failcnt
      771:  kmemsize                  5623903              5681316           2147483646           2147483646                    0
            lockedpages                     0                  419               999999               999999                    0
            privvmpages                 56917               131055               131072               131072                    8
            shmpages                     4868                 8962               131072               131072                    0
            dummy                           0                    0                    0                    0                    0
            numproc                        44                   44               999999               999999                    0
            physpages                   31264                43287                    0           2147483647                    0
            vmguarpages                     0                    0               131072           2147483647                    0
            oomguarpages                31264                43287               131072           2147483647                    0
            numtcpsock                      4                    9              7999992              7999992                    0
            numflock                        1                    7               999999               999999                    0
            numpty                          1                    2               500000               500000                    0
            numsiginfo                      0                   19               999999               999999                    0
            tcpsndbuf                  155488               315352            214748160            396774400                    0
            tcprcvbuf                   65536              4829880            214748160            396774400                    0
            othersockbuf                30264              4274840            214748160            396774400                    0
            dgramrcvbuf                     0                 8472            214748160            396774400                    0
            numothersock                   26                   28              7999992              7999992                    0
            dcachesize                      0                    0           2147483646           2147483646                    0
            numfile                       633                  840             23999976             23999976                    0
            dummy                           0                    0                    0                    0                    0
            dummy                           0                    0                    0                    0                    0
            dummy                           0                    0                    0                    0                    0
            numiptent                      14                   14               999999               999999                    0
VZfree does not show signs of oversell as well:
 vzfree
             Total     Used     Free
Kernel:   2048.00M    2.32M 2045.68M
Allocate:  512.00M  138.00M  374.00M (512M Guaranteed)
Commit:    512.00M   59.37M  452.63M (41.3% of Allocated)
Swap:                 0.00M          (0.0% of Committed)
CPUInfo shows there are 4 cores assigned to the VPS, and they are not throttled:
 cat /proc/cpuinfo
processor       : 0
vendor_id       : GenuineIntel
cpu family      : 6
model           : 30
model name      : Intel(R) Xeon(R) CPU           X3450  @ 2.67GHz
stepping        : 5
cpu MHz         : 2666.754
cache size      : 8192 KB
physical id     : 0
siblings        : 8
core id         : 0
cpu cores       : 4
apicid          : 0
fpu             : yes
fpu_exception   : yes
cpuid level     : 11
wp              : yes
flags           : fpu vme de pse tsc msr pae mce cx8 apic sep mtrr pge mca cmov pat pse36 clflush dts acpi mmx fxsr sse sse2 ss ht tm syscall nx rdtscp lm constant_tsc ida nonstop_tsc pni monitor ds_cpl vmx smx est tm2 ssse3 cx16 xtpr sse4_1 sse4_2 popcnt lahf_lm
bogomips        : 5333.50
clflush size    : 64
cache_alignment : 64
address sizes   : 36 bits physical, 48 bits virtual
power management: [8]

processor       : 1
vendor_id       : GenuineIntel
cpu family      : 6
model           : 30
model name      : Intel(R) Xeon(R) CPU           X3450  @ 2.67GHz
stepping        : 5
cpu MHz         : 2666.754
cache size      : 8192 KB
physical id     : 0
siblings        : 8
core id         : 1
cpu cores       : 4
apicid          : 2
fpu             : yes
fpu_exception   : yes
cpuid level     : 11
wp              : yes
flags           : fpu vme de pse tsc msr pae mce cx8 apic sep mtrr pge mca cmov pat pse36 clflush dts acpi mmx fxsr sse sse2 ss ht tm syscall nx rdtscp lm constant_tsc ida nonstop_tsc pni monitor ds_cpl vmx smx est tm2 ssse3 cx16 xtpr sse4_1 sse4_2 popcnt lahf_lm
bogomips        : 5333.30
clflush size    : 64
cache_alignment : 64
address sizes   : 36 bits physical, 48 bits virtual
power management: [8]

processor       : 2
vendor_id       : GenuineIntel
cpu family      : 6
model           : 30
model name      : Intel(R) Xeon(R) CPU           X3450  @ 2.67GHz
stepping        : 5
cpu MHz         : 2666.754
cache size      : 8192 KB
physical id     : 0
siblings        : 8
core id         : 2
cpu cores       : 4
apicid          : 4
fpu             : yes
fpu_exception   : yes
cpuid level     : 11
wp              : yes
flags           : fpu vme de pse tsc msr pae mce cx8 apic sep mtrr pge mca cmov pat pse36 clflush dts acpi mmx fxsr sse sse2 ss ht tm syscall nx rdtscp lm constant_tsc ida nonstop_tsc pni monitor ds_cpl vmx smx est tm2 ssse3 cx16 xtpr sse4_1 sse4_2 popcnt lahf_lm
bogomips        : 5333.32
clflush size    : 64
cache_alignment : 64
address sizes   : 36 bits physical, 48 bits virtual
power management: [8]

processor       : 3
vendor_id       : GenuineIntel
cpu family      : 6
model           : 30
model name      : Intel(R) Xeon(R) CPU           X3450  @ 2.67GHz
stepping        : 5
cpu MHz         : 2666.754
cache size      : 8192 KB
physical id     : 0
siblings        : 8
core id         : 3
cpu cores       : 4
apicid          : 6
fpu             : yes
fpu_exception   : yes
cpuid level     : 11
wp              : yes
flags           : fpu vme de pse tsc msr pae mce cx8 apic sep mtrr pge mca cmov pat pse36 clflush dts acpi mmx fxsr sse sse2 ss ht tm syscall nx rdtscp lm constant_tsc ida nonstop_tsc pni monitor ds_cpl vmx smx est tm2 ssse3 cx16 xtpr sse4_1 sse4_2 popcnt lahf_lm
bogomips        : 5333.30
clflush size    : 64
cache_alignment : 64
address sizes   : 36 bits physical, 48 bits virtual
power management: [8]
And meminfo, as usual, does not really reveal anything new:
cat /proc/meminfo
MemTotal:       524288 kB
MemFree:        296644 kB
Buffers:             0 kB
Cached:              0 kB
SwapCached:          0 kB
Active:              0 kB
Inactive:            0 kB
HighTotal:           0 kB
HighFree:            0 kB
LowTotal:       524288 kB
LowFree:        296644 kB
SwapTotal:           0 kB
SwapFree:            0 kB
Dirty:           19500 kB
Writeback:           0 kB
AnonPages:           0 kB
Mapped:              0 kB
Slab:                0 kB
PageTables:          0 kB
NFS_Unstable:        0 kB
Bounce:              0 kB
CommitLimit:         0 kB
Committed_AS:        0 kB
VmallocTotal:        0 kB
VmallocUsed:         0 kB
VmallocChunk:        0 kB
HugePages_Total:     0
HugePages_Free:      0
HugePages_Rsvd:      0
Hugepagesize:     2048 kB
And time sync values:
time sync

real    0m0.032s
user    0m0.000s
sys     0m0.006s
Disk I/O is pretty much just above average for a low end budget VPS, but definitely usable:
 dd if=/dev/zero of=test bs=64k count=16k conv=fdatasync
16384+0 records in
16384+0 records out
1073741824 bytes (1.1 GB) copied, 17.0567 s, 63.0 MB/s
Testing again shows slightly worse results, but still OK:
dd if=/dev/zero of=test bs=64k count=16k conv=fdatasync
16384+0 records in
16384+0 records out
1073741824 bytes (1.1 GB) copied, 19.0359 s, 56.4 MB/s
The network speed is pretty good, with the Cachefly downloading test, I was able to get close to the line speed for a 100mbit port:
wget cachefly.cachefly.net/100mb.test -O /dev/null
--2011-08-20 03:46:08--  http://cachefly.cachefly.net/100mb.test
Resolving cachefly.cachefly.net... 205.234.175.175
Connecting to cachefly.cachefly.net|205.234.175.175|:80... connected.
HTTP request sent, awaiting response... 200 OK
Length: 104857600 (100M) [application/octet-stream]
Saving to: `/dev/null'

100%[======================================>] 104,857,600 12.3M/s   in 8.3s

2011-08-20 03:46:17 (12.1 MB/s) - `/dev/null' saved [104857600/104857600]
For the uploading tests, speed again varies, with my Nix Communication’s VPS in Montreal, Canada unfortunately at the lowest speed:
 wget 96.8.1xx.2xx/100mb.test -O /dev/null
--2011-09-25 11:39:05--  http://96.8.1xx.2xx/100mb.test
Connecting to 96.8.120.243:80... connected.
HTTP request sent, awaiting response... 200 OK
Length: 104857600 (100M) [application/octet-stream]
Saving to: `/dev/null'

100%[======================================>] 104,857,600 1.15M/s   in 88s

2011-09-25 11:40:33 (1.14 MB/s) - `/dev/null' saved [104857600/104857600]
The speed from my BuyVM VPS in San Jose, CA, is a lot better and I think more representing the actual speed I am getting:
 wget 96.8.1xx.2xx/100mb.test -O /dev/null
--2011-09-24 23:43:41--  http://96.8.1xx.2xx/100mb.test
Connecting to 96.8.120.243:80... connected.
HTTP request sent, awaiting response... 200 OK
Length: 104857600 (100M) [application/octet-stream]
Saving to: `/dev/null'

100%[======================================>] 104,857,600 9.04M/s   in 22s

2011-09-24 23:44:03 (4.59 MB/s) - `/dev/null' saved [104857600/104857600]
Surprisingly (or not), the Quickweb VPS in London, UK, actually gave the best uploading speed although perhaps the furthest away:
wget 96.8.1xx.2xx/100mb.test -O /dev/null
--2011-09-24 23:44:43--  http://96.8.1xx.2xx/100mb.test
Connecting to 96.8.120.243:80... connected.
HTTP request sent, awaiting response... 200 OK
Length: 104857600 (100M) [application/octet-stream]
Saving to: `/dev/null'

100%[======================================>] 104,857,600 11.0M/s   in 11s

2011-09-24 23:44:55 (8.73 MB/s) - `/dev/null' saved [104857600/104857600]
I have manually modified the IP addresses to mask some digits, so don’t think I (or anyone) can just get some IPv4.6-ish addresses from BuffaloVPS.
Finally, it is the benchmarking time. Originally I thought the Benchmarks may not be that great because the disk I/O seen from the dd tests are really just above average. However, to my pleasant surprise, the benchamrks actually worked out to be quite well:
First, the for the UnixBench, I was able to get more than 2200 points:
   #    #  #    #  #  #    #          #####   ######  #    #   ####   #    #
   #    #  ##   #  #   #  #           #    #  #       ##   #  #    #  #    #
   #    #  # #  #  #    ##            #####   #####   # #  #  #       ######
   #    #  #  # #  #    ##            #    #  #       #  # #  #       #    #
   #    #  #   ##  #   #  #           #    #  #       #   ##  #    #  #    #
    ####   #    #  #  #    #          #####   ######  #    #   ####   #    #

   Version 5.1.3                      Based on the Byte Magazine Unix Benchmark

   Multi-CPU version                  Version 5 revisions by Ian Smith,
                                      Sunnyvale, CA, USA
   January 13, 2011                   johantheghost at yahoo period com


1 x Dhrystone 2 using register variables  1 2 3 4 5 6 7 8 9 10

1 x Double-Precision Whetstone  1 2 3 4 5 6 7 8 9 10

1 x Execl Throughput  1 2 3

1 x File Copy 1024 bufsize 2000 maxblocks  1 2 3

1 x File Copy 256 bufsize 500 maxblocks  1 2 3

1 x File Copy 4096 bufsize 8000 maxblocks  1 2 3

1 x Pipe Throughput  1 2 3 4 5 6 7 8 9 10

1 x Pipe-based Context Switching  1 2 3 4 5 6 7 8 9 10

1 x Process Creation  1 2 3

1 x System Call Overhead  1 2 3 4 5 6 7 8 9 10

1 x Shell Scripts (1 concurrent)  1 2 3

1 x Shell Scripts (8 concurrent)  1 2 3

4 x Dhrystone 2 using register variables  1 2 3 4 5 6 7 8 9 10

4 x Double-Precision Whetstone  1 2 3 4 5 6 7 8 9 10

4 x Execl Throughput  1 2 3

4 x File Copy 1024 bufsize 2000 maxblocks  1 2 3

4 x File Copy 256 bufsize 500 maxblocks  1 2 3

4 x File Copy 4096 bufsize 8000 maxblocks  1 2 3

4 x Pipe Throughput  1 2 3 4 5 6 7 8 9 10

4 x Pipe-based Context Switching  1 2 3 4 5 6 7 8 9 10

4 x Process Creation  1 2 3

4 x System Call Overhead  1 2 3 4 5 6 7 8 9 10

4 x Shell Scripts (1 concurrent)  1 2 3

4 x Shell Scripts (8 concurrent)  1 2 3

========================================================================
   BYTE UNIX Benchmarks (Version 5.1.3)

   System: chicago: GNU/Linux
   OS: GNU/Linux -- 2.6.32-238.19.1.el5.028stab092.2 -- #1 SMP Thu Jul 21 19:23:22 MSD 2011
   Machine: i686 (unknown)
   Language: en_US.utf8 (charmap="UTF-8", collate="UTF-8")
   CPU 0: Intel(R) Xeon(R) CPU X3450 @ 2.67GHz (5333.5 bogomips)
          Hyper-Threading, x86-64, MMX, Physical Address Ext, SYSENTER/SYSEXIT, SYSCALL/SYSRET, Intel virtualization
   CPU 1: Intel(R) Xeon(R) CPU X3450 @ 2.67GHz (5333.3 bogomips)
          Hyper-Threading, x86-64, MMX, Physical Address Ext, SYSENTER/SYSEXIT, SYSCALL/SYSRET, Intel virtualization
   CPU 2: Intel(R) Xeon(R) CPU X3450 @ 2.67GHz (5333.3 bogomips)
          Hyper-Threading, x86-64, MMX, Physical Address Ext, SYSENTER/SYSEXIT, SYSCALL/SYSRET, Intel virtualization
   CPU 3: Intel(R) Xeon(R) CPU X3450 @ 2.67GHz (5333.3 bogomips)
          Hyper-Threading, x86-64, MMX, Physical Address Ext, SYSENTER/SYSEXIT, SYSCALL/SYSRET, Intel virtualization
   03:50:36 up  1:06,  1 user,  load average: 0.00, 0.05, 0.21; runlevel 2

------------------------------------------------------------------------
Benchmark Run: Sat Aug 20 2011 03:50:36 - 04:19:09
4 CPUs in system; running 1 parallel copy of tests

Dhrystone 2 using register variables       14474320.8 lps   (10.0 s, 7 samples)
Double-Precision Whetstone                     2860.1 MWIPS (10.0 s, 7 samples)
Execl Throughput                               4493.8 lps   (29.8 s, 2 samples)
File Copy 1024 bufsize 2000 maxblocks        535792.3 KBps  (30.0 s, 2 samples)
File Copy 256 bufsize 500 maxblocks          151520.4 KBps  (30.0 s, 2 samples)
File Copy 4096 bufsize 8000 maxblocks       1276584.1 KBps  (30.0 s, 2 samples)
Pipe Throughput                              970616.2 lps   (10.0 s, 7 samples)
Pipe-based Context Switching                 290669.2 lps   (10.0 s, 7 samples)
Process Creation                              13432.4 lps   (30.0 s, 2 samples)
Shell Scripts (1 concurrent)                   6388.3 lpm   (60.0 s, 2 samples)
Shell Scripts (8 concurrent)                   2048.0 lpm   (60.0 s, 2 samples)
System Call Overhead                         731504.8 lps   (10.0 s, 7 samples)

System Benchmarks Index Values               BASELINE       RESULT    INDEX
Dhrystone 2 using register variables         116700.0   14474320.8   1240.3
Double-Precision Whetstone                       55.0       2860.1    520.0
Execl Throughput                                 43.0       4493.8   1045.1
File Copy 1024 bufsize 2000 maxblocks          3960.0     535792.3   1353.0
File Copy 256 bufsize 500 maxblocks            1655.0     151520.4    915.5
File Copy 4096 bufsize 8000 maxblocks          5800.0    1276584.1   2201.0
Pipe Throughput                               12440.0     970616.2    780.2
Pipe-based Context Switching                   4000.0     290669.2    726.7
Process Creation                                126.0      13432.4   1066.1
Shell Scripts (1 concurrent)                     42.4       6388.3   1506.7
Shell Scripts (8 concurrent)                      6.0       2048.0   3413.4
System Call Overhead                          15000.0     731504.8    487.7
                                                                   ========
System Benchmarks Index Score                                        1089.1

------------------------------------------------------------------------
Benchmark Run: Sat Aug 20 2011 04:19:09 - 04:47:57
4 CPUs in system; running 4 parallel copies of tests

Dhrystone 2 using register variables       48424380.2 lps   (10.0 s, 7 samples)
Double-Precision Whetstone                    10882.9 MWIPS (10.2 s, 7 samples)
Execl Throughput                              14532.4 lps   (29.5 s, 2 samples)
File Copy 1024 bufsize 2000 maxblocks        387576.8 KBps  (30.0 s, 2 samples)
File Copy 256 bufsize 500 maxblocks          105174.2 KBps  (30.0 s, 2 samples)
File Copy 4096 bufsize 8000 maxblocks       1040288.4 KBps  (30.0 s, 2 samples)
Pipe Throughput                             3218671.6 lps   (10.0 s, 7 samples)
Pipe-based Context Switching                 985234.0 lps   (10.0 s, 7 samples)
Process Creation                              40644.9 lps   (30.0 s, 2 samples)
Shell Scripts (1 concurrent)                  19089.7 lpm   (60.0 s, 2 samples)
Shell Scripts (8 concurrent)                   2316.1 lpm   (60.0 s, 2 samples)
System Call Overhead                        2535087.3 lps   (10.0 s, 7 samples)

System Benchmarks Index Values               BASELINE       RESULT    INDEX
Dhrystone 2 using register variables         116700.0   48424380.2   4149.5
Double-Precision Whetstone                       55.0      10882.9   1978.7
Execl Throughput                                 43.0      14532.4   3379.6
File Copy 1024 bufsize 2000 maxblocks          3960.0     387576.8    978.7
File Copy 256 bufsize 500 maxblocks            1655.0     105174.2    635.5
File Copy 4096 bufsize 8000 maxblocks          5800.0    1040288.4   1793.6
Pipe Throughput                               12440.0    3218671.6   2587.4
Pipe-based Context Switching                   4000.0     985234.0   2463.1
Process Creation                                126.0      40644.9   3225.8
Shell Scripts (1 concurrent)                     42.4      19089.7   4502.3
Shell Scripts (8 concurrent)                      6.0       2316.1   3860.2
System Call Overhead                          15000.0    2535087.3   1690.1
                                                                   ========
System Benchmarks Index Score                                        2269.7
Second try showed even better results:
  #    #  #    #  #  #    #          #####   ######  #    #   ####   #    #
   #    #  ##   #  #   #  #           #    #  #       ##   #  #    #  #    #
   #    #  # #  #  #    ##            #####   #####   # #  #  #       ######
   #    #  #  # #  #    ##            #    #  #       #  # #  #       #    #
   #    #  #   ##  #   #  #           #    #  #       #   ##  #    #  #    #
    ####   #    #  #  #    #          #####   ######  #    #   ####   #    #

   Version 5.1.3                      Based on the Byte Magazine Unix Benchmark

   Multi-CPU version                  Version 5 revisions by Ian Smith,
                                      Sunnyvale, CA, USA
   January 13, 2011                   johantheghost at yahoo period com


1 x Dhrystone 2 using register variables  1 2 3 4 5 6 7 8 9 10

1 x Double-Precision Whetstone  1 2 3 4 5 6 7 8 9 10

1 x Execl Throughput  1 2 3

1 x File Copy 1024 bufsize 2000 maxblocks  1 2 3

1 x File Copy 256 bufsize 500 maxblocks  1 2 3

1 x File Copy 4096 bufsize 8000 maxblocks  1 2 3

1 x Pipe Throughput  1 2 3 4 5 6 7 8 9 10

1 x Pipe-based Context Switching  1 2 3 4 5 6 7 8 9 10

1 x Process Creation  1 2 3

1 x System Call Overhead  1 2 3 4 5 6 7 8 9 10

1 x Shell Scripts (1 concurrent)  1 2 3

1 x Shell Scripts (8 concurrent)  1 2 3

4 x Dhrystone 2 using register variables  1 2 3 4 5 6 7 8 9 10

4 x Double-Precision Whetstone  1 2 3 4 5 6 7 8 9 10

4 x Execl Throughput  1 2 3

4 x File Copy 1024 bufsize 2000 maxblocks  1 2 3

4 x File Copy 256 bufsize 500 maxblocks  1 2 3

4 x File Copy 4096 bufsize 8000 maxblocks  1 2 3

4 x Pipe Throughput  1 2 3 4 5 6 7 8 9 10

4 x Pipe-based Context Switching  1 2 3 4 5 6 7 8 9 10

4 x Process Creation  1 2 3

4 x System Call Overhead  1 2 3 4 5 6 7 8 9 10

4 x Shell Scripts (1 concurrent)  1 2 3

4 x Shell Scripts (8 concurrent)  1 2 3

========================================================================
   BYTE UNIX Benchmarks (Version 5.1.3)

   System: chicago: GNU/Linux
   OS: GNU/Linux -- 2.6.32-238.19.1.el5.028stab092.2 -- #1 SMP Thu Jul 21 19:23:22 MSD 2011
   Machine: i686 (unknown)
   Language: en_US.utf8 (charmap="UTF-8", collate="UTF-8")
   CPU 0: Intel(R) Xeon(R) CPU X3450 @ 2.67GHz (5333.5 bogomips)
          Hyper-Threading, x86-64, MMX, Physical Address Ext, SYSENTER/SYSEXIT, SYSCALL/SYSRET, Intel virtualization
   CPU 1: Intel(R) Xeon(R) CPU X3450 @ 2.67GHz (5333.3 bogomips)
          Hyper-Threading, x86-64, MMX, Physical Address Ext, SYSENTER/SYSEXIT, SYSCALL/SYSRET, Intel virtualization
   CPU 2: Intel(R) Xeon(R) CPU X3450 @ 2.67GHz (5333.3 bogomips)
          Hyper-Threading, x86-64, MMX, Physical Address Ext, SYSENTER/SYSEXIT, SYSCALL/SYSRET, Intel virtualization
   CPU 3: Intel(R) Xeon(R) CPU X3450 @ 2.67GHz (5333.3 bogomips)
          Hyper-Threading, x86-64, MMX, Physical Address Ext, SYSENTER/SYSEXIT, SYSCALL/SYSRET, Intel virtualization
   04:52:49 up  2:08,  1 user,  load average: 0.54, 4.91, 5.25; runlevel 2

------------------------------------------------------------------------
Benchmark Run: Sat Aug 20 2011 04:52:49 - 05:22:00
4 CPUs in system; running 1 parallel copy of tests

Dhrystone 2 using register variables       14084381.5 lps   (10.0 s, 7 samples)
Double-Precision Whetstone                     2857.3 MWIPS (10.0 s, 7 samples)
Execl Throughput                               4462.6 lps   (29.4 s, 2 samples)
File Copy 1024 bufsize 2000 maxblocks        501088.1 KBps  (30.0 s, 2 samples)
File Copy 256 bufsize 500 maxblocks          151698.1 KBps  (30.0 s, 2 samples)
File Copy 4096 bufsize 8000 maxblocks       1267156.8 KBps  (30.0 s, 2 samples)
Pipe Throughput                              971250.6 lps   (10.0 s, 7 samples)
Pipe-based Context Switching                 289624.3 lps   (10.0 s, 7 samples)
Process Creation                              13405.5 lps   (30.0 s, 2 samples)
Shell Scripts (1 concurrent)                   6218.5 lpm   (60.0 s, 2 samples)
Shell Scripts (8 concurrent)                   2045.4 lpm   (60.0 s, 2 samples)
System Call Overhead                         729186.1 lps   (10.0 s, 7 samples)

System Benchmarks Index Values               BASELINE       RESULT    INDEX
Dhrystone 2 using register variables         116700.0   14084381.5   1206.9
Double-Precision Whetstone                       55.0       2857.3    519.5
Execl Throughput                                 43.0       4462.6   1037.8
File Copy 1024 bufsize 2000 maxblocks          3960.0     501088.1   1265.4
File Copy 256 bufsize 500 maxblocks            1655.0     151698.1    916.6
File Copy 4096 bufsize 8000 maxblocks          5800.0    1267156.8   2184.8
Pipe Throughput                               12440.0     971250.6    780.7
Pipe-based Context Switching                   4000.0     289624.3    724.1
Process Creation                                126.0      13405.5   1063.9
Shell Scripts (1 concurrent)                     42.4       6218.5   1466.6
Shell Scripts (8 concurrent)                      6.0       2045.4   3409.0
System Call Overhead                          15000.0     729186.1    486.1
                                                                   ========
System Benchmarks Index Score                                        1076.1

------------------------------------------------------------------------
Benchmark Run: Sat Aug 20 2011 05:22:00 - 05:50:38
4 CPUs in system; running 4 parallel copies of tests

Dhrystone 2 using register variables       47663720.9 lps   (10.0 s, 7 samples)
Double-Precision Whetstone                    10566.6 MWIPS (10.0 s, 7 samples)
Execl Throughput                              14598.4 lps   (29.4 s, 2 samples)
File Copy 1024 bufsize 2000 maxblocks        386647.8 KBps  (30.0 s, 2 samples)
File Copy 256 bufsize 500 maxblocks          104897.6 KBps  (30.0 s, 2 samples)
File Copy 4096 bufsize 8000 maxblocks       1022630.3 KBps  (30.0 s, 2 samples)
Pipe Throughput                             3242214.0 lps   (10.0 s, 7 samples)
Pipe-based Context Switching                1001411.9 lps   (10.0 s, 7 samples)
Process Creation                              41343.0 lps   (30.0 s, 2 samples)
Shell Scripts (1 concurrent)                  19733.7 lpm   (60.0 s, 2 samples)
Shell Scripts (8 concurrent)                   2475.0 lpm   (60.0 s, 2 samples)
System Call Overhead                        2521665.0 lps   (10.0 s, 7 samples)

System Benchmarks Index Values               BASELINE       RESULT    INDEX
Dhrystone 2 using register variables         116700.0   47663720.9   4084.3
Double-Precision Whetstone                       55.0      10566.6   1921.2
Execl Throughput                                 43.0      14598.4   3395.0
File Copy 1024 bufsize 2000 maxblocks          3960.0     386647.8    976.4
File Copy 256 bufsize 500 maxblocks            1655.0     104897.6    633.8
File Copy 4096 bufsize 8000 maxblocks          5800.0    1022630.3   1763.2
Pipe Throughput                               12440.0    3242214.0   2606.3
Pipe-based Context Switching                   4000.0    1001411.9   2503.5
Process Creation                                126.0      41343.0   3281.2
Shell Scripts (1 concurrent)                     42.4      19733.7   4654.2
Shell Scripts (8 concurrent)                      6.0       2475.0   4125.0
System Call Overhead                          15000.0    2521665.0   1681.1
                                                                   ========
System Benchmarks Index Score                                        2283.3
GeekBench results are pretty impressive as well with more than 5400 points:
System Information
  Platform:                  Linux x86 (32-bit)
  Compiler:                  GCC 4.1.2 20070925 (Red Hat 4.1.2-33)
  Operating System:          Linux 2.6.32-238.19.1.el5.028stab092.2 i686
  Model:                     Linux PC (Intel(R) Xeon(R) CPU           X3450  @ 2.67GHz)
  Motherboard:               Unknown Motherboard
  Processor:                 Intel(R) Xeon(R) CPU           X3450  @ 2.67GHz
  Processor ID:              GenuineIntel Family 6 Model 30 Stepping 5
  Logical Processors:        4
  Physical Processors:       1
  Processor Frequency:       2.67 GHz
  L1 Instruction Cache:      0.00 B
  L1 Data Cache:             0.00 B
  L2 Cache:                  256 KB
  L3 Cache:                  0.00 B
  Bus Frequency:             0.00 Hz
  Memory:                    15.6 GB
  Memory Type:               N/A
  SIMD:                      1
  BIOS:                      N/A
  Processor Model:           Intel(R) Xeon(R) CPU           X3450  @ 2.67GHz
  Processor Cores:           4

Integer
  Blowfish
    single-threaded scalar    1733 ||||||
    multi-threaded scalar     7211 ||||||||||||||||||||||||||||
  Text Compress
    single-threaded scalar    1591 ||||||
    multi-threaded scalar     5600 ||||||||||||||||||||||
  Text Decompress
    single-threaded scalar    1661 ||||||
    multi-threaded scalar     6107 ||||||||||||||||||||||||
  Image Compress
    single-threaded scalar    1748 ||||||
    multi-threaded scalar     4802 |||||||||||||||||||
  Image Decompress
    single-threaded scalar    1484 |||||
    multi-threaded scalar     3829 |||||||||||||||
  Lua
    single-threaded scalar    3092 ||||||||||||
    multi-threaded scalar     8448 |||||||||||||||||||||||||||||||||

Floating Point
  Mandelbrot
    single-threaded scalar    2350 |||||||||
    multi-threaded scalar     8027 ||||||||||||||||||||||||||||||||
  Dot Product
    single-threaded scalar    3809 |||||||||||||||
    multi-threaded scalar     8151 ||||||||||||||||||||||||||||||||
    single-threaded vector    2425 |||||||||
    multi-threaded vector    11259 |||||||||||||||||||||||||||||||||||||||||||||
  LU Decomposition
    single-threaded scalar    1636 ||||||
    multi-threaded scalar     6442 |||||||||||||||||||||||||
  Primality Test
    single-threaded scalar    2961 |||||||||||
    multi-threaded scalar     9656 ||||||||||||||||||||||||||||||||||||||
  Sharpen Image
    single-threaded scalar    3946 |||||||||||||||
    multi-threaded scalar    15800 |||||||||||||||||||||||||||||||||||||||||||||||||||||||||||||||
  Blur Image
    single-threaded scalar    5756 |||||||||||||||||||||||
    multi-threaded scalar    16139 ||||||||||||||||||||||||||||||||||||||||||||||||||||||||||||||||

Memory
  Read Sequential
    single-threaded scalar    4892 |||||||||||||||||||
  Write Sequential
    single-threaded scalar    8944 |||||||||||||||||||||||||||||||||||
  Stdlib Allocate
    single-threaded scalar    4240 ||||||||||||||||
  Stdlib Write
    single-threaded scalar    4211 ||||||||||||||||
  Stdlib Copy
    single-threaded scalar    8205 ||||||||||||||||||||||||||||||||

Stream
  Stream Copy
    single-threaded scalar    4357 |||||||||||||||||
    single-threaded vector    4862 |||||||||||||||||||
  Stream Scale
    single-threaded scalar    4041 ||||||||||||||||
    single-threaded vector    4657 ||||||||||||||||||
  Stream Add
    single-threaded scalar    3658 ||||||||||||||
    single-threaded vector    4839 |||||||||||||||||||
  Stream Triad
    single-threaded scalar    3939 |||||||||||||||
    single-threaded vector    3360 |||||||||||||

Integer Score:                3942 |||||||||||||||
Floating Point Score:         7025 ||||||||||||||||||||||||||||
Memory Score:                 6098 ||||||||||||||||||||||||
Stream Score:                 4214 ||||||||||||||||

Overall Geekbench Score:      5479 |||||||||||||||||||||
And again, second time delivered better results:
System Information
  Platform:                  Linux x86 (32-bit)
  Compiler:                  GCC 4.1.2 20070925 (Red Hat 4.1.2-33)
  Operating System:          Linux 2.6.32-238.19.1.el5.028stab092.2 i686
  Model:                     Linux PC (Intel(R) Xeon(R) CPU           X3450  @ 2.67GHz)
  Motherboard:               Unknown Motherboard
  Processor:                 Intel(R) Xeon(R) CPU           X3450  @ 2.67GHz
  Processor ID:              GenuineIntel Family 6 Model 30 Stepping 5
  Logical Processors:        4
  Physical Processors:       1
  Processor Frequency:       2.67 GHz
  L1 Instruction Cache:      0.00 B
  L1 Data Cache:             0.00 B
  L2 Cache:                  256 KB
  L3 Cache:                  0.00 B
  Bus Frequency:             0.00 Hz
  Memory:                    15.6 GB
  Memory Type:               N/A
  SIMD:                      1
  BIOS:                      N/A
  Processor Model:           Intel(R) Xeon(R) CPU           X3450  @ 2.67GHz
  Processor Cores:           4

Integer
  Blowfish
    single-threaded scalar    1899 |||||||
    multi-threaded scalar     6849 |||||||||||||||||||||||||||
  Text Compress
    single-threaded scalar    1953 |||||||
    multi-threaded scalar     5478 |||||||||||||||||||||
  Text Decompress
    single-threaded scalar    2072 ||||||||
    multi-threaded scalar     6125 ||||||||||||||||||||||||
  Image Compress
    single-threaded scalar    1744 ||||||
    multi-threaded scalar     4932 |||||||||||||||||||
  Image Decompress
    single-threaded scalar    1522 ||||||
    multi-threaded scalar     5611 ||||||||||||||||||||||
  Lua
    single-threaded scalar    3058 ||||||||||||
    multi-threaded scalar     8058 ||||||||||||||||||||||||||||||||

Floating Point
  Mandelbrot
    single-threaded scalar    2343 |||||||||
    multi-threaded scalar     7990 |||||||||||||||||||||||||||||||
  Dot Product
    single-threaded scalar    3822 |||||||||||||||
    multi-threaded scalar    11863 |||||||||||||||||||||||||||||||||||||||||||||||
    single-threaded vector    4504 ||||||||||||||||||
    multi-threaded vector     8793 |||||||||||||||||||||||||||||||||||
  LU Decomposition
    single-threaded scalar    2685 ||||||||||
    multi-threaded scalar     5598 ||||||||||||||||||||||
  Primality Test
    single-threaded scalar    3722 ||||||||||||||
    multi-threaded scalar     8870 |||||||||||||||||||||||||||||||||||
  Sharpen Image
    single-threaded scalar    6174 ||||||||||||||||||||||||
    multi-threaded scalar    23588 ||||||||||||||||||||||||||||||||||||||||||||||||||||||||||||||||||||||||||||||||||||||||||||||
  Blur Image
    single-threaded scalar    5918 |||||||||||||||||||||||
    multi-threaded scalar    14354 |||||||||||||||||||||||||||||||||||||||||||||||||||||||||

Memory
  Read Sequential
    single-threaded scalar    5075 ||||||||||||||||||||
  Write Sequential
    single-threaded scalar    8054 ||||||||||||||||||||||||||||||||
  Stdlib Allocate
    single-threaded scalar    3909 |||||||||||||||
  Stdlib Write
    single-threaded scalar    4552 ||||||||||||||||||
  Stdlib Copy
    single-threaded scalar    8907 |||||||||||||||||||||||||||||||||||

Stream
  Stream Copy
    single-threaded scalar    4272 |||||||||||||||||
    single-threaded vector    5798 |||||||||||||||||||||||
  Stream Scale
    single-threaded scalar    4166 ||||||||||||||||
    single-threaded vector    5238 ||||||||||||||||||||
  Stream Add
    single-threaded scalar    3887 |||||||||||||||
    single-threaded vector    4918 |||||||||||||||||||
  Stream Triad
    single-threaded scalar    3718 ||||||||||||||
    single-threaded vector    3525 ||||||||||||||

Integer Score:                4108 ||||||||||||||||
Floating Point Score:         7873 |||||||||||||||||||||||||||||||
Memory Score:                 6099 ||||||||||||||||||||||||
Stream Score:                 4440 |||||||||||||||||

Overall Geekbench Score:      5857 |||||||||||||||||||||||
Overall, I definitely like what I am seeing here, although the dd tests may have some room for improvement, it definitely has a great set up otherwise, including really good network speed.
Customer Service and Support
One very important asset (no disrespect) shared between BuffloVPS and ChicagoVPS is the technician, Jeremiah. Although the owner of BuffaloVPS, Adam, does respond to tickets and serves sort of like a first line of support, Jeremiah is really the person taking care of most of the more “difficult” issues. However, compare to ChicagoVPS, I have to say Adam does not normally respond ticket as fast, although for a budget provider, it is nonetheless pretty good. One of my tickets opened on a Friday afternoon at 2:17PM was not responded at 7:12PM, and because it involved Jeremiah, the ticket was not responded until Monday (I guess Jeremiah does get the weekend off). However, a more “conventional” issue (in my case, enable TUN/TAP) was responded very quickly, the ticket was opened on a Saturday at 20:32PM and was responded and resolved by 23:05PM, which is not bad for a budget provider at all.
Conclusion
Great data centre location (for me at least), good VPS, and great network is how I feel about BuffloVPS. Granted the disk I/O could be improved, and perhaps the ticket response time is not the fastest I have ever seen, however both are acceptable and for 40USD per year, this is really a bargain. I ended up using it as a production VPS (although the projects themselves are half-dead, I was definitely looking around for a decent place to host what was once my blood and tears, I mean, my brains and wits) and so far I am happy with it and would definitely recommend to anyone who is in a similar situation as me.