96MB Low End VPS Review Part XXVIII – VMPort
It has been a while since I review various low end VPS providers online, and one of the more contentious topic in the low end VPS community is whether Xen or OpenVZ could perform better with similar specifications. One of the Xen providers who I have reviewed before had a friendly discussion with Ashley in VMPort on the Xen Vs. OpenVZ issue and asked me to provide a review on their OpenVZ VPS to see how the performance is.
General Information and Set Up
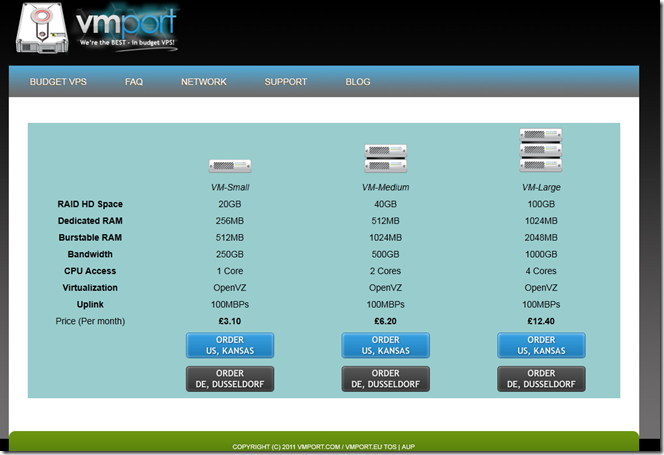
VMPort has recently updated their website and according to Ashley, it was the first time she has tried to play around building a website and apparently it went really well, the new design is actually really good:
Compare to their original design (thanks to LowEndBox.com), this new design is definitely a lot more elegant and right to the point.
For GBP 3.10 per month, here is what you get:
Although with promo code: WHT10OFF, you get 10% off one time discount, which brings the price down to 2.79GBP for the first month.
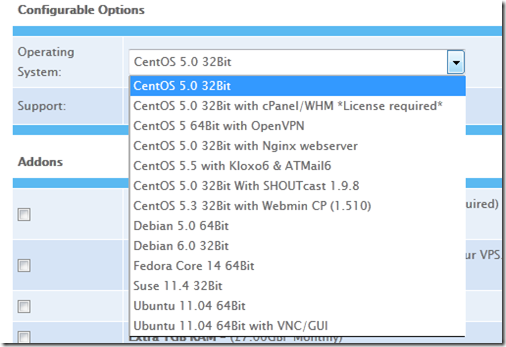
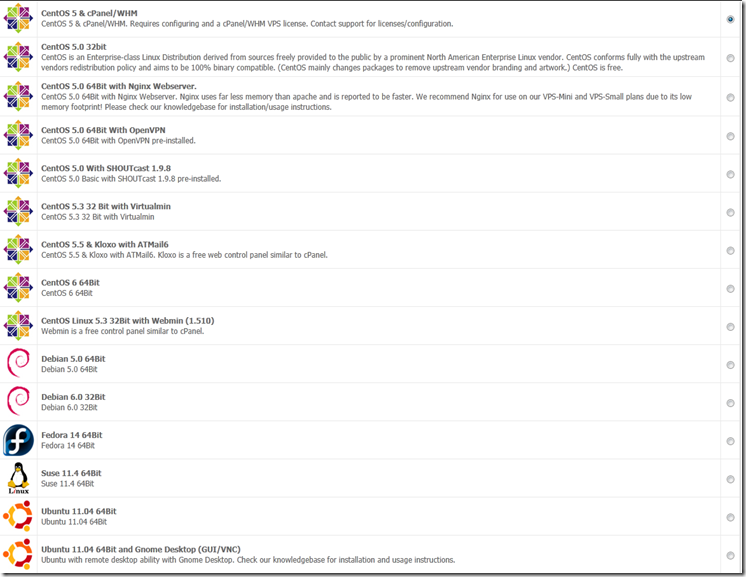
Sign up process via HTTPS connection is pretty straight forward and there are quite a few OS choices available:
Note that there are actually templates with Nginx web server, which is my favourite website and what is used to host this blog, although many providers offers LAMP out of box as one of their OS templates, offering LNMP is definitely a great option on the low end VPS. There is also Shoutcast and OpenVPN templates available as well.
By default, the server is not managed, and management option is available for GBP 4 per month.
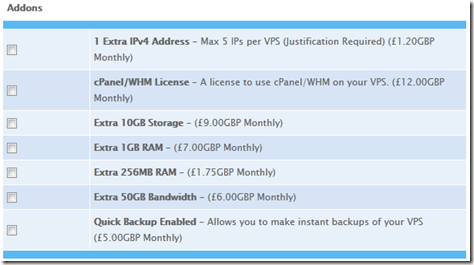
Addon options are pretty standard:
Provision of the VPS was instant and my VPS was online the minute I have received the Paypal receipt.
The welcome email is different from what the standard template emails that most of the providers give, and contains a lot more information.
For example, at the very beginning, it has the links to documentations on how to get started:
At the end of the email, there are also some very detailed descriptions on the management options and what they entitles to:
Although the last line of the email is pretty interesting, you will be fined for 5 bucks if you put your ticket as a top priority when your VPS is not down, although how strictly they would enforce such policy to those non-abusers would be something I would be curious to know.
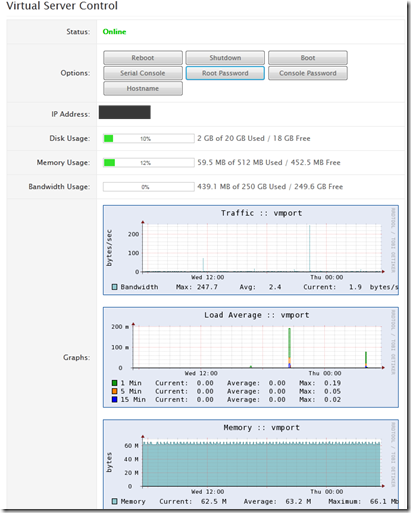
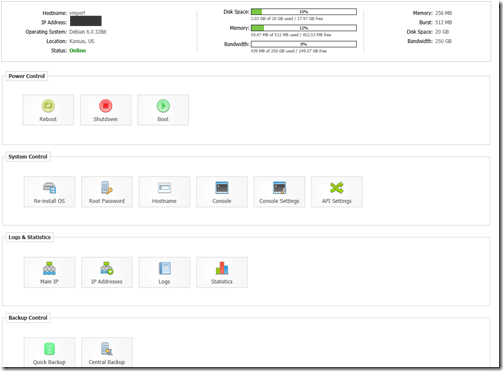
After login to the WHMCS control panel (which by the way, has a really nice icon set), via HTTP connection, the details of the VPS could be found under My Services:
Note that all usage graphs and percentage bars are available, and standard functionalities to control the VPS are available as well. I have tried to reset the Hostname and Root Password, both of which worked.
SolusVM is on non-standard HTTP port and once logged in, a pretty standard user interface is shown:
Both backup options are not available, there is no instant rDNS and nowhere I can see IPv6 addresses as well.
There are quite a few OS templates available, although the most impressive part is their collection of CentOS templates that has things like CentOS + Nginx and CentOS + OpenVPN:
Furthermore, there is also documentations in their knowledgebase for Nginx set up, which is really great. Many unmanaged providers failed to see the importance of providing documentations, and therefore ended up having customers who does not know a lot about Linux unsatisfied for the services because “nothing works”. In that regard, VMPort has done a far more better job than many unmanaged providers.
Test on the VPS
As mentioned above, the test VPS that I have has 256MB of dedicated memory and 512MB of swap memory, I have put Debian 6 32 bit for testing purposes and the VPS is located in Wholesale Internet in Kansas, MO, in US.
When doing a fresh OS install, about 12MB of memory were used:
free -m
             total       used       free     shared    buffers     cached
Mem:           512         16        495          0          0          0
-/+ buffers/cache:         16        495
Swap:            0          0          0
Corresponding top output showing the processes running:
top - 06:55:42 up 4 min,  1 user,  load average: 0.05, 0.11, 0.05
Tasks:  14 total,   2 running,  12 sleeping,   0 stopped,   0 zombie
Cpu(s):  0.0%us,  0.0%sy,  0.0%ni,100.0%id,  0.0%wa,  0.0%hi,  0.0%si,  0.0%st
Mem:    524288k total,    17008k used,   507280k free,        0k buffers
Swap:        0k total,        0k used,        0k free,        0k cached

  PID USER      PR  NI  VIRT  RES  SHR S %CPU %MEM    TIME+  COMMAND
 1631 root      16   0  8756 3116 2468 R  0.0  0.6   0:00.23 sshd
 1383 root      18   0  5132 2432 1180 S  0.0  0.5   0:00.00 apache2
 1384 www-data  25   0  5132 1844  584 S  0.0  0.4   0:00.00 apache2
 1633 root      15   0  2956 1612 1292 S  0.0  0.3   0:00.00 bash
 1588 root      18   0  9964 1548  496 S  0.0  0.3   0:00.00 sendmail-mta
 1641 root      15   0  2324 1064  872 R  0.0  0.2   0:00.00 top
 1603 root      18   0  5484  988  600 S  0.0  0.2   0:00.00 sshd
 1405 root      18   0  2284  844  660 S  0.0  0.2   0:00.00 cron
 1558 root      25   0  2388  836  668 S  0.0  0.2   0:00.00 xinetd
 1354 root      18   0  8664  784  448 S  0.0  0.1   0:00.00 saslauthd
    1 root      15   0  2024  676  584 S  0.0  0.1   0:00.69 init
 1369 root      15   0  1732  608  504 S  0.0  0.1   0:00.00 syslogd
 1373 root      18   0  1676  548  456 S  0.0  0.1   0:00.00 anacron
 1355 root      18   0  8664  500  164 S  0.0  0.1   0:00.00 saslauthd
And a little more than 400MB of hard drive spaces were used:
 df -h
Filesystem            Size  Used Avail Use% Mounted on
/dev/simfs             20G  413M   20G   3% /
tmpfs                 256M     0  256M   0% /lib/init/rw
tmpfs                 256M     0  256M   0% /dev/shm
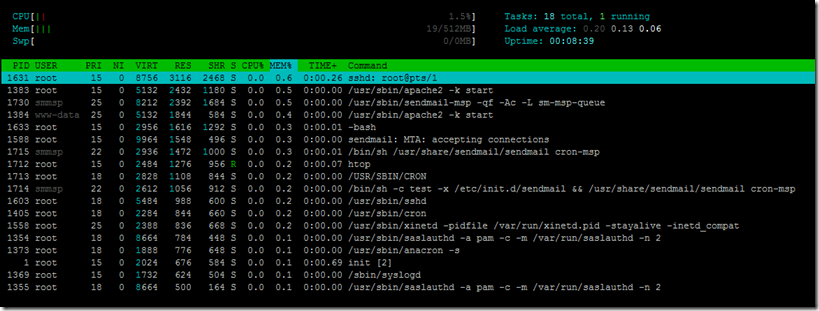
And htop output for those htop fans:
With the full LNMP stack installed, 61MB of memory were used:
free -m
             total       used       free     shared    buffers     cached
Mem:           512         61        450          0          0          0
-/+ buffers/cache:         61        450
Swap:            0          0          0
And the corresponding top output:
top - 21:29:30 up 10:37,  1 user,  load average: 0.00, 0.00, 0.00
Tasks:  21 total,   2 running,  19 sleeping,   0 stopped,   0 zombie
Cpu(s):  0.0%us,  0.0%sy,  0.0%ni,100.0%id,  0.0%wa,  0.0%hi,  0.0%si,  0.0%st
Mem:    524288k total,    63660k used,   460628k free,        0k buffers
Swap:        0k total,        0k used,        0k free,        0k cached

  PID USER      PR  NI  VIRT  RES  SHR S %CPU %MEM    TIME+  COMMAND
28111 www       25   0 14496  10m  412 S  0.0  2.0   0:00.01 nginx
15910 mysql     19   0 34792 5828 3152 S  0.0  1.1   0:00.00 mysqld
28102 root      18   0 22700 4540 1380 S  0.0  0.9   0:00.00 php-cgi
28103 www       25   0 22700 4160 1000 S  0.0  0.8   0:00.00 php-cgi
28104 www       25   0 22700 4160 1000 S  0.0  0.8   0:00.00 php-cgi
28105 www       25   0 22700 4160 1000 S  0.0  0.8   0:00.00 php-cgi
28106 www       25   0 22700 4160 1000 S  0.0  0.8   0:00.00 php-cgi
28107 www       25   0 22700 4160 1000 S  0.0  0.8   0:00.00 php-cgi
29920 root      15   0  8752 3116 2472 R  0.0  0.6   0:00.26 sshd
29922 root      15   0  2956 1612 1292 S  0.0  0.3   0:00.00 bash
 1588 root      18   0  9964 1548  496 S  0.0  0.3   0:00.05 sendmail-mta
15807 root      25   0  2680 1212 1000 S  0.0  0.2   0:00.00 mysqld_safe
29930 root      15   0  2324 1076  876 R  0.0  0.2   0:00.08 top
 1603 root      18   0  5484  988  600 S  0.0  0.2   0:00.00 sshd
 1405 root      15   0  2284  848  664 S  0.0  0.2   0:00.00 cron
 1558 root      25   0  2388  836  668 S  0.0  0.2   0:00.00 xinetd
 1354 root      18   0  8664  784  448 S  0.0  0.1   0:00.00 saslauthd
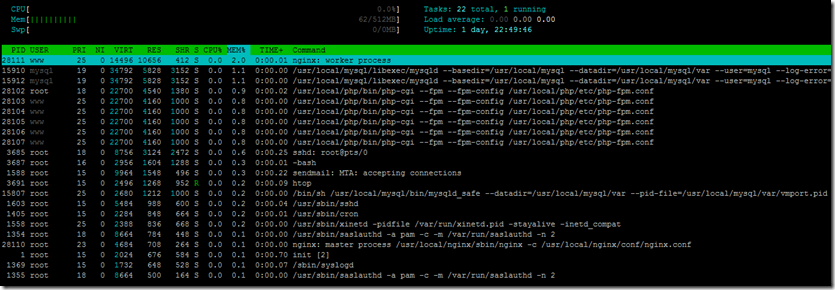
And the corresponding htop output:
Approximately 1.7GB of hard drive space were used:
df -h
Filesystem            Size  Used Avail Use% Mounted on
/dev/simfs             20G  1.7G   19G   9% /
tmpfs                 256M     0  256M   0% /lib/init/rw
tmpfs                 256M     0  256M   0% /dev/shm
Vmstat shows the VPS is relatively little used:
vmstat
procs -----------memory---------- ---swap-- -----io---- -system-- ----cpu----
 r  b   swpd   free   buff  cache   si   so    bi    bo   in   cs us sy id wa
 0  0      0 460304      0      0    0    0     0    31    0   11  3  1 96  0
And similar results were shown with the uptime output:
uptime
 21:11:41 up 1 day, 15:42,  1 user,  load average: 0.00, 0.00, 0.00
Beancounters have pretty reasonable settings:
cat /proc/user_beancounters
Version: 2.5
       uid  resource                     held              maxheld              barrier                limit              failcnt
      186:  kmemsize                  2848349             13681884           2147483646           2147483646                    0
            lockedpages                     0                    0               999999               999999                    0
            privvmpages                 15973                53467               131072               131072                    0
            shmpages                      642                  672                65536                65536                    0
            dummy                           0                    0                    0                    0                    0
            numproc                        22                   47               999999               999999                    0
            physpages                    7238                36710                    0           2147483647                    0
            vmguarpages                     0                    0                65536           2147483647                    0
            oomguarpages                 7238                36710                65536           2147483647                    0
            numtcpsock                      6                    9              7999992              7999992                    0
            numflock                        4                   11               999999               999999                    0
            numpty                          1                    2               500000               500000                    0
            numsiginfo                      0                    6               999999               999999                    0
            tcpsndbuf                  107352              6518192            214748160            396774400                    0
            tcprcvbuf                   98304              1739304            214748160            396774400                    0
            othersockbuf                11640                29096            214748160            396774400                    0
            dgramrcvbuf                     0                 8472            214748160            396774400                    0
            numothersock                   14                   18              7999992              7999992                    0
            dcachesize                      0                    0           2147483646           2147483646                    0
            numfile                       531                  913             23999976             23999976                    0
            dummy                           0                    0                    0                    0                    0
            dummy                           0                    0                    0                    0                    0
            dummy                           0                    0                    0                    0                    0
            numiptent                      14                   14               999999               999999                    0
Vzfree shows no sign of overselling as well:
vzfree
             Total     Used     Free
Kernel:   2048.00M    2.72M 2045.28M
Allocate:  512.00M   62.38M  449.62M (256M Guaranteed)
Commit:    256.00M   30.97M  225.03M (45.3% of Allocated)
Swap:                 0.00M          (0.0% of Committed)
Meminfo does not really give any new information:
cat /proc/meminfo
MemTotal:       524288 kB
MemFree:        460112 kB
Buffers:             0 kB
Cached:              0 kB
SwapCached:          0 kB
Active:              0 kB
Inactive:            0 kB
HighTotal:           0 kB
HighFree:            0 kB
LowTotal:       524288 kB
LowFree:        460112 kB
SwapTotal:           0 kB
SwapFree:            0 kB
Dirty:             260 kB
Writeback:           0 kB
AnonPages:           0 kB
Mapped:              0 kB
Slab:                0 kB
PageTables:          0 kB
NFS_Unstable:        0 kB
Bounce:              0 kB
CommitLimit:         0 kB
Committed_AS:        0 kB
VmallocTotal:        0 kB
VmallocUsed:         0 kB
VmallocChunk:        0 kB
HugePages_Total:     0
HugePages_Free:      0
HugePages_Rsvd:      0
Hugepagesize:     2048 kB
Output of cpuinfo shows that one core was offered:
cat /proc/cpuinfo
processor       : 0
vendor_id       : AuthenticAMD
cpu family      : 16
model           : 4
model name      : AMD Phenom(tm) II X4 965 Processor
stepping        : 3
cpu MHz         : 1700.107
cache size      : 512 KB
physical id     : 0
siblings        : 4
core id         : 0
cpu cores       : 4
apicid          : 0
fpu             : yes
fpu_exception   : yes
cpuid level     : 5
wp              : yes
flags           : fpu vme de pse tsc msr pae mce cx8 apic sep mtrr pge mca cmov                                                                              pat pse36 clflush mmx fxsr sse sse2 ht syscall nx mmxext fxsr_opt pdpe1gb rdtscp                                                                              lm 3dnowext 3dnow constant_tsc nonstop_tsc pni cx16 popcnt lahf_lm cmp_legacy s                                                                             vm extapic cr8_legacy altmovcr8 abm sse4a misalignsse 3dnowprefetch osvw
bogomips        : 6800.42
TLB size        : 1024 4K pages
clflush size    : 64
cache_alignment : 64
address sizes   : 48 bits physical, 48 bits virtual
power management: ts ttp tm stc 100mhzsteps hwpstate [8]
And the time sync info:
time sync

real    0m0.014s
user    0m0.002s
sys     0m0.000s
Disk I/O, although not the best I have seen, is pretty consistent:
dd if=/dev/zero of=test bs=64k count=16k conv=fdatasync
16384+0 records in
16384+0 records out
1073741824 bytes (1.1 GB) copied, 18.5245 s, 58.0 MB/s
And running it again later on shows almost the same I/O:
dd if=/dev/zero of=test bs=64k count=16k conv=fdatasync
16384+0 records in
16384+0 records out
1073741824 bytes (1.1 GB) copied, 18.2727 s, 58.8 MB/s
The network speed of the VPS is pretty solid, I was able to get close to 10MB/s, which is not bad at all for a 100mbit connection:
wget cachefly.cachefly.net/100mb.test -O /dev/null
--2011-09-01 21:18:04--  http://cachefly.cachefly.net/100mb.test
Resolving cachefly.cachefly.net... 205.234.175.175
Connecting to cachefly.cachefly.net|205.234.175.175|:80... connected.
HTTP request sent, awaiting response... 200 OK
Length: 104857600 (100M) [application/octet-stream]
Saving to: `/dev/null'

100%[======================================>] 104,857,600 9.66M/s   in 10s

2011-09-01 21:18:15 (9.84 MB/s) - `/dev/null' saved [104857600/104857600]
Upload speed varies, with my Nix Communications’ VPS in Montreal, Canada showing the slowest speed since it is at the east coast:
wget 74.91.24.59/100mb.test -O /dev/null
--2011-09-01 22:53:06--  http://74.91.24.59/100mb.test
Connecting to 74.91.24.59:80... connected.
HTTP request sent, awaiting response... 200 OK
Length: 104857600 (100M) [application/octet-stream]
Saving to: `/dev/null'

100%[======================================>] 104,857,600 1.16M/s   in 90s

2011-09-01 22:54:36 (1.12 MB/s) - `/dev/null' saved [104857600/104857600]
My BuyVM VPS in San Jose, CA, showing a really good speed as it is along the west coast:
 wget 74.91.24.59/100mb.test -O /dev/null
--2011-09-01 10:57:53--  http://74.91.24.59/100mb.test
Connecting to 74.91.24.59:80... connected.
HTTP request sent, awaiting response... 200 OK
Length: 104857600 (100M) [application/octet-stream]
Saving to: `/dev/null'

100%[======================================>] 104,857,600 4.75M/s   in 14s

2011-09-01 10:58:07 (7.23 MB/s) - `/dev/null' saved [104857600/104857600]
And finally, my Quickweb VPS in London, UK:
wget 74.91.24.59/100mb.test -O /dev/null --2011-09-01 10:57:53-- http://74.91.24.59/100mb.test Connecting to 74.91.24.59:80... connected. HTTP request sent, awaiting response... 200 OK Length: 104857600 (100M) [application/octet-stream] Saving to: `/dev/null' 100%[======================================>] 104,857,600 4.75M/s in 14s 2011-09-01 10:58:07 (7.23 MB/s) - `/dev/null' saved [104857600/104857600]
Correction: My big fat finger failed to hit Ctrl+C properly, here is the correct output:
wget 74.91.24.59/100mb.test -O /dev/null
--2011-09-01 10:57:00--  http://74.91.24.59/100mb.test
Connecting to 74.91.24.59:80... connected.
HTTP request sent, awaiting response... 200 OK
Length: 104857600 (100M) [application/octet-stream]
Saving to: `/dev/null'

100%[======================================>] 104,857,600 11.2M/s   in 15s

2011-09-01 10:57:16 (6.48 MB/s) - `/dev/null' saved [104857600/104857600]
Finally, for the benchmarks. As a single core VPS, the unit did OK in UnixBench, although by no means impressive:
   #    #  #    #  #  #    #          #####   ######  #    #   ####   #    #
   #    #  ##   #  #   #  #           #    #  #       ##   #  #    #  #    #
   #    #  # #  #  #    ##            #####   #####   # #  #  #       ######
   #    #  #  # #  #    ##            #    #  #       #  # #  #       #    #
   #    #  #   ##  #   #  #           #    #  #       #   ##  #    #  #    #
    ####   #    #  #  #    #          #####   ######  #    #   ####   #    #

   Version 5.1.3                      Based on the Byte Magazine Unix Benchmark

   Multi-CPU version                  Version 5 revisions by Ian Smith,
                                      Sunnyvale, CA, USA
   January 13, 2011                   johantheghost at yahoo period com

1 x Dhrystone 2 using register variables  1 2 3 4 5 6 7 8 9 10

1 x Double-Precision Whetstone  1 2 3 4 5 6 7 8 9 10

1 x Execl Throughput  1 2 3

1 x File Copy 1024 bufsize 2000 maxblocks  1 2 3

1 x File Copy 256 bufsize 500 maxblocks  1 2 3

1 x File Copy 4096 bufsize 8000 maxblocks  1 2 3

1 x Pipe Throughput  1 2 3 4 5 6 7 8 9 10

1 x Pipe-based Context Switching  1 2 3 4 5 6 7 8 9 10

1 x Process Creation  1 2 3

1 x System Call Overhead  1 2 3 4 5 6 7 8 9 10

1 x Shell Scripts (1 concurrent)  1 2 3

1 x Shell Scripts (8 concurrent)  1 2 3

========================================================================
   BYTE UNIX Benchmarks (Version 5.1.3)

   System: vmport: GNU/Linux
   OS: GNU/Linux -- 2.6.32-238.12.1.el5.028stab091.1 -- #1 SMP Wed Jun 1 13:20:25 MSD 2011
   Machine: i686 (unknown)
   Language: en_US.utf8 (charmap="ANSI_X3.4-1968", collate="ANSI_X3.4-1968")
   CPU 0: AMD Phenom(tm) II X4 965 Processor (6800.4 bogomips)
          Hyper-Threading, x86-64, MMX, AMD MMX, Physical Address Ext, SYSENTER/SYSEXIT, AMD virtualization, SYSCALL/SYSRET
   21:19:35 up 1 day, 15:49,  1 user,  load average: 0.00, 0.03, 0.00; runlevel 2

------------------------------------------------------------------------
Benchmark Run: Thu Sep 01 2011 21:19:35 - 21:49:21
1 CPU in system; running 1 parallel copy of tests

Dhrystone 2 using register variables        4753746.6 lps   (10.0 s, 7 samples)
Double-Precision Whetstone                     1678.9 MWIPS (10.5 s, 7 samples)
Execl Throughput                               2046.7 lps   (29.7 s, 2 samples)
File Copy 1024 bufsize 2000 maxblocks        257057.6 KBps  (30.0 s, 2 samples)
File Copy 256 bufsize 500 maxblocks           87675.5 KBps  (30.0 s, 2 samples)
File Copy 4096 bufsize 8000 maxblocks        488295.4 KBps  (30.0 s, 2 samples)
Pipe Throughput                              543844.5 lps   (10.0 s, 7 samples)
Pipe-based Context Switching                 124690.0 lps   (10.0 s, 7 samples)
Process Creation                               3959.5 lps   (30.0 s, 2 samples)
Shell Scripts (1 concurrent)                   1553.3 lpm   (60.1 s, 2 samples)
Shell Scripts (8 concurrent)                    249.4 lpm   (60.1 s, 2 samples)
System Call Overhead                         452660.2 lps   (10.0 s, 7 samples)

System Benchmarks Index Values               BASELINE       RESULT    INDEX
Dhrystone 2 using register variables         116700.0    4753746.6    407.3
Double-Precision Whetstone                       55.0       1678.9    305.3
Execl Throughput                                 43.0       2046.7    476.0
File Copy 1024 bufsize 2000 maxblocks          3960.0     257057.6    649.1
File Copy 256 bufsize 500 maxblocks            1655.0      87675.5    529.8
File Copy 4096 bufsize 8000 maxblocks          5800.0     488295.4    841.9
Pipe Throughput                               12440.0     543844.5    437.2
Pipe-based Context Switching                   4000.0     124690.0    311.7
Process Creation                                126.0       3959.5    314.2
Shell Scripts (1 concurrent)                     42.4       1553.3    366.3
Shell Scripts (8 concurrent)                      6.0        249.4    415.7
System Call Overhead                          15000.0     452660.2    301.8
                                                                   ========
System Benchmarks Index Score                                         424.0
Testing again gives pretty consistent results:
   #    #  #    #  #  #    #          #####   ######  #    #   ####   #    #
   #    #  ##   #  #   #  #           #    #  #       ##   #  #    #  #    #
   #    #  # #  #  #    ##            #####   #####   # #  #  #       ######
   #    #  #  # #  #    ##            #    #  #       #  # #  #       #    #
   #    #  #   ##  #   #  #           #    #  #       #   ##  #    #  #    #
    ####   #    #  #  #    #          #####   ######  #    #   ####   #    #

   Version 5.1.3                      Based on the Byte Magazine Unix Benchmark

   Multi-CPU version                  Version 5 revisions by Ian Smith,
                                      Sunnyvale, CA, USA
   January 13, 2011                   johantheghost at yahoo period com

1 x Dhrystone 2 using register variables  1 2 3 4 5 6 7 8 9 10

1 x Double-Precision Whetstone  1 2 3 4 5 6 7 8 9 10

1 x Execl Throughput  1 2 3

1 x File Copy 1024 bufsize 2000 maxblocks  1 2 3

1 x File Copy 256 bufsize 500 maxblocks  1 2 3

1 x File Copy 4096 bufsize 8000 maxblocks  1 2 3

1 x Pipe Throughput  1 2 3 4 5 6 7 8 9 10

1 x Pipe-based Context Switching  1 2 3 4 5 6 7 8 9 10

1 x Process Creation  1 2 3

1 x System Call Overhead  1 2 3 4 5 6 7 8 9 10

1 x Shell Scripts (1 concurrent)  1 2 3

1 x Shell Scripts (8 concurrent)  1 2 3

========================================================================
   BYTE UNIX Benchmarks (Version 5.1.3)

   System: vmport: GNU/Linux
   OS: GNU/Linux -- 2.6.32-238.12.1.el5.028stab091.1 -- #1 SMP Wed Jun 1 13:20:25 MSD 2011
   Machine: i686 (unknown)
   Language: en_US.utf8 (charmap="ANSI_X3.4-1968", collate="ANSI_X3.4-1968")
   CPU 0: AMD Phenom(tm) II X4 965 Processor (6800.4 bogomips)
          Hyper-Threading, x86-64, MMX, AMD MMX, Physical Address Ext, SYSENTER/SYSEXIT, AMD virtualization, SYSCALL/SYSRET
   22:09:10 up 1 day, 16:39,  1 user,  load average: 0.00, 0.08, 0.53; runlevel 2

------------------------------------------------------------------------
Benchmark Run: Thu Sep 01 2011 22:09:10 - 22:38:54
1 CPU in system; running 1 parallel copy of tests

Dhrystone 2 using register variables        4702220.3 lps   (10.0 s, 7 samples)
Double-Precision Whetstone                     1518.3 MWIPS (9.8 s, 7 samples)
Execl Throughput                               1759.0 lps   (30.0 s, 2 samples)
File Copy 1024 bufsize 2000 maxblocks        254350.8 KBps  (30.0 s, 2 samples)
File Copy 256 bufsize 500 maxblocks           76412.0 KBps  (30.0 s, 2 samples)
File Copy 4096 bufsize 8000 maxblocks        402112.5 KBps  (30.0 s, 2 samples)
Pipe Throughput                              502623.9 lps   (10.0 s, 7 samples)
Pipe-based Context Switching                 126734.4 lps   (10.0 s, 7 samples)
Process Creation                               3759.5 lps   (30.0 s, 2 samples)
Shell Scripts (1 concurrent)                   1988.9 lpm   (60.0 s, 2 samples)
Shell Scripts (8 concurrent)                    222.8 lpm   (60.2 s, 2 samples)
System Call Overhead                         493027.5 lps   (10.0 s, 7 samples)

System Benchmarks Index Values               BASELINE       RESULT    INDEX
Dhrystone 2 using register variables         116700.0    4702220.3    402.9
Double-Precision Whetstone                       55.0       1518.3    276.1
Execl Throughput                                 43.0       1759.0    409.1
File Copy 1024 bufsize 2000 maxblocks          3960.0     254350.8    642.3
File Copy 256 bufsize 500 maxblocks            1655.0      76412.0    461.7
File Copy 4096 bufsize 8000 maxblocks          5800.0     402112.5    693.3
Pipe Throughput                               12440.0     502623.9    404.0
Pipe-based Context Switching                   4000.0     126734.4    316.8
Process Creation                                126.0       3759.5    298.4
Shell Scripts (1 concurrent)                     42.4       1988.9    469.1
Shell Scripts (8 concurrent)                      6.0        222.8    371.3
System Call Overhead                          15000.0     493027.5    328.7
                                                                   ========
System Benchmarks Index Score                                         406.7
I am not sure how many people have noticed, but GeekBench for Linux has recently updated to version 2.2, I was fortunate enough to have both version 2.1 and 2.2 downloaded on this VPS and decided to run GeekBench against both versions to see the performance:
Using version 2.2, the score is significantly lower:
System Information
  Operating System      Linux 2.6.32-238.12.1.el5.028stab091.1 i686
  Model                 N/A
  Motherboard           N/A
  Processor             AMD Phenom II X4 965 Black Edition @ 0.00 Hz
                        1 Processor
  Processor ID          AuthenticAMD Family 16 Model 4 Stepping 3
  L1 Instruction Cache  64.0 KB
  L1 Data Cache         64.0 KB
  L2 Cache              512 KB
  L3 Cache              6.00 MB
  Memory                7.54 GB N/A
  BIOS                  N/A

Integer
  Blowfish
    single-threaded scalar   1438 |||||
  Text Compress
    single-threaded scalar   1044 ||||
  Text Decompress
    single-threaded scalar   1157 ||||
  Image Compress
    single-threaded scalar   1129 ||||
  Image Decompress
    single-threaded scalar   1149 ||||
  Lua
    single-threaded scalar   1478 |||||

Floating Point
  Mandelbrot
    single-threaded scalar    971 |||
  Dot Product
    single-threaded scalar   1165 ||||
    single-threaded vector   2219 ||||||||
  LU Decomposition
    single-threaded scalar   1088 ||||
  Primality Test
    single-threaded scalar   1156 ||||
  Sharpen Image
    single-threaded scalar   4454 |||||||||||||||||
  Blur Image
    single-threaded scalar   4015 ||||||||||||||||

Memory
  Read Sequential
    single-threaded scalar   1355 |||||
  Write Sequential
    single-threaded scalar   2047 ||||||||
  Stdlib Allocate
    single-threaded scalar   1545 ||||||
  Stdlib Write
    single-threaded scalar   1079 ||||
  Stdlib Copy
    single-threaded scalar   1426 |||||

Stream
  Stream Copy
    single-threaded scalar   1527 ||||||
    single-threaded vector   1850 |||||||
  Stream Scale
    single-threaded scalar   1246 ||||
    single-threaded vector   1779 |||||||
  Stream Add
    single-threaded scalar   1565 ||||||
    single-threaded vector   1770 |||||||
  Stream Triad
    single-threaded scalar   1686 ||||||
    single-threaded vector   1309 |||||

Benchmark Summary
  Integer Score              1232 ||||
  Floating Point Score       2152 ||||||||
  Memory Score               1490 |||||
  Stream Score               1591 ||||||

  Geekbench Score            1641 ||||||
Trying again gives pretty consistent results:
System Information
  Operating System      Linux 2.6.32-238.12.1.el5.028stab091.1 i686
  Model                 N/A
  Motherboard           N/A
  Processor             AMD Phenom II X4 965 Black Edition @ 0.00 Hz
                        1 Processor
  Processor ID          AuthenticAMD Family 16 Model 4 Stepping 3
  L1 Instruction Cache  64.0 KB
  L1 Data Cache         64.0 KB
  L2 Cache              512 KB
  L3 Cache              6.00 MB
  Memory                7.54 GB N/A
  BIOS                  N/A

Integer
  Blowfish
    single-threaded scalar   1194 ||||
  Text Compress
    single-threaded scalar    912 |||
  Text Decompress
    single-threaded scalar   1073 ||||
  Image Compress
    single-threaded scalar   1405 |||||
  Image Decompress
    single-threaded scalar    901 |||
  Lua
    single-threaded scalar   1475 |||||

Floating Point
  Mandelbrot
    single-threaded scalar    811 |||
  Dot Product
    single-threaded scalar   1132 ||||
    single-threaded vector   2236 ||||||||
  LU Decomposition
    single-threaded scalar   1135 ||||
  Primality Test
    single-threaded scalar   1108 ||||
  Sharpen Image
    single-threaded scalar   4817 |||||||||||||||||||
  Blur Image
    single-threaded scalar   4474 |||||||||||||||||

Memory
  Read Sequential
    single-threaded scalar   1285 |||||
  Write Sequential
    single-threaded scalar   1948 |||||||
  Stdlib Allocate
    single-threaded scalar   1545 ||||||
  Stdlib Write
    single-threaded scalar   1145 ||||
  Stdlib Copy
    single-threaded scalar   1202 ||||

Stream
  Stream Copy
    single-threaded scalar   1614 ||||||
    single-threaded vector   1728 ||||||
  Stream Scale
    single-threaded scalar   1205 ||||
    single-threaded vector   1780 |||||||
  Stream Add
    single-threaded scalar   1550 ||||||
    single-threaded vector   1851 |||||||
  Stream Triad
    single-threaded scalar   1598 ||||||
    single-threaded vector   1248 ||||

Benchmark Summary
  Integer Score              1160 ||||
  Floating Point Score       2244 ||||||||
  Memory Score               1425 |||||
  Stream Score               1571 ||||||

  Geekbench Score            1633 ||||||
Using GeenBench 2.1, I was able to get scores as high as 1800:
System Information
  Platform:                  Linux x86 (32-bit)
  Compiler:                  GCC 4.1.2 20070925 (Red Hat 4.1.2-33)
  Operating System:          Linux 2.6.32-238.12.1.el5.028stab091.1 i686
  Model:                     Linux PC (AMD Phenom(tm) II X4 965 Processor)
  Motherboard:               Unknown Motherboard
  Processor:                 AMD Phenom(tm) II X4 965 Processor
  Processor ID:              AuthenticAMD Family 16 Model 4 Stepping 3
  Logical Processors:        1
  Physical Processors:       1
  Processor Frequency:       1.70 GHz
  L1 Instruction Cache:      64.0 KB
  L1 Data Cache:             64.0 KB
  L2 Cache:                  512 KB
  L3 Cache:                  6.00 MB
  Bus Frequency:             0.00 Hz
  Memory:                    7.54 GB
  Memory Type:               N/A
  SIMD:                      1
  BIOS:                      N/A
  Processor Model:           AMD Phenom(tm) II X4 965 Processor
  Processor Cores:           1

Integer
  Blowfish
    single-threaded scalar    2447 |||||||||
    multi-threaded scalar     1099 ||||
  Text Compress
    single-threaded scalar    1003 ||||
    multi-threaded scalar     1010 ||||
  Text Decompress
    single-threaded scalar    1102 ||||
    multi-threaded scalar     1083 ||||
  Image Compress
    single-threaded scalar     919 |||
    multi-threaded scalar      979 |||
  Image Decompress
    single-threaded scalar    1079 ||||
    multi-threaded scalar      838 |||
  Lua
    single-threaded scalar    1657 ||||||
    multi-threaded scalar     1499 |||||

Floating Point
  Mandelbrot
    single-threaded scalar    1005 ||||
    multi-threaded scalar     1075 ||||
  Dot Product
    single-threaded scalar    1462 |||||
    multi-threaded scalar     1621 ||||||
    single-threaded vector    1686 ||||||
    multi-threaded vector     1805 |||||||
  LU Decomposition
    single-threaded scalar    1872 |||||||
    multi-threaded scalar     2828 |||||||||||
  Primality Test
    single-threaded scalar    1330 |||||
    multi-threaded scalar      962 |||
  Sharpen Image
    single-threaded scalar    3848 |||||||||||||||
    multi-threaded scalar     3812 |||||||||||||||
  Blur Image
    single-threaded scalar    3930 |||||||||||||||
    multi-threaded scalar     3647 ||||||||||||||

Memory
  Read Sequential
    single-threaded scalar    2068 ||||||||
  Write Sequential
    single-threaded scalar    2525 ||||||||||
  Stdlib Allocate
    single-threaded scalar    1796 |||||||
  Stdlib Write
    single-threaded scalar    1187 ||||
  Stdlib Copy
    single-threaded scalar    1507 ||||||

Stream
  Stream Copy
    single-threaded scalar    2808 |||||||||||
    single-threaded vector    3477 |||||||||||||
  Stream Scale
    single-threaded scalar    2986 |||||||||||
    single-threaded vector    3239 ||||||||||||
  Stream Add
    single-threaded scalar    2846 |||||||||||
    single-threaded vector    3288 |||||||||||||
  Stream Triad
    single-threaded scalar    3292 |||||||||||||
    single-threaded vector    2504 ||||||||||

Integer Score:                1226 ||||
Floating Point Score:         2205 ||||||||
Memory Score:                 1816 |||||||
Stream Score:                 3055 ||||||||||||

Overall Geekbench Score:      1869 |||||||
Trying again shows slightly lower score, but is still reasonable:
System Information
  Platform:                  Linux x86 (32-bit)
  Compiler:                  GCC 4.1.2 20070925 (Red Hat 4.1.2-33)
  Operating System:          Linux 2.6.32-238.12.1.el5.028stab091.1 i686
  Model:                     Linux PC (AMD Phenom(tm) II X4 965 Processor)
  Motherboard:               Unknown Motherboard
  Processor:                 AMD Phenom(tm) II X4 965 Processor
  Processor ID:              AuthenticAMD Family 16 Model 4 Stepping 3
  Logical Processors:        1
  Physical Processors:       1
  Processor Frequency:       1.70 GHz
  L1 Instruction Cache:      64.0 KB
  L1 Data Cache:             64.0 KB
  L2 Cache:                  512 KB
  L3 Cache:                  6.00 MB
  Bus Frequency:             0.00 Hz
  Memory:                    7.54 GB
  Memory Type:               N/A
  SIMD:                      1
  BIOS:                      N/A
  Processor Model:           AMD Phenom(tm) II X4 965 Processor
  Processor Cores:           1

Integer
  Blowfish
    single-threaded scalar    2464 |||||||||
    multi-threaded scalar     1160 ||||
  Text Compress
    single-threaded scalar    1098 ||||
    multi-threaded scalar     1043 ||||
  Text Decompress
    single-threaded scalar    1274 |||||
    multi-threaded scalar     1017 ||||
  Image Compress
    single-threaded scalar     982 |||
    multi-threaded scalar     1091 ||||
  Image Decompress
    single-threaded scalar     654 ||
    multi-threaded scalar      618 ||
  Lua
    single-threaded scalar    1311 |||||
    multi-threaded scalar     1404 |||||

Floating Point
  Mandelbrot
    single-threaded scalar     928 |||
    multi-threaded scalar     1033 ||||
  Dot Product
    single-threaded scalar    1347 |||||
    multi-threaded scalar     1346 |||||
    single-threaded vector    1362 |||||
    multi-threaded vector     1635 ||||||
  LU Decomposition
    single-threaded scalar    2893 |||||||||||
    multi-threaded scalar     2949 |||||||||||
  Primality Test
    single-threaded scalar    1105 ||||
    multi-threaded scalar      829 |||
  Sharpen Image
    single-threaded scalar    3780 |||||||||||||||
    multi-threaded scalar     3344 |||||||||||||
  Blur Image
    single-threaded scalar    4797 |||||||||||||||||||
    multi-threaded scalar     4423 |||||||||||||||||

Memory
  Read Sequential
    single-threaded scalar    1614 ||||||
  Write Sequential
    single-threaded scalar    2428 |||||||||
  Stdlib Allocate
    single-threaded scalar    1561 ||||||
  Stdlib Write
    single-threaded scalar     901 |||
  Stdlib Copy
    single-threaded scalar    1354 |||||

Stream
  Stream Copy
    single-threaded scalar    2795 |||||||||||
    single-threaded vector    1852 |||||||
  Stream Scale
    single-threaded scalar    2871 |||||||||||
    single-threaded vector    2998 |||||||||||
  Stream Add
    single-threaded scalar    2689 ||||||||||
    single-threaded vector    3085 ||||||||||||
  Stream Triad
    single-threaded scalar    2985 |||||||||||
    single-threaded vector    2306 |||||||||

Integer Score:                1176 ||||
Floating Point Score:         2269 |||||||||
Memory Score:                 1571 ||||||
Stream Score:                 2697 ||||||||||

Overall Geekbench Score:      1789 |||||||
Customer Service and Support
Despite that Ashley seems to be the only one running the show, support is definitely very impressive. My request to enable TUN/TAP was updated barely 3 minutes after I submitted the request on a Saturday (although I was told before that the support was only open during business hours) and was completed within 6 minutes after the initial request was submitted. The next ticket submitted at 11:37AM on a Sunday was resolved by 11:39AM as well. Although none of the ticket were high priority ticket (I do not want to be fined since my server is up and running!), it was definitely replied extremely quickly.
Furthermore, VMPort has an impressive list of documentations in their knowledgebase, which is very helpful in both ways, on one hand, VMPort managed to save a lot of time addressing those types of “noob” questions, but on the other hand, the users will benefit by getting the issues resolved by themselves, which would be a good learning experience for them as well.
Conclusion
Although it would be difficult for me to judge whether Xen or OpenVZ is better and quite frankly speaking, the performance of VMPort VPS are just average using the standard of low end box (although network speed seems really good for 100mbit port), the service they provide is really something that makes them stand out. Excellent documentation and really fast customer service makes VMPort an ideal candidate for people who are new to VPS and who would like to use their VPS as a starting point to learn about virtual servers.




Thanks for the in-depth review 😀
I would love for you to come back in a month or whenever your free to test out our new boxes, your VPS was on one of our first machines and our new line is a lot better.
Kansas – i5 2400s with hardware RAID
Germany – Xeon E3-1240 with hardware RAID
The DD tests were quite good to say that node is at full capacity with only RAID1, good HDDs though 😛
Only other thing i want to point out is im a he not a she haha 😛 and we are a small team of 3 you just happend to get the pleasure of having me answer your tickets 😀
Many, many thanks for the review and i expect to see you back testing our new machines next time and if you give me the heads up or tell me after the review i can refund you.
Cheers,
Ashley Hawkridge
The I5-2400 is a Desktop grade processor that has NO support for ECC memory. Why would you use this as a node hosting many vps’?
I have nothing against using a i5 as a dedicated server but as a node hosting many customers data? Even in the budget vps that does not seem right. Many budget providers are using quad core Xeons and even dual quad core Xeons.
@Luma: I am not sure about the performance of i5, but I have seen some providers here using i7 processors for VPS and the performance is, in fact, better than some of the providers using Xeon processors 🙂 Just an observation.
Because they are a budget provider, you buffoon. Many budget providers do this — though, sure, some use ECC memory.
Ramhost uses (or did for a long time) “desktop grade” CPUs with non-ECC memory and they are rated as one of the top LEB hosts.
If your data is so valuable that you can’t risk a few bit errors per year, you should probably be looking for a VPS that costs 5 bucks a month, chief.
There are quad-core xeons far less powerful than the i5 2400, the xeon name does not make them anything special.
And we don’t host anywhere near as many as most providers host per node.
I don’t see hardly any difference in performance with our xeon E3-1240s.
Agree
You don’t need ECC memory, come on xD
@Yomero: Mmm…why is that so?
The wget upload tests from your BuyVM and Quickweb VPS posted above are the same 😛
@Kuro: Very sharp eyes you have, I have already made the correction, apologies for the error…
works very BAD
i request my many back after 3 days
and have answear “we dont refund”
you have too refund ITS LAW
i will sue you
I agree they should refund you BUT I would love to see someone sue a company over 3 Euro, This would be great!
If the above user is actually Serg thats going round bashing anything with our name on it, here are the facts.
1. He sent in a ticket regarding his VPS been down, it was not a node-wide issue and was out of our business hours been in the UK.
2. He started a dispute with us because we did not responded to the ticket until 4 hours after.
If your going to open a dispute over a 4 hour reply time then why would we have the gratitude to refund you, when it states clearly in our TOS we offer a 24 hour refund period. If you would have given us a chance to actually look into your case, the output would have been different.
And FYI there is no law stating we have to refund you, you agreed to it when you signed up.
Could you jump in a taxi and ask for a refund if you got out half way? No.
Used these guys a good year or less ago for a UK mail server, must say, I had a pretty good time + live support give me a hot discount and tickets were replied to fast.
The server performed perfectly!
@Paul: Good to hear! 🙂
Pingback: 96MB Low End VPS Review Part 48 – VMPort KVM | | 96MB.com96MB.com