
96MB Low End VPS Review Part XXVII – UrgentVPS
Bret from UrgentVPS has emailed me almost a month ago (yes, I know I have been really lagging behind on the requests, but it is getting more and more difficult to sit down and spend time to write reviews these days) to request a review on their OnApp cloud VPS lines that they have pushed out to the public recently. The idea of cloud VPS using OnApp is great, but traditionally it has been mostly restricted to the wealthier clientele with deep pockets, so let’s see how it is.
General Information and Set Up
May be a little off the topic, but the first thing that jumps into my eyes when going to the home page of UrgentVPS is their chat with us windows, which is rather unique:

Although not publicly advertised on their website, UrgentVPS actually has a low end VPS special, and here is what you get for 4.49 Euros per month or 39.95 Dollars per year:
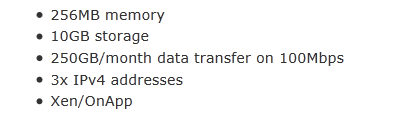
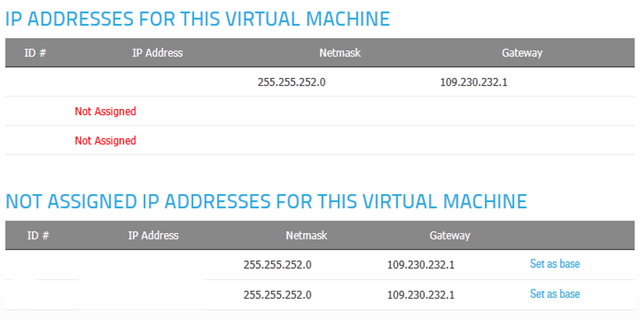
The IP address offered are pretty generous considering the shortage of IPv4 addresses.
The ordering page accept both HTTP and HTTPS connections, which is great if someone needs to make a purchase via, mobile devices since some mobile devices do not support HTTPS connections well.
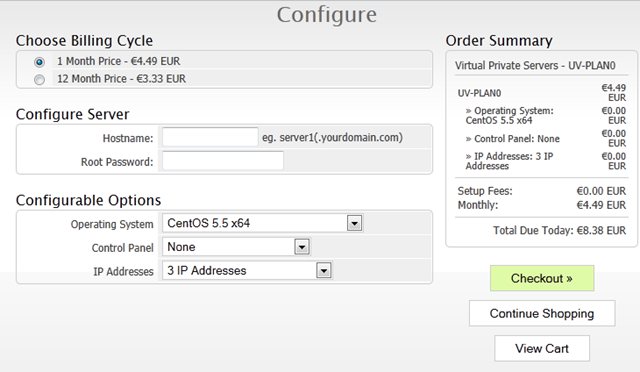
Sign up page is pretty straight forward:
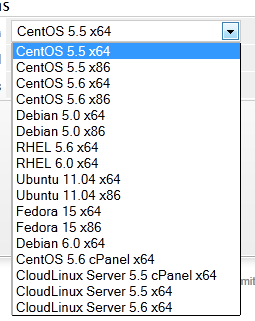
There are several choices of OS available, however interestingly enough for Debian 6, only 64 bit option is available although most of the others have both 32 bit and 64 bit options:
You will need to make sure you select the correct OS during the registration stage since otherwise the only option to reload OS is to email them to rebuild the machine, which will change your IP addresses as well and is likely to take quite a few days (at least with my request to have Debian 6 32 bit OS on).
Provision for the VPS is instant (I actually received my new VPS information email one minute before the Paypal receipt), and their new VPS information email is pretty unique:

As you can see, there is absolutely no information about the VPS revealed in the email, only a link to the client area for you to log in.
After login into the WHMCS area, the details of the VPS is under My Servers tab:
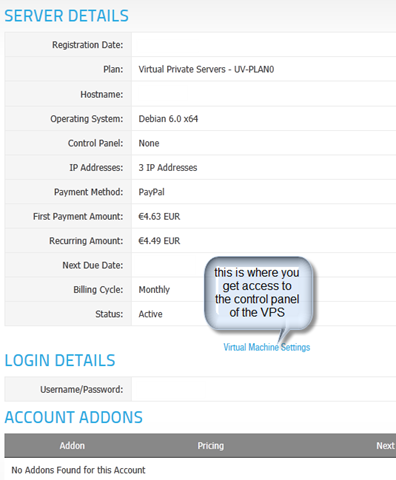
Although it looks most the same as any other WHMCS interface, it actually contains one of the most important link: the control panel for your VPS.
Click on the link, it brings to you the custom panel:
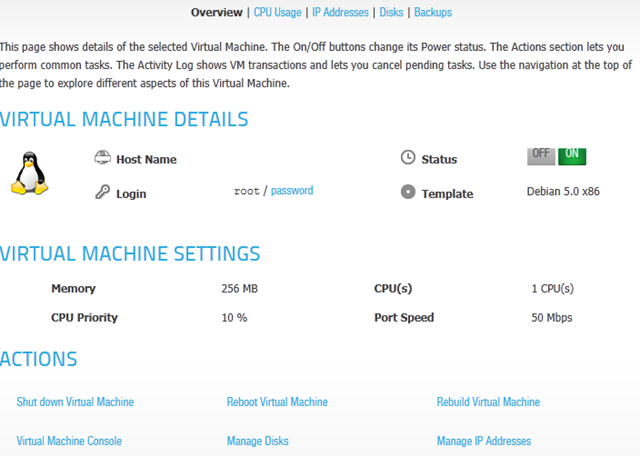
As you can see, on the overview tab, you have the information and basic controls for the VPS. It is also interesting to note that your root password will be revealed if you click on the password link in the login area, which is pretty interesting.
The CPU priority is clearly indicated on the page as well. Although many providers restrict the CPU priority to make sure those who pays big bucks gets better performances, rarely anyone is willing to make the information readily available. One point for their honesty.
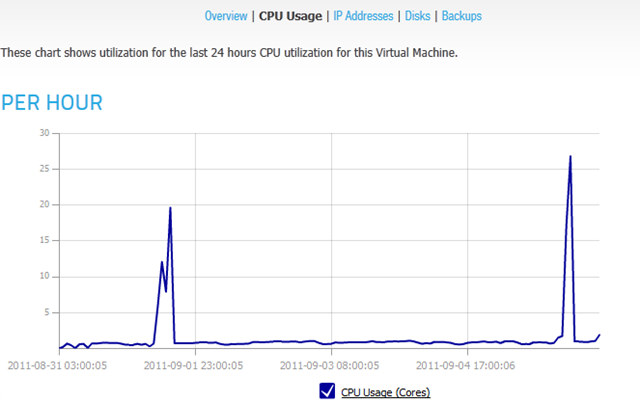
On the CPU usage tab. you basically get to see a graph of the CPU usage:
On the IP addresses page, you are shown with the 3 IPv4 addresses that you are assigned to and you can set them as the base IP address for your VPS:
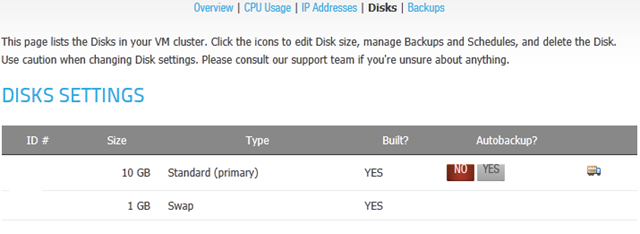
Disk usage shows you the size of the hard drive and the swap space and you can enable and disable auto-backup as well:
And finally, needless to say, backups tab shows the backups made and has the ability to restore the VPS from the backups and delete the backups:
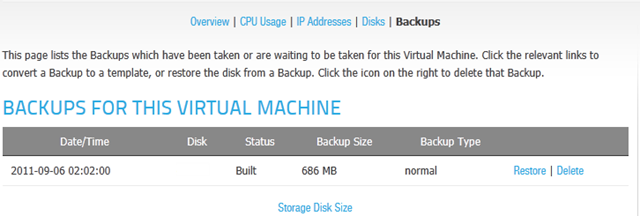
There is obviously no instant rDNS and the inability to trigger manual backups could be an issue when you want to experiment something and make a backup just before that (although I suppose you can disable autobackup and re-enable it to generate a backup), furthermore, reinstall OS is not possible and you will need to submit a ticket to have the entire machine rebuilt with different IP addresses, all these leaves a lot more room for development for this otherwise pretty good-looking control panel.
Tests on the VPS
As mentioned above, the VPS I have received has 256MB of RAM, 1 GB of swap and I have initially put up Debian 6 64 bit for testing but switched to Debian 5 32 bit after my VPS was rebuilt. The VPS is in Interwerk Datacentre in Frankfurt am Main in Germany.
With a fresh OS reload, Debian 6 64 bit used about 27MB of memory:
free -m
             total       used       free     shared    buffers     cached
Mem:           252         66        186          0          2         36
-/+ buffers/cache:         27        225
Swap:         1023          0       1023
And a pretty standard top output:
top - 13:43:05 up 23:05,  1 user,  load average: 0.00, 0.00, 0.00
Tasks:  44 total,   1 running,  43 sleeping,   0 stopped,   0 zombie
Cpu(s):  0.0%us,  0.0%sy,  0.0%ni, 99.7%id,  0.0%wa,  0.0%hi,  0.0%si,  0.3%st
Mem:    258908k total,    68052k used,   190856k free,     2432k buffers
Swap:  1048568k total,        0k used,  1048568k free,    36988k cached

  PID USER      PR  NI  VIRT  RES  SHR S %CPU %MEM    TIME+  COMMAND
  929 root      20   0 70572 3496 2640 S  0.0  1.4   0:00.02 sshd
  933 root      20   0 19216 2000 1524 S  0.0  0.8   0:00.00 bash
  585 root      20   0 54156 1580 1080 S  0.0  0.6   0:00.01 rsyslogd
  938 root      20   0 18932 1272 1000 R  0.0  0.5   0:00.00 top
  640 root      20   0 49168 1144  592 S  0.0  0.4   0:00.01 sshd
  633 root      20   0 22392  880  672 S  0.0  0.3   0:00.08 cron
    1 root      20   0  8352  808  676 S  0.0  0.3   0:00.69 init
  149 root      16  -4 16736  748  384 S  0.0  0.3   0:00.02 udevd
  188 root      18  -2 16732  660  300 S  0.0  0.3   0:00.00 udevd
  195 root      18  -2 16732  660  300 S  0.0  0.3   0:00.00 udevd
  659 root      20   0  5928  632  532 S  0.0  0.2   0:00.00 getty
  611 root      20   0  3916  628  488 S  0.0  0.2   0:00.00 acpid
  660 root      20   0  5928  620  520 S  0.0  0.2   0:00.00 getty
  661 root      20   0  5928  620  520 S  0.0  0.2   0:00.00 getty
  662 root      20   0  5928  620  520 S  0.0  0.2   0:00.00 getty
  664 root      20   0  5928  620  520 S  0.0  0.2   0:00.00 getty
  665 root      20   0  5928  620  520 S  0.0  0.2   0:00.00 getty
About 650MB of disk space is used, which is more than what it takes to install a 32 bit Debian 6 (normally around 400MB in size):
df -h
Filesystem            Size  Used Avail Use% Mounted on
/dev/xvda1            9.9G  648M  8.8G   7% /
tmpfs                 127M     0  127M   0% /lib/init/rw
udev                  110M   80K  110M   1% /dev
tmpfs                 127M     0  127M   0% /dev/shm
Interesting enough though, with the full LNMP stack installed, the 64 bit installation uses almost the same amount of memory as the 32 bit OS:
free -m
             total       used       free     shared    buffers     cached
Mem:           252        230         22          0          6        155
-/+ buffers/cache:         67        185
Swap:         1023          2       1021
And the corresponding top output showing the full LNMP stack running:
top - 23:21:25 up 1 day, 43 min,  1 user,  load average: 0.03, 0.02, 0.00
Tasks:  54 total,   1 running,  53 sleeping,   0 stopped,   0 zombie
Cpu(s):  0.0%us,  0.0%sy,  0.0%ni, 99.9%id,  0.0%wa,  0.0%hi,  0.0%si,  0.1%st
Mem:    258908k total,   236132k used,    22776k free,     7076k buffers
Swap:  1048568k total,     2848k used,  1045720k free,   159588k cached

  PID USER      PR  NI  VIRT  RES  SHR S %CPU %MEM    TIME+  COMMAND
 8651 www       20   0 47140  20m  748 S  0.0  8.0   0:00.02 nginx
22158 mysql     20   0 60948 5932 2104 S  0.0  2.3   0:00.01 mysqld
 8641 root      20   0  106m 5608 1308 S  0.0  2.2   0:00.55 php-cgi
 8642 www       20   0  106m 5172  872 S  0.0  2.0   0:00.00 php-cgi
 8643 www       20   0  106m 5172  872 S  0.0  2.0   0:00.00 php-cgi
 8644 www       20   0  106m 5172  872 S  0.0  2.0   0:00.00 php-cgi
 8645 www       20   0  106m 5172  872 S  0.0  2.0   0:00.00 php-cgi
 8646 www       20   0  106m 5172  872 S  0.0  2.0   0:00.00 php-cgi
 8680 root      20   0 70572 3500 2640 S  0.0  1.4   0:00.02 sshd
 8683 root      20   0 19216 2000 1520 S  0.0  0.8   0:00.01 bash
 8690 root      20   0 18932 1280 1004 R  0.0  0.5   0:00.00 top
  585 root      20   0 54156 1020  784 S  0.0  0.4   0:00.02 rsyslogd
 8649 root      20   0 27808  944  268 S  0.0  0.4   0:00.00 nginx
    1 root      20   0  8352  568  536 S  0.0  0.2   0:00.73 init
  640 root      20   0 49168  568  448 S  0.0  0.2   0:00.02 sshd
22056 root      20   0  3952  528  524 S  0.0  0.2   0:00.01 mysqld_safe
  633 root      20   0 22392  512  448 S  0.0  0.2   0:00.09 cron
And for this LNMP stack to be fully installed, about 2.2GB fo hard drive space was taken out:
df -h
Filesystem            Size  Used Avail Use% Mounted on
/dev/xvda1            9.9G  2.2G  7.3G  23% /
tmpfs                 127M     0  127M   0% /lib/init/rw
udev                  110M   80K  110M   1% /dev
tmpfs                 127M     0  127M   0% /dev/shm
With the 32 bit Debian 5 OS template installed, it is almost the same as the memory usage of Debian 6 64 bit:
free -m
             total       used       free     shared    buffers     cached
Mem:           270        221         49          0         16        142
-/+ buffers/cache:         61        209
Swap:         1023          3       1020
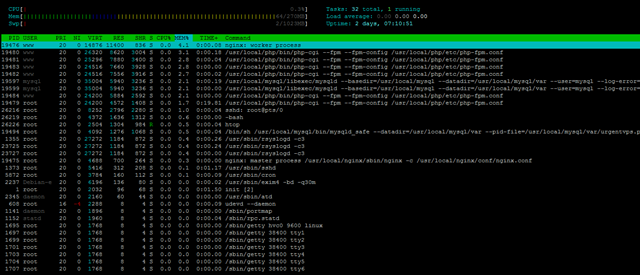
And the corresponding top output:
top - 01:21:42 up 1 day,  2:16,  1 user,  load average: 0.00, 0.00, 0.00
Tasks:  47 total,   1 running,  46 sleeping,   0 stopped,   0 zombie
Cpu(s):  0.0%us,  0.0%sy,  0.0%ni, 99.8%id,  0.0%wa,  0.0%hi,  0.0%si,  0.2%st
Mem:    276980k total,   226700k used,    50280k free,    17284k buffers
Swap:  1048568k total,     3644k used,  1044924k free,   146448k cached

  PID USER      PR  NI  VIRT  RES  SHR S %CPU %MEM    TIME+  COMMAND
19476 www       20   0 14876  11m  836 S  0.0  4.1   0:00.08 nginx
19480 www       20   0 26320 8620 3004 S  0.0  3.1   0:00.18 php-cgi
19481 www       20   0 25296 7880 3400 S  0.0  2.8   0:00.04 php-cgi
19483 www       20   0 24516 7660 3928 S  0.0  2.8   0:00.00 php-cgi
19482 www       20   0 24516 7556 3916 S  0.0  2.7   0:00.02 php-cgi
19597 mysql     20   0 35004 5940 3236 S  0.0  2.1   0:00.20 mysqld
19484 www       20   0 24200 5884 2592 S  0.0  2.1   0:00.00 php-cgi
19479 root      20   0 24200 4572 1408 S  0.0  1.7   0:06.54 php-cgi
20010 root      20   0  8252 2792 2272 S  0.0  1.0   0:00.00 sshd
20013 root      20   0  4368 1636 1312 S  0.0  0.6   0:00.00 bash
19494 root      20   0  4092 1276 1068 S  0.0  0.5   0:00.04 mysqld_safe
 1355 root      20   0 27272 1180  872 S  0.0  0.4   0:00.31 rsyslogd
20018 root      20   0  2332 1120  904 R  0.0  0.4   0:00.00 top
19475 root      20   0  4688  700  264 S  0.0  0.3   0:00.00 nginx
 1373 root      20   0  5416  308  208 S  0.0  0.1   0:00.34 sshd
 5872 root      20   0  3784  160  112 S  0.0  0.1   0:00.10 cron
 2237 Debian-e  20   0  6196  132   80 S  0.0  0.0   0:00.02 exim4
The htop output for htop fans:
And almost the same hard drive space was used as well:
df -h
Filesystem            Size  Used Avail Use% Mounted on
/dev/xvda1            9.9G  2.1G  7.3G  23% /
tmpfs                 136M     0  136M   0% /lib/init/rw
udev                   10M  568K  9.5M   6% /dev
tmpfs                 136M     0  136M   0% /dev/shm
The Inodes limit is set to pretty low, which might caused some issue if you are going to have many small files.
df -i
Filesystem            Inodes   IUsed   IFree IUse% Mounted on
/dev/xvda1            655360   71761  583599   11% /
tmpfs                  34622       4   34618    1% /lib/init/rw
udev                   34622    1023   33599    3% /dev
tmpfs                  34622       1   34621    1% /dev/shm
Vmstat shows the VPS is pretty lightly used:
vmstat
procs -----------memory---------- ---swap-- -----io---- -system-- ----cpu----
 r  b   swpd   free   buff  cache   si   so    bi    bo   in   cs us sy id wa
 0  0   2848  23056   7064 159500    0    0     4    17  172    9  1  0 99  0
And the uptime shows this is pretty much the case as well:
uptime
 23:22:19 up 1 day, 44 min,  1 user,  load average: 0.01, 0.02, 0.00
Cpuinfo shows the VPS was assigned one single core, although it does not seems to be throttled:
cat /proc/cpuinfo
processor       : 0
vendor_id       : GenuineIntel
cpu family      : 6
model           : 26
model name      : Intel(R) Xeon(R) CPU           E5520  @ 2.27GHz
stepping        : 5
cpu MHz         : 2266.746
cache size      : 8192 KB
fpu             : yes
fpu_exception   : yes
cpuid level     : 11
wp              : yes
flags           : fpu de tsc msr pae cx8 sep cmov pat clflush mmx fxsr sse sse2 ss ht syscall nx lm constant_tsc up rep_good nonstop_tsc pni ssse3 cx16 sse4_1 sse4_2 popcnt hypervisor lahf_lm
bogomips        : 4533.49
clflush size    : 64
cache_alignment : 64
address sizes   : 40 bits physical, 48 bits virtual
power management:
And meminfo does not show anything too interesting:
cat /proc/meminfo
MemTotal:         258908 kB
MemFree:            3984 kB
Buffers:            7272 kB
Cached:           181688 kB
SwapCached:         1012 kB
Active:            51328 kB
Inactive:         169880 kB
Active(anon):      15832 kB
Inactive(anon):    16428 kB
Active(file):      35496 kB
Inactive(file):   153452 kB
Unevictable:           0 kB
Mlocked:               0 kB
SwapTotal:       1048568 kB
SwapFree:        1045516 kB
Dirty:                 0 kB
Writeback:             0 kB
AnonPages:         31380 kB
Mapped:             5272 kB
Shmem:                12 kB
Slab:              13344 kB
SReclaimable:       9932 kB
SUnreclaim:         3412 kB
KernelStack:         448 kB
PageTables:         2500 kB
NFS_Unstable:          0 kB
Bounce:                0 kB
WritebackTmp:          0 kB
CommitLimit:     1178020 kB
Committed_AS:     115592 kB
VmallocTotal:   34359738367 kB
VmallocUsed:        3576 kB
VmallocChunk:   34359733892 kB
HardwareCorrupted:     0 kB
HugePages_Total:       0
HugePages_Free:        0
HugePages_Rsvd:        0
HugePages_Surp:        0
Hugepagesize:       2048 kB
DirectMap4k:      262144 kB
DirectMap2M:           0 kB
So are the time sync results:
time sync

real    0m0.040s
user    0m0.000s
sys     0m0.008s
The disk I/O is pretty standard for low end VPS these days, which is in the 50-60 range. A surprise to me since the SAN disks that they are using are supposed to produce really impressive disk I/O:
 dd if=/dev/zero of=test bs=64k count=16k conv=fdatasync
16384+0 records in
16384+0 records out
1073741824 bytes (1.1 GB) copied, 18.1936 s, 59.0 MB/s
Testing it again does not show a lot better results:
dd if=/dev/zero of=test bs=64k count=16k conv=fdatasync
16384+0 records in
16384+0 records out
1073741824 bytes (1.1 GB) copied, 19.3107 s, 55.6 MB/s
The download speed from Cachefly is not really impressive during the first try:
 wget cachefly.cachefly.net/100mb.test -O /dev/null
--2011-09-01 23:25:29--  http://cachefly.cachefly.net/100mb.test
Resolving cachefly.cachefly.net... 205.234.175.175
Connecting to cachefly.cachefly.net|205.234.175.175|:80... connected.
HTTP request sent, awaiting response... 200 OK
Length: 104857600 (100M) [application/octet-stream]
Saving to: dev/null
100%[======================================>] 104,857,600  313K/s   in 3m 26s

2011-09-01 23:29:00 (498 KB/s) - dev/null
However it is a lot better when I decided to give it another shot while I was typing this article:
wget cachefly.cachefly.net/100mb.test -O /dev/null
--2011-09-07 22:57:59--  http://cachefly.cachefly.net/100mb.test
Resolving cachefly.cachefly.net... 205.234.175.175
Connecting to cachefly.cachefly.net|205.234.175.175|:80... connected.
HTTP request sent, awaiting response... 200 OK
Length: 104857600 (100M) [application/octet-stream]
Saving to: â/dev/nullâ

100%[======================================>] 104,857,600 4.87M/s   in 18s

2011-09-07 22:58:17 (5.67 MB/s) - â/dev/nullâ
This is speed is closer to the full port speed of 50mbit.
Upload speed do varies, although they are actually almost always at the low end:
With my Nix Communications VPS in Montreal, Canada:
 wget -O /dev/null 109.230.232.171/100mb.test
--2011-09-06 11:14:08--  http://109.230.232.171/100mb.test
Connecting to 109.230.232.171:80... connected.
HTTP request sent, awaiting response... 200 OK
Length: 104857600 (100M) [application/octet-stream]
Saving to: `/dev/null'

100%[======================================>] 104,857,600 1.08M/s   in 90s

2011-09-06 11:15:38 (1.11 MB/s) - `/dev/null' saved [104857600/104857600]
With my BuyVM VPS in San Jose, CA:
 wget -O /dev/null 109.230.232.171/100mb.test
--2011-09-05 23:11:43--  http://109.230.232.171/100mb.test
Connecting to 109.230.232.171:80... connected.
HTTP request sent, awaiting response... 200 OK
Length: 104857600 (100M) [application/octet-stream]
Saving to: `/dev/null'

100%[======================================>] 104,857,600 4.29M/s   in 35s

2011-09-05 23:12:18 (2.87 MB/s) - `/dev/null' saved [104857600/104857600]
And finally, being in Europe means they definitely have the fastest connection with my Quickweb VPS in London, UK, among all 3 test machines:
 wget -O /dev/null 109.230.232.171/100mb.test
--2011-09-05 23:17:36--  http://109.230.232.171/100mb.test
Connecting to 109.230.232.171:80... connected.
HTTP request sent, awaiting response... 200 OK
Length: 104857600 (100M) [application/octet-stream]
Saving to: `/dev/null'

100%[======================================>] 104,857,600 4.22M/s   in 33s

2011-09-05 23:18:10 (2.99 MB/s) - `/dev/null' saved [104857600/104857600]
The UnixBench marks are pretty low, I guess mostly due to the restricted CPU priority:
   #    #  #    #  #  #    #          #####   ######  #    #   ####   #    #
   #    #  ##   #  #   #  #           #    #  #       ##   #  #    #  #    #
   #    #  # #  #  #    ##            #####   #####   # #  #  #       ######
   #    #  #  # #  #    ##            #    #  #       #  # #  #       #    #
   #    #  #   ##  #   #  #           #    #  #       #   ##  #    #  #    #
    ####   #    #  #  #    #          #####   ######  #    #   ####   #    #

   Version 5.1.3                      Based on the Byte Magazine Unix Benchmark

   Multi-CPU version                  Version 5 revisions by Ian Smith,
                                      Sunnyvale, CA, USA
   January 13, 2011                   johantheghost at yahoo period com

1 x Dhrystone 2 using register variables  1 2 3 4 5 6 7 8 9 10

1 x Double-Precision Whetstone  1 2 3 4 5 6 7 8 9 10

1 x Execl Throughput  1 2 3

1 x File Copy 1024 bufsize 2000 maxblocks  1 2 3

1 x File Copy 256 bufsize 500 maxblocks  1 2 3

1 x File Copy 4096 bufsize 8000 maxblocks  1 2 3

1 x Pipe Throughput  1 2 3 4 5 6 7 8 9 10

1 x Pipe-based Context Switching  1 2 3 4 5 6 7 8 9 10

1 x Process Creation  1 2 3

1 x System Call Overhead  1 2 3 4 5 6 7 8 9 10

1 x Shell Scripts (1 concurrent)  1 2 3

1 x Shell Scripts (8 concurrent)  1 2 3

========================================================================
   BYTE UNIX Benchmarks (Version 5.1.3)

   System: urgentvps: GNU/Linux
   OS: GNU/Linux -- 2.6.32-5-xen-amd64 -- #1 SMP Thu May 19 01:16:47 UTC 2011
   Machine: x86_64 (unknown)
   Language: en_US.utf8 (charmap="UTF-8", collate="UTF-8")
   CPU 0: Intel(R) Xeon(R) CPU E5520 @ 2.27GHz (4533.5 bogomips)
          Hyper-Threading, x86-64, MMX, Physical Address Ext, SYSENTER/SYSEXIT, SYSCALL/SYSRET
   23:42:30 up 1 day,  1:04,  1 user,  load average: 0.00, 0.00, 0.00; runlevel 2

------------------------------------------------------------------------
Benchmark Run: Thu Sep 01 2011 23:42:30 - 00:10:46
1 CPU in system; running 1 parallel copy of tests

Dhrystone 2 using register variables       18790479.5 lps   (10.0 s, 7 samples)
Double-Precision Whetstone                     2690.2 MWIPS (10.0 s, 7 samples)
Execl Throughput                               1300.8 lps   (30.0 s, 2 samples)
File Copy 1024 bufsize 2000 maxblocks        183889.0 KBps  (30.0 s, 2 samples)
File Copy 256 bufsize 500 maxblocks           48961.9 KBps  (30.0 s, 2 samples)
File Copy 4096 bufsize 8000 maxblocks        614719.9 KBps  (30.0 s, 2 samples)
Pipe Throughput                              311232.7 lps   (10.0 s, 7 samples)
Pipe-based Context Switching                  61565.1 lps   (10.0 s, 7 samples)
Process Creation                               2638.3 lps   (30.0 s, 2 samples)
Shell Scripts (1 concurrent)                   2777.5 lpm   (60.0 s, 2 samples)
Shell Scripts (8 concurrent)                    358.5 lpm   (60.1 s, 2 samples)
System Call Overhead                         386989.5 lps   (10.0 s, 7 samples)

System Benchmarks Index Values               BASELINE       RESULT    INDEX
Dhrystone 2 using register variables         116700.0   18790479.5   1610.2
Double-Precision Whetstone                       55.0       2690.2    489.1
Execl Throughput                                 43.0       1300.8    302.5
File Copy 1024 bufsize 2000 maxblocks          3960.0     183889.0    464.4
File Copy 256 bufsize 500 maxblocks            1655.0      48961.9    295.8
File Copy 4096 bufsize 8000 maxblocks          5800.0     614719.9   1059.9
Pipe Throughput                               12440.0     311232.7    250.2
Pipe-based Context Switching                   4000.0      61565.1    153.9
Process Creation                                126.0       2638.3    209.4
Shell Scripts (1 concurrent)                     42.4       2777.5    655.1
Shell Scripts (8 concurrent)                      6.0        358.5    597.5
System Call Overhead                          15000.0     386989.5    258.0
                                                                   ========
System Benchmarks Index Score                                         417.7
Testing again shows similar results:
   #    #  #    #  #  #    #          #####   ######  #    #   ####   #    #
   #    #  ##   #  #   #  #           #    #  #       ##   #  #    #  #    #
   #    #  # #  #  #    ##            #####   #####   # #  #  #       ######
   #    #  #  # #  #    ##            #    #  #       #  # #  #       #    #
   #    #  #   ##  #   #  #           #    #  #       #   ##  #    #  #    #
    ####   #    #  #  #    #          #####   ######  #    #   ####   #    #

   Version 5.1.3                      Based on the Byte Magazine Unix Benchmark

   Multi-CPU version                  Version 5 revisions by Ian Smith,
                                      Sunnyvale, CA, USA
   January 13, 2011                   johantheghost at yahoo period com

1 x Dhrystone 2 using register variables  1 2 3 4 5 6 7 8 9 10

1 x Double-Precision Whetstone  1 2 3 4 5 6 7 8 9 10

1 x Execl Throughput  1 2 3

1 x File Copy 1024 bufsize 2000 maxblocks  1 2 3

1 x File Copy 256 bufsize 500 maxblocks  1 2 3

1 x File Copy 4096 bufsize 8000 maxblocks  1 2 3

1 x Pipe Throughput  1 2 3 4 5 6 7 8 9 10

1 x Pipe-based Context Switching  1 2 3 4 5 6 7 8 9 10

1 x Process Creation  1 2 3

1 x System Call Overhead  1 2 3 4 5 6 7 8 9 10

1 x Shell Scripts (1 concurrent)  1 2 3

1 x Shell Scripts (8 concurrent)  1 2 3

========================================================================
   BYTE UNIX Benchmarks (Version 5.1.3)

   System: urgentvps: GNU/Linux
   OS: GNU/Linux -- 2.6.32-5-xen-amd64 -- #1 SMP Thu May 19 01:16:47 UTC 2011
   Machine: x86_64 (unknown)
   Language: en_US.utf8 (charmap="UTF-8", collate="UTF-8")
   CPU 0: Intel(R) Xeon(R) CPU E5520 @ 2.27GHz (4533.5 bogomips)
          Hyper-Threading, x86-64, MMX, Physical Address Ext, SYSENTER/SYSEXIT, SYSCALL/SYSRET
   00:14:32 up 1 day,  1:36,  1 user,  load average: 0.16, 1.74, 1.42; runlevel 2

------------------------------------------------------------------------
Benchmark Run: Fri Sep 02 2011 00:14:32 - 00:42:50
1 CPU in system; running 1 parallel copy of tests

Dhrystone 2 using register variables       19591050.7 lps   (10.0 s, 7 samples)
Double-Precision Whetstone                     2717.2 MWIPS (10.0 s, 7 samples)
Execl Throughput                               1325.8 lps   (30.0 s, 2 samples)
File Copy 1024 bufsize 2000 maxblocks        192631.1 KBps  (30.0 s, 2 samples)
File Copy 256 bufsize 500 maxblocks           50479.0 KBps  (30.0 s, 2 samples)
File Copy 4096 bufsize 8000 maxblocks        617637.6 KBps  (30.0 s, 2 samples)
Pipe Throughput                              309519.7 lps   (10.0 s, 7 samples)
Pipe-based Context Switching                  60644.5 lps   (10.0 s, 7 samples)
Process Creation                               2591.4 lps   (30.0 s, 2 samples)
Shell Scripts (1 concurrent)                   2733.6 lpm   (60.0 s, 2 samples)
Shell Scripts (8 concurrent)                    356.0 lpm   (60.2 s, 2 samples)
System Call Overhead                         375702.0 lps   (10.0 s, 7 samples)

System Benchmarks Index Values               BASELINE       RESULT    INDEX
Dhrystone 2 using register variables         116700.0   19591050.7   1678.8
Double-Precision Whetstone                       55.0       2717.2    494.0
Execl Throughput                                 43.0       1325.8    308.3
File Copy 1024 bufsize 2000 maxblocks          3960.0     192631.1    486.4
File Copy 256 bufsize 500 maxblocks            1655.0      50479.0    305.0
File Copy 4096 bufsize 8000 maxblocks          5800.0     617637.6   1064.9
Pipe Throughput                               12440.0     309519.7    248.8
Pipe-based Context Switching                   4000.0      60644.5    151.6
Process Creation                                126.0       2591.4    205.7
Shell Scripts (1 concurrent)                     42.4       2733.6    644.7
Shell Scripts (8 concurrent)                      6.0        356.0    593.4
System Call Overhead                          15000.0     375702.0    250.5
                                                                   ========
System Benchmarks Index Score                                         419.9
I could not even complete the GeekBench tests, for some reason it runs half way before it stopped and the SSH session closed itself. However, even from the subscores you should be able to see how the GeekBench score is going to look like:
System Information
  Operating System      Linux 2.6.26-2-686-bigmem i686
  Model                 N/A
  Motherboard           N/A
  Processor             Intel(R) Xeon(R) CPU           E5520  @ 2.27GHz @ 0.00 Hz
                        1 Processor
  Processor ID          GenuineIntel Family 6 Model 26 Stepping 5
  L1 Instruction Cache  32.0 KB
  L1 Data Cache         32.0 KB
  L2 Cache              256 KB
  L3 Cache              8.00 MB
  Memory                270 MB N/A
  BIOS                  N/A

Integer
  Blowfish
    single-threaded scalar   1777 |||||||
  Text Compress
    single-threaded scalar   1727 ||||||
  Text Decompress
    single-threaded scalar   1844 |||||||
  Image Compress
    single-threaded scalar   1689 ||||||
  Image Decompress
    single-threaded scalar   1338 |||||
  Lua
    single-threaded scalar   3004 ||||||||||||

Floating Point
  Mandelbrot
    single-threaded scalar   1917 |||||||
  Dot Product
    single-threaded scalar   2807 |||||||||||
    single-threaded vector   2799 |||||||||||
  LU Decomposition
    single-threaded scalar   2143 ||||||||
  Primality Test
    single-threaded scalar   2843 |||||||||||
  Sharpen Image
    single-threaded scalar   7058 ||||||||||||||||||||||||||||
  Blur Image
    single-threaded scalar   7442 |||||||||||||||||||||||||||||

Memory
  Read Sequential
    single-threaded scalar     27
  Write Sequential
    single-threaded scalar     34
  Stdlib Allocate
    single-threaded scalar   3290 |||||||||||||
  Stdlib Write
    single-threaded scalar   3985 |||||||||||||||
  Stdlib Copy
    single-threaded scalar   3926 |||||||||||||||

Stream

  Stream Copy
    single-threaded scalar     11
    single-threaded vector     12
And testing for the second time using screen failed as well:
Integer
  Blowfish
    single-threaded scalar   1742 ||||||
  Text Compress
    single-threaded scalar   1690 ||||||
  Text Decompress
    single-threaded scalar   1869 |||||||
  Image Compress
    single-threaded scalar   1693 ||||||
  Image Decompress
    single-threaded scalar   1462 |||||
  Lua
    single-threaded scalar   2970 |||||||||||

Floating Point
  Mandelbrot
    single-threaded scalar   1888 |||||||
  Dot Product
    single-threaded scalar   2805 |||||||||||
    single-threaded vector   2809 |||||||||||
  LU Decomposition
    single-threaded scalar   2143 ||||||||
  Primality Test
    single-threaded scalar   2864 |||||||||||
  Sharpen Image
    single-threaded scalar   6964 |||||||||||||||||||||||||||
  Blur Image
    single-threaded scalar   7356 |||||||||||||||||||||||||||||

Memory
  Read Sequential
    single-threaded scalar     25
  Write Sequential
    single-threaded scalar     35
  Stdlib Allocate
    single-threaded scalar   3502 ||||||||||||||
  Stdlib Write
    single-threaded scalar   3838 |||||||||||||||
  Stdlib Copy
    single-threaded scalar   3984 |||||||||||||||

Stream
  Stream Copy
    single-threaded scalar     11
    single-threaded vector     12
Terminated
Overall, the performance of the VPS is really not all that great, although downloading speed could occasionally reach close to port speed and there is no trace of the oversold RAM, however, the restrictions made on the CPU and not-so-great disk I/O on the SAN storage basically made the unit unable to complete the GeekBench tests and delivered a pretty low score for the UnixBench tests.
Customer Service and Support
The support pace for UrgentVPS actually varies quite a bit, my original ticket requesting the change in OS, which was submitted at 10:32PM was answered at 5:35AM the next day, although that is not bad for a budget VPS provider, I have to wait for 2 days until the reload was completed. However, another ticket that I put in at 11:37AM was answered at 11:38AM, barely a minute later! That is really fast response.
However, UrgentVPS does not have the ability to receive replies via email though, in fact, attempt to reply the ticket email was returned with a delivery failure as the email account that used to send out the email does not exist.
Conclusion
Although VPS on SAN storage is a really great idea and the OnApp control panel seems rather fancy, the performance of the server really does not show the advantages of the cloud servers. The fact that UnixBench are pretty low and GeekBench could not even completed definitely raised a flag in terms of performances, furthermore, the network speed varies. As such, I can only recommend this VPS if you do not need any more than very light usage on the server.
Hi there,
As mentioned in the e-mail to you, our lower plans are I/O restricted to maintain performance for everyone. We’ve had issues in the past with clients abusing the disks so we’ve had to bring this in to place. Although saying that, 60MB/s is still a very nice number for a €4.49 VPS with the rest of the features / bonuses that you’re receiving 🙂
Not sure i would agree.
disk performance is not bad yes for a cheap VPS but CPU performance seems poor and network performance is not very good at all. And support seems to be lacking as well (A full day just to reinstall the OS?)
You’re allocated 1 CPU core and given 10% of it as your CPU allocation, you can, however use more than that if it is available. For a true “cloud” server running on a SAN and for €4.49 per month, we feel that this is a great product. If you require more juice, then UV-PLAN1 and upwards are the products you’ll want to go for. UV0 isn’t meant to be a ground breaker or something to run busy forums / game servers etc on 🙂 It’s more a way of letting people experience the cloud set up at a more than affordable price, as well as giving you a great platform to run some of your own sites / VOIP applications. In regards to our network performance, you’re allocated a 50Mbit port on your VPS, each hypervisor is connected at 1GBit to the outside world so there should be no issues regarding the speeds, however you must understand this is a shared environment, clients don’t receive dedicated 50Mbit ports but in most cases you’ll be able to hit the full 50Mbit. In my opinion for the price, our UV0 is a great option and will suit many people.
Regards
Interesting market the whole could VPS thing, personally I don’t belive the hardware is mature enough to truly sustain it right now.
Its great to say “oh yeah I’m hosted in the cloud” however I could take your 4.49 and buy a Xen PV VPS with 256 mb Ram gets over 100 MB/s disk writes and comes with 8 CPU cores and scores 6 times higher in Unix bench and on top of that offers nightly offsite backups and a 1000 mbit connection.
So… in conclusion (Just my own) the cloud has no business in the budget market, its pitiful performance in many areas apart from redundancy (which if you were concerned about data you would not be looking to spend peanuts anyway) evidences this.
I think that the only people that this appeals too simply don’t understand what it is and this cloud=good and who are under the illusion the cloud is a nice shiny thing to show off about.
Anyway this is starting to sound like a bashing and its not meant to be.
Pingback: urgentVPS – €25/Year 256MB Xen VPS in Germany – Low End Box
Pingback: urgentVPS – €25/Year 256MB Xen VPS in Germany | Free vps,Free vps hosting,Free vps server - Free Vps Free Webspace and Free Web Hosting Services