
96MB Low End VPS Review Part XXIX – Uptime VPS
When UptimeVPS posted their last low end box offer on LowEndBox.com, the comments did not go that well, and they were accused as “scammers” several times. In view of such, Ken from UptimeVPS actually offered everyone a free 7-day trial period to see if they are indeed scammers. I decided to seize this opportunity to review about their VPS and services.
General Information and Set Up
Basically, for 5 Euros PER YEAR (yes, per year, not per month), you are able to get the following VPS as indicated on this advertisement:
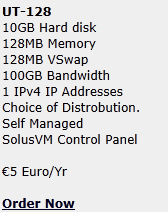
Although there is a 7 day free trial period which you can decide whether or not to continue the service later on.
The interesting part is the promo code shown on LEB is actually a recurring 100% off promo code, which means once you put in the code, the price of the VPS is supposedly to be free forever:

Obviously, the deal is too good to be true and here is what I have received from Ken about 5 days after my initial signup:

The revised invoice was initially 5 Euro per MONTH although 5 Euro per year was what was advertised:
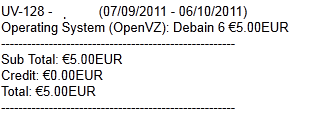
which was adjusted to 1.50 EUR per month 3 minutes later:

Although I do not notice any other possible billing cycle during the sign up stage:

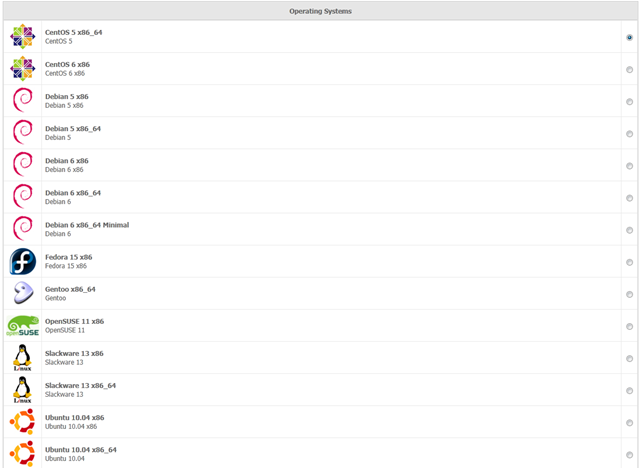
Aside of this billing fiasco, the sign up is generally a pretty pleasant process on HTTPS connection. There are not too many configurable options and OS is pretty much the only thing you can choose from:
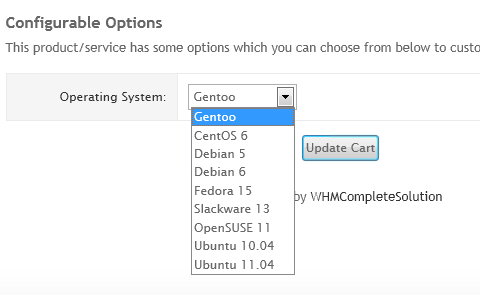
Provision was instant (since there is no payment involved) and it was a pretty standard WHMCS server email with password in plain text.
Once logged in to the WHMCS system via HTTPS connection, the VPS service is available under My Services. Unlike many other providers, UptimeVPS does not make any of the resources statistics available, neither in percentage bar form nor graphic form, presumably to save some resources on the main node.
For the control of the VPS on the WHMCS system, there are only three buttons available as well, which are perhaps the most basic functions to control the VPS:

SolusVM login is available on a standard HTTP port (port 80) using assigned user name. Once logged in, a pretty standard interface was shown:
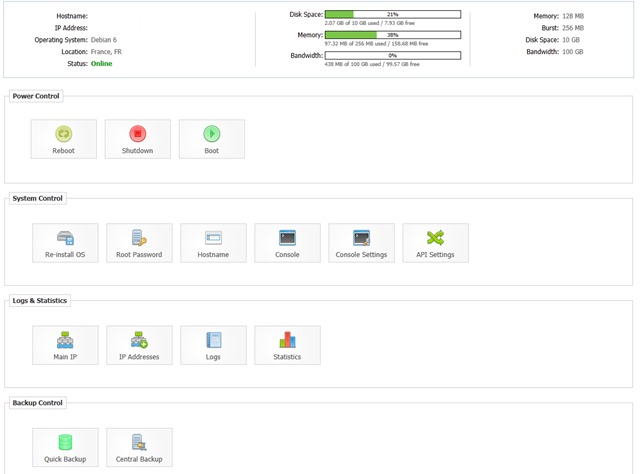
None of the backup control types are available, nor there is any instant reverse DNS control.
On the bright side, there are quite a few OS templates available though, covering pretty much all major Linux distributions. In fact, several OS templates were added while I was going through the trial period and I am glad that they have Debian 6 X86 template added, although for some interesting reasons, the minimal template they have is just for 64 bit Debain, not 32 bit, although 32 bit seems to be more popular among the low end VPS users.

Test on the VPS
As mentioned above, the VPS that I have used for testing has 128MB of dedicated RAM, 10GB of hard drive space and is located in the OVH data centre in France. I have initially had to use 64 bit Debian 6 OS template for testing as the 32 bit template was not available initially. However, I did do an reinstallation of the OS half way through and used that to do some of the memory-related testing.
Using 64 bit OS template, approximately 40 MB of memory were used after a fresh OS install, which is a bit higher than usual, particularly considering that there are very few running processes that comes with the default installation:
free -m
             total       used       free     shared    buffers     cached
Mem:           256         40        215          0          0          0
-/+ buffers/cache:         40        215
Swap:            0          0          0
And the top output showing very few processes running:
top - 17:41:15 up 2 min,  1 user,  load average: 0.00, 0.00, 0.00
Tasks:   7 total,   2 running,   5 sleeping,   0 stopped,   0 zombie
Cpu(s):  0.0%us,  0.0%sy,  0.0%ni,100.0%id,  0.0%wa,  0.0%hi,  0.0%si,  0.0%st
Mem:    262144k total,    41700k used,   220444k free,        0k buffers
Swap:        0k total,        0k used,        0k free,        0k cached

  PID USER      PR  NI  VIRT  RES  SHR S %CPU %MEM    TIME+  COMMAND
 1311 root      15   0 70492 3344 2644 R    0  1.3   0:00.01 sshd
 1314 root      15   0 17716 1904 1416 S    0  0.7   0:00.00 bash
 1264 root      22   0 60300 1476 1080 S    0  0.6   0:00.00 rsyslogd
 1321 root      15   0 18932 1232  996 R    0  0.5   0:00.00 top
 1296 root      18   0 49172 1136  592 S    0  0.4   0:00.00 sshd
 1290 root      18   0 20904  844  648 S    0  0.3   0:00.00 cron
    1 root      15   0  8356  800  676 S    0  0.3   0:00.32 init
Only 198MB of disk space were used, which is a lot lower than many of the other VPS that I have reviewed, which takes up 400MB of disk space with nothing installed:
 df -h
Filesystem            Size  Used Avail Use% Mounted on
/dev/simfs             10G  198M  9.9G   2% /
tmpfs                 128M     0  128M   0% /lib/init/rw
tmpfs                 128M     0  128M   0% /dev/shm
After the full LNMP stack is installed, approximately 100MB of memory were used, which is a bit higher than normal for the Debian templates:
free -m
             total       used       free     shared    buffers     cached
Mem:           256        101        154          0          0          0
-/+ buffers/cache:        101        154
Swap:            0          0          0
The corresponding top output, showing the full LNMP stack running:
top - 02:23:05 up 43 min,  1 user,  load average: 0.00, 0.22, 0.50
Tasks:  14 total,   2 running,  12 sleeping,   0 stopped,   0 zombie
Cpu(s):  0.0%us,  0.0%sy,  0.0%ni,100.0%id,  0.0%wa,  0.0%hi,  0.0%si,  0.0%st
Mem:    262144k total,   103636k used,   158508k free,        0k buffers
Swap:        0k total,        0k used,        0k free,        0k cached

  PID USER      PR  NI  VIRT  RES  SHR S %CPU %MEM    TIME+  COMMAND
17759 www       22   0 50112  20m  452 S    0  8.1   0:00.00 nginx
11799 mysql     19   0 60952 7324 3348 S    0  2.8   0:00.00 mysqld
13531 root      16   0  104m 5744 1124 S    0  2.2   0:00.00 php-fpm
13532 www       19   0  104m 5260  640 S    0  2.0   0:00.00 php-fpm
13533 www       19   0  104m 5260  640 S    0  2.0   0:00.00 php-fpm
15562 root      15   0 70576 3436 2644 R    0  1.3   0:00.65 sshd
17758 root      18   0 30100 2744 2044 S    0  1.0   0:00.00 nginx
15565 root      15   0 17716 1944 1452 S    0  0.7   0:00.01 bash
 1264 root      22   0 60300 1480 1080 S    0  0.6   0:00.00 rsyslogd
17774 root      15   0 18932 1240 1004 R    0  0.5   0:00.00 top
 1296 root      18   0 49172 1136  592 S    0  0.4   0:00.00 sshd
 1290 root      15   0 20904  844  648 S    0  0.3   0:00.00 cron
    1 root      15   0  8356  800  676 S    0  0.3   0:00.32 init
11697 root      18   0  3952  644  524 S    0  0.2   0:00.00 mysqld_safe
And of course, as per usual, the htop output for the htop fans:
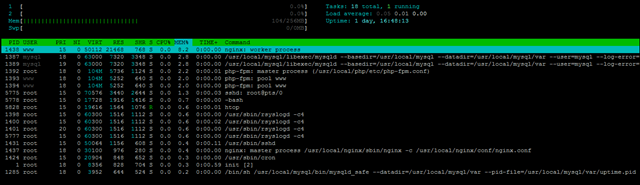
The installation used about 2.1GB of hard drive space:
df -h
Filesystem            Size  Used Avail Use% Mounted on
/dev/simfs             10G  2.1G  8.0G  21% /
tmpfs                 128M     0  128M   0% /lib/init/rw
tmpfs                 128M     0  128M   0% /dev/shm
With the 32 bit Debian 6 template installed, it definitely seems to be a lot better, there are just 7 processes running and in fact, the usual Apache processes, which is pretty standard for the Debian 6 OS template, are not there. Therefore, it surprised me a little when I see still about 40MB of memory were used after the fresh OS reload:
 free -m
             total       used       free     shared    buffers     cached
Mem:           256         39        216          0          0          0
-/+ buffers/cache:         39        216
Swap:            0          0          0
And the top output:
top - 17:31:11 up 11:56,  1 user,  load average: 0.00, 0.00, 0.00
Tasks:   7 total,   2 running,   5 sleeping,   0 stopped,   0 zombie
Cpu(s):  0.0%us,  0.0%sy,  0.0%ni,100.0%id,  0.0%wa,  0.0%hi,  0.0%si,  0.0%st
Mem:    262144k total,    40980k used,   221164k free,        0k buffers
Swap:        0k total,        0k used,        0k free,        0k cached

  PID USER      PR  NI  VIRT  RES  SHR S %CPU %MEM    TIME+  COMMAND
 1300 root      18   0  8380 2912 2336 R    0  1.1   0:00.81 sshd
 1302 root      15   0  2972 1676 1336 S    0  0.6   0:00.00 bash
 1250 root      25   0 33436 1360 1020 S    0  0.5   0:00.00 rsyslogd
17901 root      15   0  2324 1068  872 R    0  0.4   0:00.00 top
 1282 root      18   0  5484  968  580 S    0  0.4   0:00.00 sshd
 1276 root      18   0  2284  756  596 S    0  0.3   0:00.00 cron
    1 root      15   0  2024  680  584 S    0  0.3   0:00.66 init
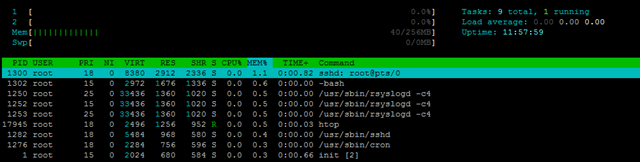
And again, htop output for the htop fans, you can definitely see how short the process list is, although SSH demon, for some reason, took quite a bit of memory there:
Hard drive space usaged continued to be low with the 32 bit OS template though, I was getting about 360MB of hard drive space used:
df -h
Filesystem            Size  Used Avail Use% Mounted on
/dev/simfs             10G  359M  9.7G   4% /
tmpfs                 128M     0  128M   0% /lib/init/rw
tmpfs                 128M     0  128M   0% /dev/shm
Beancounters are set to pretty high values, which is something great:
cat /proc/user_beancounters
Version: 2.5
       uid  resource                     held              maxheld              barrier                limit              failcnt
      133:  kmemsize                  3354229             27036894           2147483646           2147483646                    0
            lockedpages                     0                  966               999999               999999                    0
            privvmpages                 25809                65593                65536                65536                  129
            shmpages                      770                  786                32768                32768                    0
            dummy                           0                    0                    0                    0                    0
            numproc                        17                   62               999999               999999                    0
            physpages                   10042                50172                    0           2147483647                    0
            vmguarpages                     0                    0                32768           2147483647                    0
            oomguarpages                10042                50172                32768           2147483647                    0
            numtcpsock                      5                    9              7999992              7999992                    0
            numflock                        1                    7               999999               999999                    0
            numpty                          1                    2               500000               500000                    0
            numsiginfo                      0                   15               999999               999999                    0
            tcpsndbuf                  102976               654352            214748160            396774400                    0
            tcprcvbuf                   81920              4816752            214748160            396774400                    0
            othersockbuf                 9312                36544            214748160            396774400                    0
            dgramrcvbuf                     0                 8472            214748160            396774400                    0
            numothersock                    8                   14              7999992              7999992                    0
            dcachesize                      0                    0           2147483646           2147483646                    0
            numfile                       369                 1088             23999976             23999976                    0
            dummy                           0                    0                    0                    0                    0
            dummy                           0                    0                    0                    0                    0
            dummy                           0                    0                    0                    0                    0
            numiptent                      24                   24               999999               999999                    0
Vmstat also shows the VPS is pretty idle:
vmstat
procs -----------memory---------- ---swap-- -----io---- -system-- ----cpu----
 r  b   swpd   free   buff  cache   si   so    bi    bo   in   cs us sy id wa
 1  0      0 159304      0      0    0    0     0    27    0  314  2  2 95  0
Which is confirmed again by uptime:
uptime
 21:26:31 up 19:47,  1 user,  load average: 0.00, 0.00, 0.00
The Inodes are pretty high as well:
 df -i
Filesystem            Inodes   IUsed   IFree IUse% Mounted on
/dev/simfs           5242880   80830 5162050    2% /
tmpfs                  32768       4   32764    1% /lib/init/rw
tmpfs                  32768       1   32767    1% /dev/shm
CPUinfo output shows 2 Xeon W3520 cores are given to the VPS, and both cores are not throttled:
cat /proc/cpuinfo
processor       : 0
vendor_id       : GenuineIntel
cpu family      : 6
model           : 26
model name      : Intel(R) Xeon(R) CPU           W3520  @ 2.67GHz
stepping        : 5
cpu MHz         : 2660.053
cache size      : 8192 KB
physical id     : 0
siblings        : 8
core id         : 0
cpu cores       : 4
apicid          : 0
fpu             : yes
fpu_exception   : yes
cpuid level     : 11
wp              : yes
flags           : fpu vme de pse tsc msr pae mce cx8 apic sep mtrr pge mca cmov pat pse36 clflush dts acpi mmx fxsr sse sse2 ss ht tm syscall nx rdtscp lm constant_tsc ida nonstop_tsc pni monitor ds_cpl vmx est tm2 ssse3 cx16 xtpr sse4_1 sse4_2 popcnt lahf_lm
bogomips        : 5320.10
clflush size    : 64
cache_alignment : 64
address sizes   : 36 bits physical, 48 bits virtual
power management: [8]

processor       : 1
vendor_id       : GenuineIntel
cpu family      : 6
model           : 26
model name      : Intel(R) Xeon(R) CPU           W3520  @ 2.67GHz
stepping        : 5
cpu MHz         : 2660.053
cache size      : 8192 KB
physical id     : 0
siblings        : 8
core id         : 1
cpu cores       : 4
apicid          : 2
fpu             : yes
fpu_exception   : yes
cpuid level     : 11
wp              : yes
flags           : fpu vme de pse tsc msr pae mce cx8 apic sep mtrr pge mca cmov pat pse36 clflush dts acpi mmx fxsr sse sse2 ss ht tm syscall nx rdtscp lm constant_tsc ida nonstop_tsc pni monitor ds_cpl vmx est tm2 ssse3 cx16 xtpr sse4_1 sse4_2 popcnt lahf_lm
bogomips        : 5319.28
clflush size    : 64
cache_alignment : 64
address sizes   : 36 bits physical, 48 bits virtual
There does not seems to be heavy overselling in RAM either:
vzfree
             Total     Used     Free
Kernel:   2048.00M    3.16M 2044.84M
Allocate:  256.00M  100.79M  155.21M (128M Guaranteed)
Commit:    128.00M   42.32M   85.68M (38.9% of Allocated)
Swap:                 0.00M          (0.0% of Committed)
Meminfo does not really give anything interesting:
cat /proc/meminfo
MemTotal:       262144 kB
MemFree:        159116 kB
Buffers:             0 kB
Cached:              0 kB
SwapCached:          0 kB
Active:              0 kB
Inactive:            0 kB
HighTotal:           0 kB
HighFree:            0 kB
LowTotal:       262144 kB
LowFree:        159116 kB
SwapTotal:           0 kB
SwapFree:            0 kB
Dirty:          102180 kB
Writeback:           0 kB
AnonPages:           0 kB
Mapped:              0 kB
Slab:                0 kB
PageTables:          0 kB
NFS_Unstable:        0 kB
Bounce:              0 kB
CommitLimit:         0 kB
Committed_AS:        0 kB
VmallocTotal:        0 kB
VmallocUsed:         0 kB
VmallocChunk:        0 kB
HugePages_Total:     0
HugePages_Free:      0
HugePages_Rsvd:      0
Hugepagesize:     2048 kB
And the time sync results:
time sync

real    0m0.026s
user    0m0.000s
sys     0m0.026s
In terms of disk I/O speed, the output of uptime VPS is pretty good:
dd if=/dev/zero of=test bs=64k count=16k conv=fdatasync
16384+0 records in
16384+0 records out
1073741824 bytes (1.1 GB) copied, 11.8615 s, 90.5 MB/s
Testing again showing the results is pretty consistent, if not a little better:
dd if=/dev/zero of=test bs=64k count=16k conv=fdatasync
16384+0 records in
16384+0 records out
1073741824 bytes (1.1 GB) copied, 11.7457 s, 91.4 MB/s
The network speed is pretty decent too, I was able to get close to 30MB/s on the Cachefly test:
wget cachefly.cachefly.net/100mb.test -O /dev/null
--2011-09-01 21:33:06--  http://cachefly.cachefly.net/100mb.test
Resolving cachefly.cachefly.net... 205.234.175.175
Connecting to cachefly.cachefly.net|205.234.175.175|:80... connected.
HTTP request sent, awaiting response... 200 OK
Length: 104857600 (100M) [application/octet-stream]
Saving to: `/dev/null'

100%[======================================>] 104,857,600 30.9M/s   in 3.5s

2011-09-01 21:33:09 (28.9 MB/s) - `/dev/null' saved [104857600/104857600]
Upload speed are pretty impressive as well, with my Nix Communication’s VPS showing the slowest speed of slightly above 1MB/s:
 wget 46.105.251.123/100mb.test -O /dev/null
--2011-09-10 11:27:07--  http://46.105.251.123/100mb.test
Connecting to 46.105.251.123:80... connected.
HTTP request sent, awaiting response... 200 OK
Length: 104857600 (100M) [application/octet-stream]
Saving to: `/dev/null'

100%[======================================>] 104,857,600 1.13M/s   in 90s

2011-09-10 11:28:38 (1.11 MB/s) - `/dev/null' saved [104857600/104857600]
My BuyVM VPS in San Jose, CA, shows a lot better speed:
wget 46.105.251.123/100mb.test -O /dev/null
--2011-09-09 23:25:26--  http://46.105.251.123/100mb.test
Connecting to 46.105.251.123:80... connected.
HTTP request sent, awaiting response... 200 OK
Length: 104857600 (100M) [application/octet-stream]
Saving to: `/dev/null'

100%[======================================>] 104,857,600 3.78M/s   in 27s

2011-09-09 23:25:53 (3.64 MB/s) - `/dev/null' saved [104857600/104857600]
And the champion, needless to say, goes to my Quickweb VPS in London, UK, since they are geographically the closest:
wget 46.105.251.123/100mb.test -O /dev/null
--2011-09-09 23:29:35--  http://46.105.251.123/100mb.test
Connecting to 46.105.251.123:80... connected.
HTTP request sent, awaiting response... 200 OK
Length: 104857600 (100M) [application/octet-stream]
Saving to: `/dev/null'

100%[======================================>] 104,857,600 35.2M/s   in 2.8s

2011-09-09 23:29:38 (35.2 MB/s) - `/dev/null' saved [104857600/104857600]
Finally, the benchmarks. The interesting bit about benchmarks for them is that I was not even able to complete the benchmarks initially, using either UnixBench or Geekbench, when the 64 bit OS templates were installed:
First UnixBench, which, as you can see, is giving me cannot fork error:
   #    #  #    #  #  #    #          #####   ######  #    #   ####   #    #
   #    #  ##   #  #   #  #           #    #  #       ##   #  #    #  #    #
   #    #  # #  #  #    ##            #####   #####   # #  #  #       ######
   #    #  #  # #  #    ##            #    #  #       #  # #  #       #    #
   #    #  #   ##  #   #  #           #    #  #       #   ##  #    #  #    #
    ####   #    #  #  #    #          #####   ######  #    #   ####   #    #

   Version 5.1.3                      Based on the Byte Magazine Unix Benchmark

   Multi-CPU version                  Version 5 revisions by Ian Smith,
                                      Sunnyvale, CA, USA
   January 13, 2011                   johantheghost at yahoo period com

1 x Dhrystone 2 using register variables  1 2 3 4 5 6 7 8 9 10

1 x Double-Precision Whetstone  1 2 3 4 5 6 7 8 9 10

1 x Execl Throughput  1 2 3

1 x File Copy 1024 bufsize 2000 maxblocks  1 2 3

1 x File Copy 256 bufsize 500 maxblocks  1 2 3

1 x File Copy 4096 bufsize 8000 maxblocks  1 2 3

1 x Pipe Throughput  1 2 3 4 5 6 7 8 9 10

1 x Pipe-based Context Switching  1 2 3 4 5 6 7 8 9 10

1 x Process Creation  1 2 3

1 x System Call Overhead  1 2 3 4 5 6 7 8 9 10

1 x Shell Scripts (1 concurrent)  1 2 3

1 x Shell Scripts (8 concurrent)  1 2 3

2 x Dhrystone 2 using register variables  1 2 3 4 5 6 7 8 9 10

2 x Double-Precision Whetstone  1 2 3 4 5 6 7 8 9 10

2 x Execl Throughput  1 2 3

2 x File Copy 1024 bufsize 2000 maxblocks  1 2 3

2 x File Copy 256 bufsize 500 maxblocks  1 2 3

2 x File Copy 4096 bufsize 8000 maxblocks  1 2 3

2 x Pipe Throughput  1 2 3 4 5 6 7 8 9 10

2 x Pipe-based Context Switching  1 2 3 4 5 6 7 8 9 10

2 x Process Creation  1 2 3

2 x System Call Overhead  1 2 3 4 5 6 7 8 9 10

2 x Shell Scripts (1 concurrent)  1 2 3

2 x Shell Scripts (8 concurrent)  1
**********************************************
Run: "Shell Scripts (8 concurrent)": /tmp/UnixBench/pgms/multi.sh: 21: Cannot fork
Bad wait status: 0x200; aborting
Trying it again does not give me any better luck:
  #    #  #    #  #  #    #          #####   ######  #    #   ####   #    #
   #    #  ##   #  #   #  #           #    #  #       ##   #  #    #  #    #
   #    #  # #  #  #    ##            #####   #####   # #  #  #       ######
   #    #  #  # #  #    ##            #    #  #       #  # #  #       #    #
   #    #  #   ##  #   #  #           #    #  #       #   ##  #    #  #    #
    ####   #    #  #  #    #          #####   ######  #    #   ####   #    #

   Version 5.1.3                      Based on the Byte Magazine Unix Benchmark

   Multi-CPU version                  Version 5 revisions by Ian Smith,
                                      Sunnyvale, CA, USA
   January 13, 2011                   johantheghost at yahoo period com

1 x Dhrystone 2 using register variables  1 2 3 4 5 6 7 8 9 10

1 x Double-Precision Whetstone  1 2 3 4 5 6 7 8 9 10

1 x Execl Throughput  1 2 3

1 x File Copy 1024 bufsize 2000 maxblocks  1 2 3

1 x File Copy 256 bufsize 500 maxblocks  1 2 3

1 x File Copy 4096 bufsize 8000 maxblocks  1 2 3

1 x Pipe Throughput  1 2 3 4 5 6 7 8 9 10

1 x Pipe-based Context Switching  1 2 3 4 5 6 7 8 9 10

1 x Process Creation  1 2 3

1 x System Call Overhead  1 2 3 4 5 6 7 8 9 10

1 x Shell Scripts (1 concurrent)  1 2 3

1 x Shell Scripts (8 concurrent)  1 2 3

2 x Dhrystone 2 using register variables  1 2 3 4 5 6 7 8 9 10

2 x Double-Precision Whetstone  1 2 3 4 5 6 7 8 9 10

2 x Execl Throughput  1 2 3

2 x File Copy 1024 bufsize 2000 maxblocks  1 2 3

2 x File Copy 256 bufsize 500 maxblocks  1 2 3

2 x File Copy 4096 bufsize 8000 maxblocks  1 2 3

2 x Pipe Throughput  1 2 3 4 5 6 7 8 9 10

2 x Pipe-based Context Switching  1 2 3 4 5 6 7 8 9 10

2 x Process Creation  1 2 3

2 x System Call Overhead  1 2 3 4 5 6 7 8 9 10

2 x Shell Scripts (1 concurrent)  1 2 3

2 x Shell Scripts (8 concurrent)  1
**********************************************
Run: "Shell Scripts (8 concurrent)": /tmp/UnixBench/pgms/multi.sh: 21: Cannot fork
Bad wait status: 0x200; aborting
Pretty bad results were shown on the GeekBench tests too:
System Information
  Operating System      Linux 2.6.32-238.19.1.el5.028stab092.2 x86_64
  Model                 N/A
  Motherboard           N/A
  Processor             Intel(R) Xeon(R) CPU           W3520  @ 2.67GHz @ 0.00 Hz
                        1 Processor, 2 Cores, 2 Threads
  Processor ID          GenuineIntel Family 6 Model 26 Stepping 5
  L1 Instruction Cache  32.0 KB
  L1 Data Cache         32.0 KB
  L2 Cache              256 KB
  L3 Cache              8.00 MB
  Memory                23.5 GB N/A
  BIOS                  N/A

Integer
  Blowfish
    single-threaded scalar   2243 ||||||||
    multi-threaded scalar    4032 ||||||||||||||||
  Text Compress
    single-threaded scalar   2701 ||||||||||
    multi-threaded scalar    4830 |||||||||||||||||||
  Text Decompress
    single-threaded scalar   2773 |||||||||||
    multi-threaded scalar    3903 |||||||||||||||
  Image Compress
    single-threaded scalar   2449 |||||||||
    multi-threaded scalar    3355 |||||||||||||
  Image Decompress
    single-threaded scalar   2801 |||||||||||
    multi-threaded scalar    3612 ||||||||||||||
  Lua
    single-threaded scalar   5313 |||||||||||||||||||||
    multi-threaded scalar    5984 |||||||||||||||||||||||

Floating Point
  Mandelbrot
    single-threaded scalar   2412 |||||||||
    multi-threaded scalar    4505 ||||||||||||||||||
  Dot Product
    single-threaded scalar   3934 |||||||||||||||
    multi-threaded scalar    4173 ||||||||||||||||
    single-threaded vector   4860 |||||||||||||||||||
    multi-threaded vector    6133 ||||||||||||||||||||||||
  LU Decomposition
    single-threaded scalar   2341 |||||||||
    multi-threaded scalar    2420 |||||||||
  Primality Test
    single-threaded scalar   5192 ||||||||||||||||||||
    multi-threaded scalar    5540 ||||||||||||||||||||||
  Sharpen Image
    single-threaded scalar   5592 ||||||||||||||||||||||
    multi-threaded scalar    9425 |||||||||||||||||||||||||||||||||||||
  Blur Image
    single-threaded scalar   2206 ||||||||
    multi-threaded scalar    3928 |||||||||||||||

Memory
Geekbench encountered an internal error and cannot continue. Please contact
[email protected] for assistance.

Internal error message: std::bad_alloc.
And second try failed even sooner:
System Information
  Operating System      Linux 2.6.32-238.19.1.el5.028stab092.2 x86_64
  Model                 N/A
  Motherboard           N/A
  Processor             Intel(R) Xeon(R) CPU           W3520  @ 2.67GHz @ 0.00 Hz
                        1 Processor, 2 Cores, 2 Threads
  Processor ID          GenuineIntel Family 6 Model 26 Stepping 5
  L1 Instruction Cache  32.0 KB
  L1 Data Cache         32.0 KB
  L2 Cache              256 KB
  L3 Cache              8.00 MB
  Memory                23.5 GB N/A
  BIOS                  N/A

Integer
  Blowfish
    single-threaded scalar   2048 ||||||||
    multi-threaded scalar    4388 |||||||||||||||||
  Text Compress
    single-threaded scalar   2454 |||||||||
    multi-threaded scalar    3440 |||||||||||||
  Text Decompress
    single-threaded scalar   2571 ||||||||||
    multi-threaded scalar    5352 |||||||||||||||||||||
  Image Compress
    single-threaded scalar   2277 |||||||||
    multi-threaded scalar    3309 |||||||||||||
  Image Decompress
    single-threaded scalar   2615 ||||||||||
    multi-threaded scalar    5021 ||||||||||||||||||||
  Lua
    single-threaded scalar   4897 |||||||||||||||||||
    multi-threaded scalar    5522 ||||||||||||||||||||||

Floating Point
  Mandelbrot
    single-threaded scalar   2237 ||||||||
    multi-threaded scalar    4531 ||||||||||||||||||
  Dot Product
    single-threaded scalar   3640 ||||||||||||||
    multi-threaded scalar    3863 |||||||||||||||
    single-threaded vector   4488 |||||||||||||||||
    multi-threaded vector    5678 ||||||||||||||||||||||
  LU Decomposition
    single-threaded scalar   2166 ||||||||
    multi-threaded scalar    2257 |||||||||
  Primality Test
    single-threaded scalar   4802 |||||||||||||||||||
    multi-threaded scalar    5002 ||||||||||||||||||||
  Sharpen Image
    single-threaded scalar   5173 ||||||||||||||||||||
    multi-threaded scalar    8755 |||||||||||||||||||||||||||||||||||
  Blur Image
    single-threaded scalar   2194 ||||||||
    multi-threaded scalar    3914 |||||||||||||||

Memory
Geekbench encountered an internal error and cannot continue. Please contact
[email protected] for assistance.

Internal error message: std::bad_alloc.
Note that GeekBench seems to indicate there is 25GB of memory for my VPS, which is perhaps the VPS for the whole node and perhaps that is the reason why all the benchmark tests failed.
However, after I reinstalled the 32 bit OS template, miracles seems to happen: I was able to run both GeekBench and UnixBench again!
Here is the template I have used:
 uname -a
Linux ***** 2.6.32-238.19.1.el5.028stab092.2 #1 SMP Thu Jul 21 19:23:22 MSD 2011 i686 GNU/Linux
Here are the UnixBench results, running with the 32 bit Debian 6:
   #    #  #    #  #  #    #          #####   ######  #    #   ####   #    #
   #    #  ##   #  #   #  #           #    #  #       ##   #  #    #  #    #
   #    #  # #  #  #    ##            #####   #####   # #  #  #       ######
   #    #  #  # #  #    ##            #    #  #       #  # #  #       #    #
   #    #  #   ##  #   #  #           #    #  #       #   ##  #    #  #    #
    ####   #    #  #  #    #          #####   ######  #    #   ####   #    #

   Version 5.1.3                      Based on the Byte Magazine Unix Benchmark

   Multi-CPU version                  Version 5 revisions by Ian Smith,
                                      Sunnyvale, CA, USA
   January 13, 2011                   johantheghost at yahoo period com

1 x Dhrystone 2 using register variables  1 2 3 4 5 6 7 8 9 10

1 x Double-Precision Whetstone  1 2 3 4 5 6 7 8 9 10

1 x Execl Throughput  1 2 3

1 x File Copy 1024 bufsize 2000 maxblocks  1 2 3

1 x File Copy 256 bufsize 500 maxblocks  1 2 3

1 x File Copy 4096 bufsize 8000 maxblocks  1 2 3

1 x Pipe Throughput  1 2 3 4 5 6 7 8 9 10

1 x Pipe-based Context Switching  1 2 3 4 5 6 7 8 9 10

1 x Process Creation  1 2 3

1 x System Call Overhead  1 2 3 4 5 6 7 8 9 10

1 x Shell Scripts (1 concurrent)  1 2 3

1 x Shell Scripts (8 concurrent)  1 2 3

2 x Dhrystone 2 using register variables  1 2 3 4 5 6 7 8 9 10

2 x Double-Precision Whetstone  1 2 3 4 5 6 7 8 9 10

2 x Execl Throughput  1 2 3

2 x File Copy 1024 bufsize 2000 maxblocks  1 2 3

2 x File Copy 256 bufsize 500 maxblocks  1 2 3

2 x File Copy 4096 bufsize 8000 maxblocks  1 2 3

2 x Pipe Throughput  1 2 3 4 5 6 7 8 9 10

2 x Pipe-based Context Switching  1 2 3 4 5 6 7 8 9 10

2 x Process Creation  1 2 3

2 x System Call Overhead  1 2 3 4 5 6 7 8 9 10

2 x Shell Scripts (1 concurrent)  1 2 3

2 x Shell Scripts (8 concurrent)  1 2 3

========================================================================
   BYTE UNIX Benchmarks (Version 5.1.3)

   System: uptime: GNU/Linux
   OS: GNU/Linux -- 2.6.32-238.19.1.el5.028stab092.2 -- #1 SMP Thu Jul 21 19:23:22 MSD 2011
   Machine: i686 (unknown)
   Language: en_US.utf8 (charmap="UTF-8", collate="UTF-8")
   CPU 0: Intel(R) Xeon(R) CPU W3520 @ 2.67GHz (5320.1 bogomips)
          Hyper-Threading, x86-64, MMX, Physical Address Ext, SYSENTER/SYSEXIT, SYSCALL/SYSRET, Intel virtualization
   CPU 1: Intel(R) Xeon(R) CPU W3520 @ 2.67GHz (5319.3 bogomips)
          Hyper-Threading, x86-64, MMX, Physical Address Ext, SYSENTER/SYSEXIT, SYSCALL/SYSRET, Intel virtualization
   05:41:48 up 6 min,  1 user,  load average: 0.20, 0.28, 0.13; runlevel 2

------------------------------------------------------------------------
Benchmark Run: Sat Sep 10 2011 05:41:48 - 06:10:01
2 CPUs in system; running 1 parallel copy of tests

Dhrystone 2 using register variables       14248809.7 lps   (10.0 s, 7 samples)
Double-Precision Whetstone                     2877.5 MWIPS (10.0 s, 7 samples)
Execl Throughput                               4515.1 lps   (30.0 s, 2 samples)
File Copy 1024 bufsize 2000 maxblocks        542740.6 KBps  (30.0 s, 2 samples)
File Copy 256 bufsize 500 maxblocks          158426.3 KBps  (30.0 s, 2 samples)
File Copy 4096 bufsize 8000 maxblocks       1338338.2 KBps  (30.0 s, 2 samples)
Pipe Throughput                              987859.6 lps   (10.0 s, 7 samples)
Pipe-based Context Switching                 229114.3 lps   (10.0 s, 7 samples)
Process Creation                              13397.9 lps   (30.0 s, 2 samples)
Shell Scripts (1 concurrent)                   5454.9 lpm   (60.0 s, 2 samples)
Shell Scripts (8 concurrent)                   1243.5 lpm   (60.0 s, 2 samples)
System Call Overhead                         752862.6 lps   (10.0 s, 7 samples)

System Benchmarks Index Values               BASELINE       RESULT    INDEX
Dhrystone 2 using register variables         116700.0   14248809.7   1221.0
Double-Precision Whetstone                       55.0       2877.5    523.2
Execl Throughput                                 43.0       4515.1   1050.0
File Copy 1024 bufsize 2000 maxblocks          3960.0     542740.6   1370.6
File Copy 256 bufsize 500 maxblocks            1655.0     158426.3    957.3
File Copy 4096 bufsize 8000 maxblocks          5800.0    1338338.2   2307.5
Pipe Throughput                               12440.0     987859.6    794.1
Pipe-based Context Switching                   4000.0     229114.3    572.8
Process Creation                                126.0      13397.9   1063.3
Shell Scripts (1 concurrent)                     42.4       5454.9   1286.5
Shell Scripts (8 concurrent)                      6.0       1243.5   2072.5
System Call Overhead                          15000.0     752862.6    501.9
                                                                   ========
System Benchmarks Index Score                                        1023.0

------------------------------------------------------------------------
Benchmark Run: Sat Sep 10 2011 06:10:01 - 06:38:40
2 CPUs in system; running 2 parallel copies of tests

Dhrystone 2 using register variables       27830819.6 lps   (10.0 s, 7 samples)
Double-Precision Whetstone                     5625.8 MWIPS (10.0 s, 7 samples)
Execl Throughput                               8570.0 lps   (30.0 s, 2 samples)
File Copy 1024 bufsize 2000 maxblocks        395590.5 KBps  (30.0 s, 2 samples)
File Copy 256 bufsize 500 maxblocks          109670.8 KBps  (30.0 s, 2 samples)
File Copy 4096 bufsize 8000 maxblocks        990623.0 KBps  (30.0 s, 2 samples)
Pipe Throughput                             1827333.2 lps   (10.0 s, 7 samples)
Pipe-based Context Switching                 549819.3 lps   (10.0 s, 7 samples)
Process Creation                              24355.2 lps   (30.0 s, 2 samples)
Shell Scripts (1 concurrent)                  11870.7 lpm   (60.0 s, 2 samples)
Shell Scripts (8 concurrent)                   1573.1 lpm   (60.0 s, 2 samples)
System Call Overhead                        1395932.5 lps   (10.0 s, 7 samples)

System Benchmarks Index Values               BASELINE       RESULT    INDEX
Dhrystone 2 using register variables         116700.0   27830819.6   2384.8
Double-Precision Whetstone                       55.0       5625.8   1022.9
Execl Throughput                                 43.0       8570.0   1993.0
File Copy 1024 bufsize 2000 maxblocks          3960.0     395590.5    999.0
File Copy 256 bufsize 500 maxblocks            1655.0     109670.8    662.7
File Copy 4096 bufsize 8000 maxblocks          5800.0     990623.0   1708.0
Pipe Throughput                               12440.0    1827333.2   1468.9
Pipe-based Context Switching                   4000.0     549819.3   1374.5
Process Creation                                126.0      24355.2   1933.0
Shell Scripts (1 concurrent)                     42.4      11870.7   2799.7
Shell Scripts (8 concurrent)                      6.0       1573.1   2621.9
System Call Overhead                          15000.0    1395932.5    930.6
                                                                   ========
System Benchmarks Index Score                                        1515.3
As you can see, the performance is actually not that bad and I could not understand why the UnixBench could not be completed with the 64 bit OS template.
Second try produced slightly worse results, but is nontheless pretty good:
  #    #  #    #  #  #    #          #####   ######  #    #   ####   #    #
   #    #  ##   #  #   #  #           #    #  #       ##   #  #    #  #    #
   #    #  # #  #  #    ##            #####   #####   # #  #  #       ######
   #    #  #  # #  #    ##            #    #  #       #  # #  #       #    #
   #    #  #   ##  #   #  #           #    #  #       #   ##  #    #  #    #
    ####   #    #  #  #    #          #####   ######  #    #   ####   #    #

   Version 5.1.3                      Based on the Byte Magazine Unix Benchmark

   Multi-CPU version                  Version 5 revisions by Ian Smith,
                                      Sunnyvale, CA, USA
   January 13, 2011                   johantheghost at yahoo period com

1 x Dhrystone 2 using register variables  1 2 3 4 5 6 7 8 9 10

1 x Double-Precision Whetstone  1 2 3 4 5 6 7 8 9 10

1 x Execl Throughput  1 2 3

1 x File Copy 1024 bufsize 2000 maxblocks  1 2 3

1 x File Copy 256 bufsize 500 maxblocks  1 2 3

1 x File Copy 4096 bufsize 8000 maxblocks  1 2 3

1 x Pipe Throughput  1 2 3 4 5 6 7 8 9 10

1 x Pipe-based Context Switching  1 2 3 4 5 6 7 8 9 10

1 x Process Creation  1 2 3

1 x System Call Overhead  1 2 3 4 5 6 7 8 9 10

1 x Shell Scripts (1 concurrent)  1 2 3

1 x Shell Scripts (8 concurrent)  1 2 3

2 x Dhrystone 2 using register variables  1 2 3 4 5 6 7 8 9 10

2 x Double-Precision Whetstone  1 2 3 4 5 6 7 8 9 10

2 x Execl Throughput  1 2 3

2 x File Copy 1024 bufsize 2000 maxblocks  1 2 3

2 x File Copy 256 bufsize 500 maxblocks  1 2 3

2 x File Copy 4096 bufsize 8000 maxblocks  1 2 3

2 x Pipe Throughput  1 2 3 4 5 6 7 8 9 10

2 x Pipe-based Context Switching  1 2 3 4 5 6 7 8 9 10

2 x Process Creation  1 2 3

2 x System Call Overhead  1 2 3 4 5 6 7 8 9 10

2 x Shell Scripts (1 concurrent)  1 2 3

2 x Shell Scripts (8 concurrent)  1 2 3

========================================================================
   BYTE UNIX Benchmarks (Version 5.1.3)

   System: uptime: GNU/Linux
   OS: GNU/Linux -- 2.6.32-238.19.1.el5.028stab092.2 -- #1 SMP Thu Jul 21 19:23:22 MSD 2011
   Machine: i686 (unknown)
   Language: en_US.utf8 (charmap="UTF-8", collate="UTF-8")
   CPU 0: Intel(R) Xeon(R) CPU W3520 @ 2.67GHz (5320.1 bogomips)
          Hyper-Threading, x86-64, MMX, Physical Address Ext, SYSENTER/SYSEXIT, SYSCALL/SYSRET, Intel virtualization
   CPU 1: Intel(R) Xeon(R) CPU W3520 @ 2.67GHz (5319.3 bogomips)
          Hyper-Threading, x86-64, MMX, Physical Address Ext, SYSENTER/SYSEXIT, SYSCALL/SYSRET, Intel virtualization
   14:50:48 up  9:15,  1 user,  load average: 0.00, 0.00, 0.00; runlevel 2

------------------------------------------------------------------------
Benchmark Run: Sat Sep 10 2011 14:50:48 - 15:19:00
2 CPUs in system; running 1 parallel copy of tests

Dhrystone 2 using register variables       14428202.5 lps   (10.0 s, 7 samples)
Double-Precision Whetstone                     2883.6 MWIPS (10.0 s, 7 samples)
Execl Throughput                               4510.1 lps   (30.0 s, 2 samples)
File Copy 1024 bufsize 2000 maxblocks        555585.8 KBps  (30.0 s, 2 samples)
File Copy 256 bufsize 500 maxblocks          151891.6 KBps  (30.0 s, 2 samples)
File Copy 4096 bufsize 8000 maxblocks       1312889.0 KBps  (30.0 s, 2 samples)
Pipe Throughput                              961943.5 lps   (10.0 s, 7 samples)
Pipe-based Context Switching                 187986.4 lps   (10.0 s, 7 samples)
Process Creation                              13512.7 lps   (30.0 s, 2 samples)
Shell Scripts (1 concurrent)                   6141.3 lpm   (60.0 s, 2 samples)
Shell Scripts (8 concurrent)                   1051.7 lpm   (60.0 s, 2 samples)
System Call Overhead                         761436.2 lps   (10.0 s, 7 samples)

System Benchmarks Index Values               BASELINE       RESULT    INDEX
Dhrystone 2 using register variables         116700.0   14428202.5   1236.3
Double-Precision Whetstone                       55.0       2883.6    524.3
Execl Throughput                                 43.0       4510.1   1048.9
File Copy 1024 bufsize 2000 maxblocks          3960.0     555585.8   1403.0
File Copy 256 bufsize 500 maxblocks            1655.0     151891.6    917.8
File Copy 4096 bufsize 8000 maxblocks          5800.0    1312889.0   2263.6
Pipe Throughput                               12440.0     961943.5    773.3
Pipe-based Context Switching                   4000.0     187986.4    470.0
Process Creation                                126.0      13512.7   1072.4
Shell Scripts (1 concurrent)                     42.4       6141.3   1448.4
Shell Scripts (8 concurrent)                      6.0       1051.7   1752.8
System Call Overhead                          15000.0     761436.2    507.6
                                                                   ========
System Benchmarks Index Score                                         999.6

------------------------------------------------------------------------
Benchmark Run: Sat Sep 10 2011 15:19:00 - 15:47:35
2 CPUs in system; running 2 parallel copies of tests

Dhrystone 2 using register variables       27431592.3 lps   (10.0 s, 7 samples)
Double-Precision Whetstone                     5690.9 MWIPS (10.0 s, 7 samples)
Execl Throughput                               7973.9 lps   (29.9 s, 2 samples)
File Copy 1024 bufsize 2000 maxblocks        364322.6 KBps  (30.0 s, 2 samples)
File Copy 256 bufsize 500 maxblocks          113163.6 KBps  (30.0 s, 2 samples)
File Copy 4096 bufsize 8000 maxblocks       1026998.5 KBps  (30.0 s, 2 samples)
Pipe Throughput                             1880554.5 lps   (10.0 s, 7 samples)
Pipe-based Context Switching                 585706.5 lps   (10.0 s, 7 samples)
Process Creation                              21134.3 lps   (30.0 s, 2 samples)
Shell Scripts (1 concurrent)                  11585.5 lpm   (60.0 s, 2 samples)
Shell Scripts (8 concurrent)                   1531.9 lpm   (60.0 s, 2 samples)
System Call Overhead                        1368898.8 lps   (10.0 s, 7 samples)

System Benchmarks Index Values               BASELINE       RESULT    INDEX
Dhrystone 2 using register variables         116700.0   27431592.3   2350.6
Double-Precision Whetstone                       55.0       5690.9   1034.7
Execl Throughput                                 43.0       7973.9   1854.4
File Copy 1024 bufsize 2000 maxblocks          3960.0     364322.6    920.0
File Copy 256 bufsize 500 maxblocks            1655.0     113163.6    683.8
File Copy 4096 bufsize 8000 maxblocks          5800.0    1026998.5   1770.7
Pipe Throughput                               12440.0    1880554.5   1511.7
Pipe-based Context Switching                   4000.0     585706.5   1464.3
Process Creation                                126.0      21134.3   1677.3
Shell Scripts (1 concurrent)                     42.4      11585.5   2732.4
Shell Scripts (8 concurrent)                      6.0       1531.9   2553.1
System Call Overhead                          15000.0    1368898.8    912.6
                                                                   ========
System Benchmarks Index Score                                        1489.0
I was able to run the GeekBench tests as well, using both the older v2.1 and the most recent v2.2. Interestingly, GeekBench v2.1 shows a much better score than v2.2, I was able to get over 4800 on v2.1:
System Information
  Platform:                  Linux x86 (32-bit)
  Compiler:                  GCC 4.1.2 20070925 (Red Hat 4.1.2-33)
  Operating System:          Linux 2.6.32-238.19.1.el5.028stab092.2 i686
  Model:                     Linux PC (Intel Xeon W3520)
  Motherboard:               Unknown Motherboard
  Processor:                 Intel Xeon W3520
  Processor ID:              GenuineIntel Family 6 Model 26 Stepping 5
  Logical Processors:        2
  Physical Processors:       1
  Processor Frequency:       2.66 GHz
  L1 Instruction Cache:      0.00 B
  L1 Data Cache:             0.00 B
  L2 Cache:                  256 KB
  L3 Cache:                  0.00 B
  Bus Frequency:             0.00 Hz
  Memory:                    23.5 GB
  Memory Type:               N/A
  SIMD:                      1
  BIOS:                      N/A
  Processor Model:           Intel Xeon W3520
  Processor Cores:           2

Integer
  Blowfish
    single-threaded scalar    1856 |||||||
    multi-threaded scalar     3835 |||||||||||||||
  Text Compress
    single-threaded scalar    2105 ||||||||
    multi-threaded scalar     4001 ||||||||||||||||
  Text Decompress
    single-threaded scalar    2268 |||||||||
    multi-threaded scalar     4382 |||||||||||||||||
  Image Compress
    single-threaded scalar    1881 |||||||
    multi-threaded scalar     3453 |||||||||||||
  Image Decompress
    single-threaded scalar    1748 ||||||
    multi-threaded scalar     2021 ||||||||
  Lua
    single-threaded scalar    3541 ||||||||||||||
    multi-threaded scalar     6009 ||||||||||||||||||||||||

Floating Point
  Mandelbrot
    single-threaded scalar    2368 |||||||||
    multi-threaded scalar     4609 ||||||||||||||||||
  Dot Product
    single-threaded scalar    3870 |||||||||||||||
    multi-threaded scalar     7599 ||||||||||||||||||||||||||||||
    single-threaded vector    4129 ||||||||||||||||
    multi-threaded vector     9038 ||||||||||||||||||||||||||||||||||||
  LU Decomposition
    single-threaded scalar    2725 ||||||||||
    multi-threaded scalar     2760 |||||||||||
  Primality Test
    single-threaded scalar    3862 |||||||||||||||
    multi-threaded scalar     5952 |||||||||||||||||||||||
  Sharpen Image
    single-threaded scalar    6213 ||||||||||||||||||||||||
    multi-threaded scalar    11326 |||||||||||||||||||||||||||||||||||||||||||||
  Blur Image
    single-threaded scalar    5492 |||||||||||||||||||||
    multi-threaded scalar    10769 |||||||||||||||||||||||||||||||||||||||||||

Memory
  Read Sequential
    single-threaded scalar    5695 ||||||||||||||||||||||
  Write Sequential
    single-threaded scalar    9258 |||||||||||||||||||||||||||||||||||||
  Stdlib Allocate
    single-threaded scalar    4304 |||||||||||||||||
  Stdlib Write
    single-threaded scalar    4235 ||||||||||||||||
  Stdlib Copy
    single-threaded scalar    8554 ||||||||||||||||||||||||||||||||||

Stream
  Stream Copy
    single-threaded scalar    4829 |||||||||||||||||||
    single-threaded vector    5516 ||||||||||||||||||||||
  Stream Scale
    single-threaded scalar    4161 ||||||||||||||||
    single-threaded vector    5430 |||||||||||||||||||||
  Stream Add
    single-threaded scalar    4475 |||||||||||||||||
    single-threaded vector    5627 ||||||||||||||||||||||
  Stream Triad
    single-threaded scalar    4814 |||||||||||||||||||
    single-threaded vector    3886 |||||||||||||||

Integer Score:                3091 ||||||||||||
Floating Point Score:         5765 |||||||||||||||||||||||
Memory Score:                 6409 |||||||||||||||||||||||||
Stream Score:                 4842 |||||||||||||||||||

Overall Geekbench Score:      4865 |||||||||||||||||||
However, on v2.2, I was only able to get 4600 points:
System Information
  Platform:                  Linux x86 (32-bit)
  Compiler:                  GCC 4.1.2 20070925 (Red Hat 4.1.2-33)
  Operating System:          Linux 2.6.32-238.19.1.el5.028stab092.2 i686
  Model:                     Linux PC (Intel Xeon W3520)
  Motherboard:               Unknown Motherboard
  Processor:                 Intel Xeon W3520
  Processor ID:              GenuineIntel Family 6 Model 26 Stepping 5
  Logical Processors:        2
  Physical Processors:       1
  Processor Frequency:       2.66 GHz
  L1 Instruction Cache:      0.00 B
  L1 Data Cache:             0.00 B
  L2 Cache:                  256 KB
  L3 Cache:                  0.00 B
  Bus Frequency:             0.00 Hz
  Memory:                    23.5 GB
  Memory Type:               N/A
  SIMD:                      1
  BIOS:                      N/A
  Processor Model:           Intel Xeon W3520
  Processor Cores:           2

Integer
  Blowfish
    single-threaded scalar    1902 |||||||
    multi-threaded scalar     3477 |||||||||||||
  Text Compress
    single-threaded scalar    2113 ||||||||
    multi-threaded scalar     4012 ||||||||||||||||
  Text Decompress
    single-threaded scalar    2121 ||||||||
    multi-threaded scalar     4246 ||||||||||||||||
  Image Compress
    single-threaded scalar    1750 |||||||
    multi-threaded scalar     1704 ||||||
  Image Decompress
    single-threaded scalar    1636 ||||||
    multi-threaded scalar     2173 ||||||||
  Lua
    single-threaded scalar    3249 ||||||||||||
    multi-threaded scalar     6371 |||||||||||||||||||||||||

Floating Point
  Mandelbrot
    single-threaded scalar    2232 ||||||||
    multi-threaded scalar     4391 |||||||||||||||||
  Dot Product
    single-threaded scalar    3571 ||||||||||||||
    multi-threaded scalar     7285 |||||||||||||||||||||||||||||
    single-threaded vector    4302 |||||||||||||||||
    multi-threaded vector     9445 |||||||||||||||||||||||||||||||||||||
  LU Decomposition
    single-threaded scalar    2510 ||||||||||
    multi-threaded scalar     2545 ||||||||||
  Primality Test
    single-threaded scalar    3642 ||||||||||||||
    multi-threaded scalar     5647 ||||||||||||||||||||||
  Sharpen Image
    single-threaded scalar    6098 ||||||||||||||||||||||||
    multi-threaded scalar    11758 |||||||||||||||||||||||||||||||||||||||||||||||
  Blur Image
    single-threaded scalar    5535 ||||||||||||||||||||||
    multi-threaded scalar    10876 |||||||||||||||||||||||||||||||||||||||||||

Memory
  Read Sequential
    single-threaded scalar    4933 |||||||||||||||||||
  Write Sequential
    single-threaded scalar    8762 |||||||||||||||||||||||||||||||||||
  Stdlib Allocate
    single-threaded scalar    4016 ||||||||||||||||
  Stdlib Write
    single-threaded scalar    4052 ||||||||||||||||
  Stdlib Copy
    single-threaded scalar    7956 |||||||||||||||||||||||||||||||

Stream
  Stream Copy
    single-threaded scalar    4181 ||||||||||||||||
    single-threaded vector    5038 ||||||||||||||||||||
  Stream Scale
    single-threaded scalar    3864 |||||||||||||||
    single-threaded vector    4595 ||||||||||||||||||
  Stream Add
    single-threaded scalar    3556 ||||||||||||||
    single-threaded vector    4690 ||||||||||||||||||
  Stream Triad
    single-threaded scalar    3748 ||||||||||||||
    single-threaded vector    3515 ||||||||||||||

Integer Score:                2896 |||||||||||
Floating Point Score:         5702 ||||||||||||||||||||||
Memory Score:                 5943 |||||||||||||||||||||||
Stream Score:                 4148 ||||||||||||||||

Overall Geekbench Score:      4612 ||||||||||||||||||
Howover, both GeekBench and UnixBench results are pretty good and shows the overall performance (when using the right template!) can be impressive.
Customer Service And Support
One of the pretty unique things I have noticed when I click on submit ticket is the number of departments UptimeVPS seems to have, which, compare to many of the VPS providers who have only three departments, seems to be a lot. In particular, there is a RDNS Requests department, which is pretty interesting, I guess they must have a lot of rDNS requests coming through all the time. How about a TUN/TAP department as well?

Although I was told to check the knowledgebase first, there seems to be no information in the knowledge base. However, the ticket do gets responded pretty fast. One of my support ticket sent on a Sunday at 5:35PM was responded at 5:39PM, and just for testing sake, I actually sent a ticket to the RDNS requests department at 5:36PM and the ticket was responded 5 minutes later.
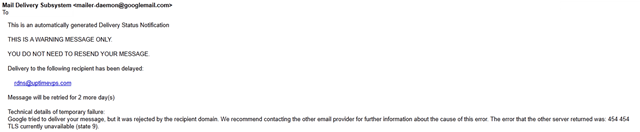
Do note, however, their support system does not allow direct email reply. In fact, an attempt to reply one of my support tickets directly via email came back with the following error:
Conclusion
Despite several minor hiccups with the invoices, OS templates set up as well as the reply via email features in their support system, overall I have had a pretty good experience testing out the VPS from UptimeVPS. The disk I/O is pretty good, network across Europe is impressive and the overall performance of the VPS is solid as shown in UnixBench and GeekBench tests. Together with a pretty fast support team, I think UptimeVPS could be one of the potential candidates to be considered for a performance VPS.
No https for solus?
@circus: Nope, I tried to explicitly type in https in the URL, and got a connection refused error, so I think it is only non-secured HTTP connection…
Not even on alternate port (ie: 5656)?
That seems to work, I was able to connect (after getting an untrusted connection warning), using https on port 5656
Pingback: UptimeVPS – €3 1GB OpenVZ VPS in Scranton, France or Germany – Low End Box
Pingback: LEB翻译"UptimeVPS – €3 1GB OpenVZ VPS in Scranton, France or Germany" | liluntoday