
96MB Low End VPS Review Part XVII – Secure Dragon Xen VPS
Secure Dragon has always offered me some pleasant surprises, and although barely two weeks ago I have reviewed their ultra-low-end 96MB OpenVZ product line, I have received an email that they are offering a Xen ultra-low-end product as well. For 16 USD/year, which is barely 2 USD more than their OpenVZ equivalent offered by Secure Dragon, I decide to give it a shot to see.
Basic Information and Set Up
As per Secure Dragon’s website, here is the detailed on their new 96MB Xen PV VPS:

Note that the swap space offered in this case is pretty big compare to the dedicated memory, which might be helpful if you need to use more than what you are assigned to once a while. However, do note that although in OpenVZ, burstable memory is actually still RAM, in Xen, the swap space is actually hard drive space, therefore it is extremely slow if large amount of swap space is used.
The sign up screen is very similar to their OpenVZ product line, basically the minimum payment period is 3 months and up to a year, also, by default, the service is semi-managed, which, according to Joe’s last response, seems to include quite a few installations and system optimization items:
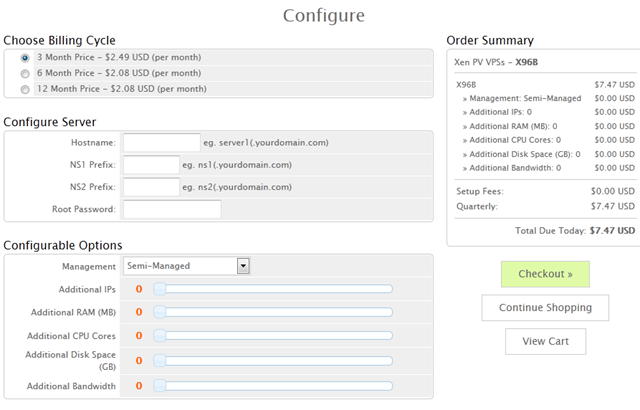
Activation seems to be instant (paid at 7:10PM and received , even though my case was a bit special because I asked to transfer from OVZ to Xen directly, and Joe has done some special tricks which managed to get me to keep my existing IP address, something I truly appreciate.
Login into the WHMCS control panel, the following functionalities are available to control the VPS:
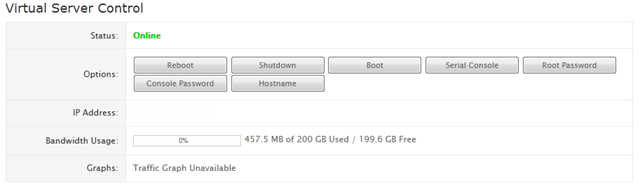
Note that only bandwidth usage percentage bar is available here, which is different from their OpenVZ product line, and none of the graphs (memory, bandwidth and CPU) are available.
Similar to their OpenVZ plan as well, the welcome email does not include root password. However, the SolusVM panel seems to still shows the non-standard HTTPS port, although according to their announcement here, they have made SolusVM login available on the standard port.
SolusVM is pretty standard, with no instant rDNS and both backup options are not available:
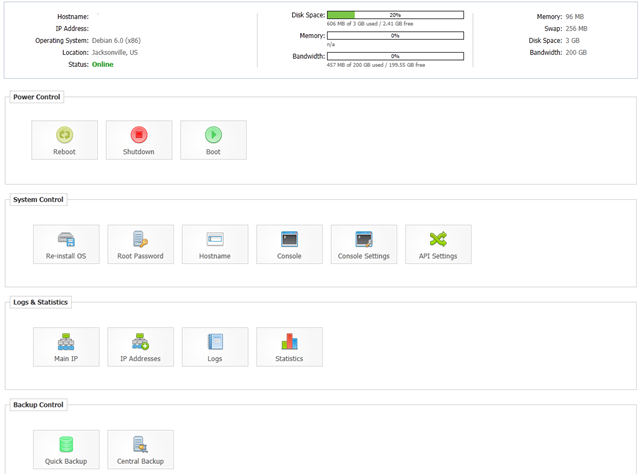
Initially, there were only 64 bit OS templates available, however as you can see in the list below, several templates have been added since, including a Debian 6 32 bit OS template:
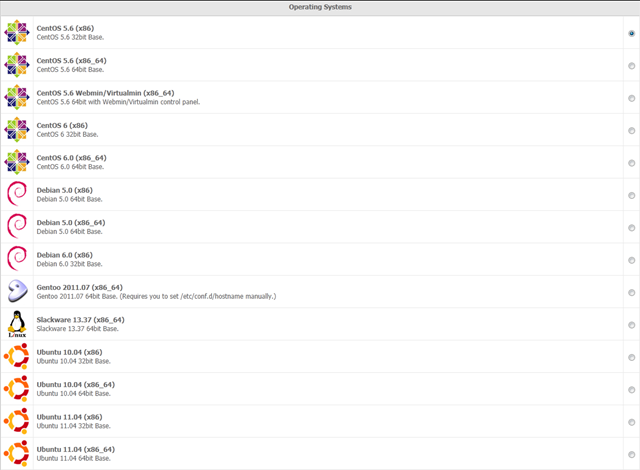
To those Debian/Ubuntu low end VPS fans, it is generally a rule of thumb that Ubuntu uses more memory than Debian and 64 bit uses more than 32 bit, so having a Debian 32 bit OS template is definitely something great!
Test on the VPS
The test VPS has 96MB of RAM, 1 CPU core, 3GB of hard drive space. As with their OpenVZ product line, their Xen VPS is in Jacksonville, FL as well. Initially, since there was no 32 bit OS template, I actually put up Debian 6 64 bit OS template, and the mysterious part is, the RAM amount shows 96MB when the 64 bit OS template was installed:
free -m
             total       used       free     shared    buffers     cached
Mem:            96         93          2          0         32         29
-/+ buffers/cache:         32         63
Swap:          255         27        228
as well as the corresponding top output:
top - 23:15:44 up 3 days, 13:17,  1 user,  load average: 0.00, 0.00, 0.00
Tasks:  43 total,   1 running,  42 sleeping,   0 stopped,   0 zombie
Cpu(s):  0.0%us,  0.0%sy,  0.0%ni,100.0%id,  0.0%wa,  0.0%hi,  0.0%si,  0.0%st
Mem:     98520k total,    96344k used,     2176k free,    32804k buffers
Swap:   262136k total,    27900k used,   234236k free,    29836k cached

  PID USER      PR  NI  VIRT  RES  SHR S %CPU %MEM    TIME+  COMMAND
30684 www       20   0  110m  13m 4008 S  0.0 13.8   0:13.44 php-fpm
30685 www       20   0  106m 9148 3972 S  0.0  9.3   0:14.18 php-fpm
30683 root      20   0  104m 5744 1124 S  0.0  5.8   0:28.82 php-fpm
 9101 root      20   0 17552 1760 1308 S  0.0  1.8   0:00.00 bash
 9100 root      20   0 23012 1340  876 S  0.0  1.4   0:00.02 dropbear
 9106 root      20   0 18924 1256  992 R  0.0  1.3   0:00.00 top
14427 www       20   0 50144 1068  676 S  0.0  1.1   0:03.58 nginx
24377 mysql     20   0 61208 1024  708 S  0.0  1.0   0:00.00 mysqld
 1102 root      20   0 12248  308  236 S  0.0  0.3   0:01.92 syslogd
 1119 root      20   0 10392  200  148 S  0.0  0.2   0:03.34 dropbear
10489 root      20   0 20900  168  112 S  0.0  0.2   0:00.30 cron
 9972 Debian-e  20   0 42792  112   56 S  0.0  0.1   0:00.06 exim4
    1 root      20   0 10392   88   56 S  0.0  0.1   0:02.48 init
  859 root      20   0  3780   52   28 S  0.0  0.1   0:06.74 logsave
  941 root      20   0  3780   52   28 S  0.0  0.1   0:06.80 logsave
 1400 root      20   0  3800    4    4 S  0.0  0.0   0:00.00 getty
 1401 root      20   0  3800    4    4 S  0.0  0.0   0:00.00 getty
However, after installing the 32 bit OS template, for some mysterious reasons, the total amount shown is only 89MB:
free -m
             total       used       free     shared    buffers     cached
Mem:            89         19         69          0          0         10
-/+ buffers/cache:          8         81
Swap:          255          0        255
And again, the corresponding top output shows the same:
top - 01:47:47 up 3 min,  2 users,  load average: 0.00, 0.00, 0.00
Tasks:  45 total,   1 running,  44 sleeping,   0 stopped,   0 zombie
Cpu(s):  0.0%us,  0.0%sy,  0.0%ni,100.0%id,  0.0%wa,  0.0%hi,  0.0%si,  0.0%st
Mem:     91936k total,    20808k used,    71128k free,      960k buffers
Swap:   262136k total,        0k used,   262136k free,    11028k cached

  PID USER      PR  NI  VIRT  RES  SHR S %CPU %MEM    TIME+  COMMAND
  522 root      20   0  8264 2876 2324 S  0.0  3.1   0:00.02 sshd
  518 root      20   0  2984 1624 1284 S  0.0  1.8   0:00.00 bash
  524 root      20   0  2972 1612 1288 S  0.0  1.8   0:00.00 bash
  464 root      20   0 27320 1448 1020 S  0.0  1.6   0:00.00 rsyslogd
  517 root      20   0  2568 1332 1020 S  0.0  1.4   0:00.01 login
  529 root      20   0  2340 1108  896 R  0.0  1.2   0:00.00 top
  494 root      20   0  5500  980  584 S  0.0  1.1   0:00.00 sshd
  487 root      20   0  2300  772  600 S  0.0  0.8   0:00.00 cron
  138 root      16  -4  2264  752  416 S  0.0  0.8   0:00.02 udevd
    1 root      20   0  2040  716  616 S  0.0  0.8   0:00.18 init
  196 root      18  -2  2260  648  316 S  0.0  0.7   0:00.00 udevd
  202 root      18  -2  2260  644  312 S  0.0  0.7   0:00.00 udevd
  511 root      20   0  1712  556  476 S  0.0  0.6   0:00.00 getty
  512 root      20   0  1712  552  476 S  0.0  0.6   0:00.00 getty
  513 root      20   0  1712  552  476 S  0.0  0.6   0:00.00 getty
  514 root      20   0  1712  552  476 S  0.0  0.6   0:00.00 getty
  515 root      20   0  1712  552  476 S  0.0  0.6   0:00.00 getty
Although some of the RAM has “disappeared”, it is nontheless good to see how much RAM (32MB Vs 8MB) is saved by switching to the 32 bit OS template, making it a better choice.
Since the RAM usage is already so low, not so much could be saved even when I ran the famous Low End Script:
 free -m
             total       used       free     shared    buffers     cached
Mem:            89         17         72          0          0          9
-/+ buffers/cache:          7         82
Swap:          255          0        255
And the top output shows the components running:
top - 01:57:59 up 5 min,  1 user,  load average: 0.00, 0.00, 0.00
Tasks:  45 total,   1 running,  44 sleeping,   0 stopped,   0 zombie
Cpu(s):  0.0%us,  0.0%sy,  0.0%ni, 99.3%id,  0.7%wa,  0.0%hi,  0.0%si,  0.0%st
Mem:     91936k total,    18240k used,    73696k free,      936k buffers
Swap:   262136k total,        0k used,   262136k free,     9808k cached

  PID USER      PR  NI  VIRT  RES  SHR S %CPU %MEM    TIME+  COMMAND
  526 root      20   0  2972 1616 1292 S  0.0  1.8   0:00.00 bash
  525 root      20   0  2412 1256  836 S  0.0  1.4   0:00.10 dropbear
  531 root      20   0  2340 1116  896 R  0.0  1.2   0:00.00 top
  496 root      20   0  2300  768  600 S  0.0  0.8   0:00.00 cron
  142 root      16  -4  2264  748  416 S  0.0  0.8   0:00.02 udevd
    1 root      20   0  2040  712  616 S  0.0  0.8   0:00.19 init
  475 root      20   0  1960  704  576 S  0.0  0.8   0:00.00 syslogd
  192 root      18  -2  2260  636  308 S  0.0  0.7   0:00.00 udevd
  199 root      18  -2  2260  636  308 S  0.0  0.7   0:00.00 udevd
  517 root      20   0  1712  556  476 S  0.0  0.6   0:00.00 getty
  519 root      20   0  1712  556  476 S  0.0  0.6   0:00.00 getty
  522 root      20   0  1712  556  476 S  0.0  0.6   0:00.00 getty
  516 root      20   0  1712  552  476 S  0.0  0.6   0:00.00 getty
  520 root      20   0  1712  552  476 S  0.0  0.6   0:00.00 getty
  521 root      20   0  1712  552  476 S  0.0  0.6   0:00.00 getty
  518 root      20   0  1712  548  476 S  0.0  0.6   0:00.00 getty
  502 root      20   0  2096  484  380 S  0.0  0.5   0:00.00 dropbear
As you can see, bash still ate up most of the memory and for some mystrious reasons, I have a hard time getting rid of bash even though dash was installed and I have even explicitly ran
dpkg-reconfigure dash
to make sure dash is the default shell and rebooted the VPS afterwards. Furthermore, there are several processes tied to getty, which I was hoping to find some ways to lower the number of processes further here. However, overall, I am happy with the 7MB of memory usage.
Even after the entire LNMP stack was installed, the memory usage remains very low, using only 23MB of RAM:
 free -m
             total       used       free     shared    buffers     cached
Mem:            89         87          2          0          3         60
-/+ buffers/cache:         23         66
Swap:          255          4        251
With 5 PHP children processes running, I would say such a low memory footprint is something great:
top - 12:08:54 up  2:16,  1 user,  load average: 0.00, 0.00, 0.00
Tasks:  55 total,   1 running,  54 sleeping,   0 stopped,   0 zombie
Cpu(s):  0.0%us,  0.0%sy,  0.0%ni,100.0%id,  0.0%wa,  0.0%hi,  0.0%si,  0.0%st
Mem:     91936k total,    89628k used,     2308k free,     3080k buffers
Swap:   262136k total,     4960k used,   257176k free,    62064k cached

  PID USER      PR  NI  VIRT  RES  SHR S %CPU %MEM    TIME+  COMMAND
 8463 www       20   0 14508  10m  412 S  0.0 11.6   0:00.01 nginx
 8451 root      20   0 22716 4564 1400 S  0.0  5.0   0:00.55 php-cgi
 8453 www       20   0 22716 4172 1008 S  0.0  4.5   0:00.00 php-cgi
 8454 www       20   0 22716 4172 1008 S  0.0  4.5   0:00.00 php-cgi
 8455 www       20   0 22716 4172 1008 S  0.0  4.5   0:00.00 php-cgi
 8456 www       20   0 22716 4172 1008 S  0.0  4.5   0:00.00 php-cgi
 8457 www       20   0 22716 4172 1008 S  0.0  4.5   0:00.00 php-cgi
 8491 root      20   0  2340 1124  900 R  0.3  1.2   0:00.01 top
  526 root      20   0  2972  708  556 S  0.0  0.8   0:00.02 bash
 8461 root      20   0  4696  704  264 S  0.0  0.8   0:00.00 nginx
  525 root      20   0  2520  312  172 S  0.0  0.3   0:01.18 dropbear
  475 root      20   0  1960  292  232 S  0.0  0.3   0:00.01 syslogd
21040 mysql     20   0 34816  196  192 S  0.0  0.2   0:00.00 mysqld
  496 root      20   0  2300  164  116 S  0.0  0.2   0:00.01 cron
20938 root      20   0  1756  156  152 S  0.0  0.2   0:00.01 mysqld_safe
    1 root      20   0  2040  108   80 S  0.0  0.1   0:00.26 init
  345 root      20   0  1676   52   28 S  0.0  0.1   0:00.20 logsave
The meminfo output shows the same 32 bit Vs 64 bit issue as well, since they are probably all derived from the same sources:
First the 32 bit, which shows 89MB of RAM in total:
cat /proc/meminfo
MemTotal:          91936 kB
MemFree:            2312 kB
Buffers:           10456 kB
Cached:            40996 kB
SwapCached:          828 kB
Active:            44504 kB
Inactive:          34884 kB
Active(anon):      16600 kB
Inactive(anon):    18800 kB
Active(file):      27904 kB
Inactive(file):    16084 kB
Unevictable:           0 kB
Mlocked:               0 kB
HighTotal:             0 kB
HighFree:              0 kB
LowTotal:          91936 kB
LowFree:            2312 kB
SwapTotal:        262136 kB
SwapFree:         259224 kB
Dirty:                 0 kB
Writeback:             0 kB
AnonPages:         27300 kB
Mapped:            16340 kB
Shmem:              7464 kB
Slab:               7572 kB
SReclaimable:       5664 kB
SUnreclaim:         1908 kB
KernelStack:         416 kB
PageTables:          804 kB
NFS_Unstable:          0 kB
Bounce:                0 kB
WritebackTmp:          0 kB
CommitLimit:      308104 kB
Committed_AS:      92292 kB
VmallocTotal:     761848 kB
VmallocUsed:         648 kB
VmallocChunk:     761052 kB
HardwareCorrupted:     0 kB
HugePages_Total:       0
HugePages_Free:        0
HugePages_Rsvd:        0
HugePages_Surp:        0
Hugepagesize:       2048 kB
DirectMap4k:       98304 kB
DirectMap2M:           0 kB
Next the 64 bit version, which shows the actual 96MB of RAM:
cat /proc/meminfo
MemTotal:        98520 kB
MemFree:          3100 kB
Buffers:           692 kB
Cached:          62624 kB
SwapCached:        928 kB
Active:          22880 kB
Inactive:        55080 kB
SwapTotal:      262136 kB
SwapFree:       234232 kB
Dirty:              28 kB
Writeback:           0 kB
AnonPages:       14668 kB
Mapped:           6556 kB
Slab:             6848 kB
SReclaimable:     3304 kB
SUnreclaim:       3544 kB
PageTables:          0 kB
NFS_Unstable:        0 kB
Bounce:              0 kB
WritebackTmp:        0 kB
CommitLimit:    311396 kB
Committed_AS:    81532 kB
VmallocTotal: 34359738367 kB
VmallocUsed:       272 kB
VmallocChunk: 34359738095 kB
Fortunately, the only difference here are shown on the RAM amount, CPU remains to be one core (obviously!):
cat /proc/cpuinfo
processor       : 0
vendor_id       : GenuineIntel
cpu family      : 6
model           : 15
model name      : Intel(R) Xeon(R) CPU            5150  @ 2.66GHz
stepping        : 6
cpu MHz         : 2660.000
cache size      : 4096 KB
physical id     : 0
siblings        : 1
core id         : 0
cpu cores       : 1
apicid          : 0
initial apicid  : 6
fpu             : yes
fpu_exception   : yes
cpuid level     : 10
wp              : yes
flags           : fpu tsc msr pae cx8 apic cmov pat clflush acpi mmx fxsr sse ss                                                                             e2 ss ht syscall nx lm constant_tsc up rep_good pni vmx est ssse3 cx16 lahf_lm
bogomips        : 5322.94
clflush size    : 64
cache_alignment : 64
address sizes   : 36 bits physical, 48 bits virtual
power management:
It is good to know that the CPU is not throttled, making it pretty useful even with just a single core.
Hard drive space is not oversold and the Inodes given set to pretty high value:
 df -i
Filesystem            Inodes   IUsed   IFree IUse% Mounted on
/dev/sda1             393216   85247  307969   22% /
tmpfs                  12315       3   12312    1% /lib/init/rw
udev                   12315     899   11416    8% /dev
tmpfs                  12315       3   12312    1% /dev/shm
 df -h
Filesystem            Size  Used Avail Use% Mounted on
/dev/sda1             3.0G  2.4G  481M  84% /
tmpfs                  49M     0   49M   0% /lib/init/rw
udev                   10M  500K  9.6M   5% /dev
tmpfs                  49M  4.0K   49M   1% /dev/shm
vmstat shows the node is very lightly used:
procs -----------memory---------- ---swap-- -----io---- -system-- ----cpu----
 r  b   swpd   free   buff  cache   si   so    bi    bo   in   cs us sy id wa
 0  0  27900   2368  32824  29852   22   16    41    32   25   34  1  0 97  3
The similar results shows in the output of uptime:
uptime
 23:47:42 up 3 days, 13:49,  1 user,  load average: 0.00, 0.00, 0.00
Disk I/O results are pretty good, I was able to get close to 50MB/s consistently in both time:
dd if=/dev/zero of=test bs=64k count=16k conv=fdatasync
16384+0 records in
16384+0 records out
1073741824 bytes (1.1 GB) copied, 21.6401 s, 49.6 MB/s
Take two is slightly worse, however it is still not bad and is usable on a 96MB RAM VPS:
dd if=/dev/zero of=test bs=64k count=16k conv=fdatasync
16384+0 records in
16384+0 records out
1073741824 bytes (1.1 GB) copied, 23.7185 s, 45.3 MB/s
The network speed, unfortunately, is a big lagging behind considering it is on an 100Mbps port, I was only able to achieve less than 30Mbps downloading from Cachefly:
wget cachefly.cachefly.net/100mb.test
--2011-08-05 23:53:59--  http://cachefly.cachefly.net/100mb.test
Resolving cachefly.cachefly.net... 205.234.175.175
Connecting to cachefly.cachefly.net|205.234.175.175|:80... connected.
HTTP request sent, awaiting response... 200 OK
Length: 104857600 (100M) [application/octet-stream]
Saving to: `100mb.test'

100%[======================================>] 104,857,600 3.04M/s   in 34s

2011-08-05 23:54:34 (2.98 MB/s) - `100mb.test' saved [104857600/104857600]
Trying it for the second time, unfortunately, did not do any better:
 wget cachefly.cachefly.net/100mb.test
--2011-08-08 10:31:41--  http://cachefly.cachefly.net/100mb.test
Resolving cachefly.cachefly.net... 205.234.175.175
Connecting to cachefly.cachefly.net|205.234.175.175|:80... connected.
HTTP request sent, awaiting response... 200 OK
Length: 104857600 (100M) [application/octet-stream]
Saving to: `100mb.test'

100%[======================================>] 104,857,600 1.74M/s   in 58s

2011-08-08 10:32:39 (1.72 MB/s) - `100mb.test' saved [104857600/104857600]
The upload speed of the VPS, unfortunately, does not get a lot better:
From a BuyVM VPS in Fremont, CA:
 wget 8.22.203.164/100mb.test
--2011-08-08 10:35:19--  http://8.22.203.164/100mb.test
Connecting to 8.22.203.164:80... connected.
HTTP request sent, awaiting response... 200 OK
Length: 104857600 (100M) [application/octet-stream]
Saving to: `100mb.test'

100%[======================================>] 104,857,600  780K/s   in 2m 19s

2011-08-08 10:37:38 (738 KB/s) - `100mb.test' saved [104857600/104857600]
From Nix Communications VPS in Montreal, Canada, the speed is a lot better, but still less than 30Mbps:
 wget 8.22.203.164/100mb.test
--2011-08-08 06:46:46--  http://8.22.203.164/100mb.test
Connecting to 8.22.203.164:80... connected.
HTTP request sent, awaiting response... 200 OK
Length: 104857600 (100M) [application/octet-stream]
Saving to: `100mb.test'

100%[======================================>] 104,857,600 3.32M/s   in 32s

2011-08-08 06:47:18 (3.17 MB/s) - `100mb.test' saved [104857600/104857600]
Finally, the QuickWeb VPS in London, UK, being geographically furthest from the three test VPS used, shows the slowest among all as well:
--2011-08-07 22:48:46--  http://8.22.203.164/100mb.test
Connecting to 8.22.203.164:80... connected.
HTTP request sent, awaiting response... 200 OK
Length: 104857600 (100M) [application/octet-stream]
Saving to: `100mb.test'

100%[======================================>] 104,857,600 1.92M/s   in 2m 38s

2011-08-07 22:51:24 (650 KB/s) - `100mb.test' saved [104857600/104857600]

FINISHED --2011-08-07 22:51:24--
Downloaded: 1 files, 100M in 2m 38s (650 KB/s)
Finally, the benchmark time! And once again, the 32 bit OS shows how much better it gets when comparing against the 64 bit OS running on the exactly same VPS:
First, the 64 bit OS version, when running UnixBench, it scored close to 500, which is not bad considering the low amount of resources offered:
   #    #  #    #  #  #    #          #####   ######  #    #   ####   #    #
   #    #  ##   #  #   #  #           #    #  #       ##   #  #    #  #    #
   #    #  # #  #  #    ##            #####   #####   # #  #  #       ######
   #    #  #  # #  #    ##            #    #  #       #  # #  #       #    #
   #    #  #   ##  #   #  #           #    #  #       #   ##  #    #  #    #
    ####   #    #  #  #    #          #####   ######  #    #   ####   #    #

   Version 5.1.3                      Based on the Byte Magazine Unix Benchmark

   Multi-CPU version                  Version 5 revisions by Ian Smith,
                                      Sunnyvale, CA, USA
   January 13, 2011                   johantheghost at yahoo period com

1 x Dhrystone 2 using register variables  1 2 3 4 5 6 7 8 9 10

1 x Double-Precision Whetstone  1 2 3 4 5 6 7 8 9 10

1 x Execl Throughput  1 2 3

1 x File Copy 1024 bufsize 2000 maxblocks  1 2 3

1 x File Copy 256 bufsize 500 maxblocks  1 2 3

1 x File Copy 4096 bufsize 8000 maxblocks  1 2 3

1 x Pipe Throughput  1 2 3 4 5 6 7 8 9 10

1 x Pipe-based Context Switching  1 2 3 4 5 6 7 8 9 10

1 x Process Creation  1 2 3

1 x System Call Overhead  1 2 3 4 5 6 7 8 9 10

1 x Shell Scripts (1 concurrent)  1 2 3

1 x Shell Scripts (8 concurrent)  1 2 3

========================================================================
   BYTE UNIX Benchmarks (Version 5.1.3)

   System: sd: GNU/Linux
   OS: GNU/Linux -- 2.6.26-2-xen-amd64 -- #1 SMP Mon Jun 13 18:44:16 UTC 2011
   Machine: x86_64 (unknown)
   Language: en_US.utf8 (charmap="ANSI_X3.4-1968", collate="ANSI_X3.4-1968")
   CPU 0: Intel(R) Xeon(R) CPU 5150 @ 2.66GHz (5322.9 bogomips)
          Hyper-Threading, x86-64, MMX, Physical Address Ext, SYSCALL/SYSRET, Intel virtualization
   23:56:57 up 3 days, 13:59,  1 user,  load average: 0.16, 0.19, 0.12; runlevel 2

------------------------------------------------------------------------
Benchmark Run: Fri Aug 05 2011 23:56:57 - 00:25:48
1 CPU in system; running 1 parallel copy of tests

Dhrystone 2 using register variables       23931826.1 lps   (10.0 s, 7 samples)
Double-Precision Whetstone                     3100.6 MWIPS (10.0 s, 7 samples)
Execl Throughput                               1855.1 lps   (29.6 s, 2 samples)
File Copy 1024 bufsize 2000 maxblocks        309269.1 KBps  (30.0 s, 2 samples)
File Copy 256 bufsize 500 maxblocks           85851.5 KBps  (30.0 s, 2 samples)
File Copy 4096 bufsize 8000 maxblocks         51763.7 KBps  (30.0 s, 2 samples)
Pipe Throughput                              490387.9 lps   (10.0 s, 7 samples)
Pipe-based Context Switching                 119788.5 lps   (10.0 s, 7 samples)
Process Creation                               4071.2 lps   (30.0 s, 2 samples)
Shell Scripts (1 concurrent)                   4657.5 lpm   (60.0 s, 2 samples)
Shell Scripts (8 concurrent)                    596.0 lpm   (60.0 s, 2 samples)
System Call Overhead                         434328.3 lps   (10.0 s, 7 samples)

System Benchmarks Index Values               BASELINE       RESULT    INDEX
Dhrystone 2 using register variables         116700.0   23931826.1   2050.7
Double-Precision Whetstone                       55.0       3100.6    563.7
Execl Throughput                                 43.0       1855.1    431.4
File Copy 1024 bufsize 2000 maxblocks          3960.0     309269.1    781.0
File Copy 256 bufsize 500 maxblocks            1655.0      85851.5    518.7
File Copy 4096 bufsize 8000 maxblocks          5800.0      51763.7     89.2
Pipe Throughput                               12440.0     490387.9    394.2
Pipe-based Context Switching                   4000.0     119788.5    299.5
Process Creation                                126.0       4071.2    323.1
Shell Scripts (1 concurrent)                     42.4       4657.5   1098.5
Shell Scripts (8 concurrent)                      6.0        596.0    993.4
System Call Overhead                          15000.0     434328.3    289.6
                                                                   ========
System Benchmarks Index Score                                         495.2
However, if this is not impressive enough, then take a look at the UnixBench score running under the 32 bit OS:
   #    #  #    #  #  #    #          #####   ######  #    #   ####   #    #
   #    #  ##   #  #   #  #           #    #  #       ##   #  #    #  #    #
   #    #  # #  #  #    ##            #####   #####   # #  #  #       ######
   #    #  #  # #  #    ##            #    #  #       #  # #  #       #    #
   #    #  #   ##  #   #  #           #    #  #       #   ##  #    #  #    #
    ####   #    #  #  #    #          #####   ######  #    #   ####   #    #

   Version 5.1.3                      Based on the Byte Magazine Unix Benchmark

   Multi-CPU version                  Version 5 revisions by Ian Smith,
                                      Sunnyvale, CA, USA
   January 13, 2011                   johantheghost at yahoo period com

1 x Dhrystone 2 using register variables  1 2 3 4 5 6 7 8 9 10

1 x Double-Precision Whetstone  1 2 3 4 5 6 7 8 9 10

1 x Execl Throughput  1 2 3

1 x File Copy 1024 bufsize 2000 maxblocks  1 2 3

1 x File Copy 256 bufsize 500 maxblocks  1 2 3

1 x File Copy 4096 bufsize 8000 maxblocks  1 2 3

1 x Pipe Throughput  1 2 3 4 5 6 7 8 9 10

1 x Pipe-based Context Switching  1 2 3 4 5 6 7 8 9 10

1 x Process Creation  1 2 3

1 x System Call Overhead  1 2 3 4 5 6 7 8 9 10

1 x Shell Scripts (1 concurrent)  1 2 3

1 x Shell Scripts (8 concurrent)  1 2 3

========================================================================
   BYTE UNIX Benchmarks (Version 5.1.3)

   System: sd: GNU/Linux
   OS: GNU/Linux -- 2.6.32-5-686-bigmem -- #1 SMP Mon Jun 13 05:03:09 UTC 2011
   Machine: i686 (unknown)
   Language: en_US.utf8 (charmap="UTF-8", collate="UTF-8")
   CPU 0: Intel(R) Xeon(R) CPU 5150 @ 2.66GHz (5320.0 bogomips)
          Hyper-Threading, MMX, Physical Address Ext, Intel virtualization
   07:38:54 up 1 day, 21:46,  1 user,  load average: 0.00, 0.00, 0.00; runlevel 2

------------------------------------------------------------------------
Benchmark Run: Mon Aug 08 2011 07:38:54 - 08:07:08
1 CPU in system; running 1 parallel copy of tests

Dhrystone 2 using register variables       13893805.9 lps   (10.0 s, 7 samples)
Double-Precision Whetstone                     2235.3 MWIPS (10.1 s, 7 samples)
Execl Throughput                               2343.2 lps   (29.9 s, 2 samples)
File Copy 1024 bufsize 2000 maxblocks        397830.4 KBps  (30.4 s, 2 samples)
File Copy 256 bufsize 500 maxblocks          128561.0 KBps  (30.1 s, 2 samples)
File Copy 4096 bufsize 8000 maxblocks        509820.0 KBps  (30.0 s, 2 samples)
Pipe Throughput                              719697.1 lps   (10.0 s, 7 samples)
Pipe-based Context Switching                 100125.1 lps   (10.0 s, 7 samples)
Process Creation                               4319.0 lps   (30.0 s, 2 samples)
Shell Scripts (1 concurrent)                   4016.8 lpm   (60.0 s, 2 samples)
Shell Scripts (8 concurrent)                    498.3 lpm   (60.1 s, 2 samples)
System Call Overhead                         538699.0 lps   (10.0 s, 7 samples)

System Benchmarks Index Values               BASELINE       RESULT    INDEX
Dhrystone 2 using register variables         116700.0   13893805.9   1190.6
Double-Precision Whetstone                       55.0       2235.3    406.4
Execl Throughput                                 43.0       2343.2    544.9
File Copy 1024 bufsize 2000 maxblocks          3960.0     397830.4   1004.6
File Copy 256 bufsize 500 maxblocks            1655.0     128561.0    776.8
File Copy 4096 bufsize 8000 maxblocks          5800.0     509820.0    879.0
Pipe Throughput                               12440.0     719697.1    578.5
Pipe-based Context Switching                   4000.0     100125.1    250.3
Process Creation                                126.0       4319.0    342.8
Shell Scripts (1 concurrent)                     42.4       4016.8    947.4
Shell Scripts (8 concurrent)                      6.0        498.3    830.5
System Call Overhead                          15000.0     538699.0    359.1
                                                                   ========
System Benchmarks Index Score                                         607.7
As you can see, the score improved by more than 100 points by using the 32 bit OS instead of 64 bit one!
For the GeekBench tests, I can only run the 32 bit version since 64 bit version require purchase the software. The tests on the 32 bit OS nontheless showed a pretty good score that is consistent with the UnixBench score:
System Information
  Platform:                  Linux x86 (32-bit)
  Compiler:                  GCC 4.1.2 20070925 (Red Hat 4.1.2-33)
  Operating System:          Linux 2.6.32-5-686-bigmem i686
  Model:                     Linux PC (Intel Xeon 5150)
  Motherboard:               Unknown Motherboard
  Processor:                 Intel Xeon 5150
  Processor ID:              GenuineIntel Family 6 Model 15 Stepping 6
  Logical Processors:        1
  Physical Processors:       1
  Processor Frequency:       2.66 GHz
  L1 Instruction Cache:      0.00 B
  L1 Data Cache:             0.00 B
  L2 Cache:                  4.00 MB
  L3 Cache:                  0.00 B
  Bus Frequency:             0.00 Hz
  Memory:                    89.8 MB
  Memory Type:               N/A
  SIMD:                      1
  BIOS:                      N/A
  Processor Model:           Intel Xeon 5150
  Processor Cores:           1

Integer
  Blowfish
    single-threaded scalar    1906 |||||||
    multi-threaded scalar     2041 ||||||||
  Text Compress
    single-threaded scalar    2153 ||||||||
    multi-threaded scalar     2097 ||||||||
  Text Decompress
    single-threaded scalar    1918 |||||||
    multi-threaded scalar     1967 |||||||
  Image Compress
    single-threaded scalar    1844 |||||||
    multi-threaded scalar     1808 |||||||
  Image Decompress
    single-threaded scalar    1570 ||||||
    multi-threaded scalar     1596 ||||||
  Lua
    single-threaded scalar    3144 ||||||||||||
    multi-threaded scalar     3274 |||||||||||||

Floating Point
  Mandelbrot
    single-threaded scalar    1990 |||||||
    multi-threaded scalar     2021 ||||||||
  Dot Product
    single-threaded scalar    3641 ||||||||||||||
    multi-threaded scalar     3858 |||||||||||||||
    single-threaded vector    2714 ||||||||||
    multi-threaded vector     3099 ||||||||||||
  LU Decomposition
    single-threaded scalar    2196 ||||||||
    multi-threaded scalar     2240 ||||||||
  Primality Test
    single-threaded scalar    3114 ||||||||||||
    multi-threaded scalar     2498 |||||||||
  Sharpen Image
    single-threaded scalar    6227 ||||||||||||||||||||||||
    multi-threaded scalar     6267 |||||||||||||||||||||||||
  Blur Image
    single-threaded scalar    4686 ||||||||||||||||||
    multi-threaded scalar     4717 ||||||||||||||||||

Memory
  Read Sequential
    single-threaded scalar    2484 |||||||||
  Write Sequential
    single-threaded scalar    2973 |||||||||||
  Stdlib Allocate
    single-threaded scalar    2080 ||||||||
  Stdlib Write
    single-threaded scalar     997 |||
  Stdlib Copy
    single-threaded scalar    2055 ||||||||

Stream
  Stream Copy
    single-threaded scalar    1867 |||||||
    single-threaded vector    2035 ||||||||
  Stream Scale
    single-threaded scalar    1934 |||||||
    single-threaded vector    1973 |||||||
  Stream Add
    single-threaded scalar    1790 |||||||
    single-threaded vector    2072 ||||||||
  Stream Triad
    single-threaded scalar    1969 |||||||
    single-threaded vector    1545 ||||||

Integer Score:                2109 ||||||||
Floating Point Score:         3519 ||||||||||||||
Memory Score:                 2117 ||||||||
Stream Score:                 1898 |||||||

Overall Geekbench Score:      2582 ||||||||||
Take Two gives a pretty consistent score:
System Information
  Platform:                  Linux x86 (32-bit)
  Compiler:                  GCC 4.1.2 20070925 (Red Hat 4.1.2-33)
  Operating System:          Linux 2.6.32-5-686-bigmem i686
  Model:                     Linux PC (Intel Xeon 5150)
  Motherboard:               Unknown Motherboard
  Processor:                 Intel Xeon 5150
  Processor ID:              GenuineIntel Family 6 Model 15 Stepping 6
  Logical Processors:        1
  Physical Processors:       1
  Processor Frequency:       2.66 GHz
  L1 Instruction Cache:      0.00 B
  L1 Data Cache:             0.00 B
  L2 Cache:                  4.00 MB
  L3 Cache:                  0.00 B
  Bus Frequency:             0.00 Hz
  Memory:                    89.8 MB
  Memory Type:               N/A
  SIMD:                      1
  BIOS:                      N/A
  Processor Model:           Intel Xeon 5150
  Processor Cores:           1

Integer
  Blowfish
    single-threaded scalar    1905 |||||||
    multi-threaded scalar     2042 ||||||||
  Text Compress
    single-threaded scalar    2173 ||||||||
    multi-threaded scalar     2081 ||||||||
  Text Decompress
    single-threaded scalar    1919 |||||||
    multi-threaded scalar     1955 |||||||
  Image Compress
    single-threaded scalar    1823 |||||||
    multi-threaded scalar     1794 |||||||
  Image Decompress
    single-threaded scalar    1570 ||||||
    multi-threaded scalar     1594 ||||||
  Lua
    single-threaded scalar    3137 ||||||||||||
    multi-threaded scalar     3267 |||||||||||||

Floating Point
  Mandelbrot
    single-threaded scalar    1990 |||||||
    multi-threaded scalar     2020 ||||||||
  Dot Product
    single-threaded scalar    3640 ||||||||||||||
    multi-threaded scalar     3845 |||||||||||||||
    single-threaded vector    2713 ||||||||||
    multi-threaded vector     3096 ||||||||||||
  LU Decomposition
    single-threaded scalar    2200 ||||||||
    multi-threaded scalar     2250 |||||||||
  Primality Test
    single-threaded scalar    3109 ||||||||||||
    multi-threaded scalar     2481 |||||||||
  Sharpen Image
    single-threaded scalar    6198 ||||||||||||||||||||||||
    multi-threaded scalar     6250 |||||||||||||||||||||||||
  Blur Image
    single-threaded scalar    4660 ||||||||||||||||||
    multi-threaded scalar     4724 ||||||||||||||||||

Memory
  Read Sequential
    single-threaded scalar    2496 |||||||||
  Write Sequential
    single-threaded scalar    3023 ||||||||||||
  Stdlib Allocate
    single-threaded scalar    2054 ||||||||
  Stdlib Write
    single-threaded scalar     994 |||
  Stdlib Copy
    single-threaded scalar    2019 ||||||||

Stream
  Stream Copy
    single-threaded scalar    1871 |||||||
    single-threaded vector    2112 ||||||||
  Stream Scale
    single-threaded scalar    1934 |||||||
    single-threaded vector    1949 |||||||
  Stream Add
    single-threaded scalar    1808 |||||||
    single-threaded vector    2091 ||||||||
  Stream Triad
    single-threaded scalar    1972 |||||||
    single-threaded vector    1537 ||||||

Integer Score:                2105 ||||||||
Floating Point Score:         3512 ||||||||||||||
Memory Score:                 2117 ||||||||
Stream Score:                 1909 |||||||

Overall Geekbench Score:      2580 ||||||||||
Overall, this ultra-low-end VPS shows a pretty good performance, and other than the network speed, most of the other components are either in par or better than many other VPS with similar specifications.
Customer Service and Support
As this was already mentioned in the previous post, I would not waste everyone’s time and go over the details again. Overall, I have had pretty good support experience with them, with most of the my tickets answered within a few hours.
Conclusion
Although Secure Dragon is a pretty young company in the VPS hosting world, it has not failed to generate enough noises, from ultra-low-end VPS at ultra-low-end price, to proudly making declarations that “overselling makes us cry”, Secure Dragon has definitely made itself pretty famous within the ultra-low-end VPS world. The Xen VPS that they have provided is in general pretty solid, and other than network speed, most of the other aspects have either met or exceeded the expectation considering the resources offered in the plan. The 32 bit OS templates is an added bonus since many providers, for whatever the reasons are, do not like to include 32 bit OS template for Xen VPS. The low memory print makes this ultra-low-end VPS very suitable for general tasks that do not require extensive use of fast network.
To free more memory you can replace bash with pdksh and remove all getty (/etc/inittab). This tool also help -> http://www.pixelbeat.org/scripts/ps_mem.py 🙂
@circus: I actually tried to replace bash with dash (that is what LEA did in his script) but somehow that failed to work…Since now you mentioned pdksh, I guess I will give that a shot, thanks for the suggestions! However, would running a python tool use even more memory since python itself uses a lot of memory?
That tool is use only to see how much memory an app uses, then you can find a lighter alternative 🙂 -> the output is something like this -> http://pastebin.com/raw.php?i=D0zYB87B
Actually dash is already the default sh in squeeze. I replaced bash with pdksh for my login shell, you can use dash for login shell but it will suck (no tab completion) 😛
To quickly change your login shell, just edit /etc/passwd (ie: replace /bin/bash with /bin/ksh)
@circus: I actually ended up using chsh and change the shell to /bin/dash from /bin/bash, and then reboot the machine (may be I just need to log out and log back in, but whatever, reboot did the trick). Dash is a little bit of a pain because you do not get to see the current directory, which is something I need to get used to…but with the full LNMP stack using 23MB of memory, there is hardly anything for me to complain about 🙂
I just wanted to give you a heads up on the download speed issue with our 96MB Xen plans. We did some testing and found this to be because of the amount of RAM provided. We are working on a solution for this and hope to have an announcement available this Sunday (preliminary talks will result in excellent news for our current clients)!
More info here: https://securedragon.net/knowledgebase.php?action=displayarticle&id=45
Interesting, I have always thought the download speed is related to the network speed and nothing else, anyways, hope to hear some good news from you guys soon!
Well we talked about it a lot on Sunday but it looks like we can get 60-70Mbps if we use a non-PyGrub OS (which the only one we have is CentOS 5.6 x86_64). We are working with another provider to see if we can resolve the speed issue but if not, it looks like we have 3 options:
1) We stop offering the X96B plan and instead replace the plan with a 128MB plan and replace the 128MB plan with a slightly cheaper 192MB plan.
2) We continue offering the X96B plan but instead of advertising a 100Mbps port, we advertise a more accurate speed of what the users can expect.
3) We drop our “budget” plans all together (96MB and 128MB and focus on our performance plans for Xen since those are the only plans that are able to obtain 100Mbps with any OS Template.
@KuJoe: Mmm…you will see a disappointed 96MB Admin if you decide to close down the low end VPS option 🙂
We decided to no longer offer the X96B plan but if you are currently using it, then you’re welcome to continue using it or you can upgrade to the X128B plan for a one-time upgrade fee of $4 while keeping your same pricing.
I signed up for XEN 128mb from Secure Dragon after reading this review, and I’m very happy. I am a newbie to VPS, but Secure Dragon is very helpful. And the performance is great. Thanks for providing good servers. I hope your business stay very long