
96MB Low End VPS Review Part 60–Your Domain Goes Here
As 96MB.com grows everyday, so is the number of requests for a review of the services, and as the pile grows up, there is often one or two that tend to slide through the crack. YourDomainGoesHere (YDGH) is one of them, I have ordered and being paying for their services for more than half a year and each and every time I paid my invoice, I kept telling myself I will need to get this review done next week, and…the cycle just repeated.
So finally, I have decided to write about them and take a look at how their services are performing.
(On a side note, I do pay for every VPS that I have written on this blog, except the ones that I labeled clearly as part of the promotions/beta testing, I will normally ask for a refund for the VPS that I paid purely for review purposes – only after the review has been published and if it is within the provider’s money back guarantee time period, therefore in this case, I will just pay for the VPS from YDGH since obviously it has gone way over their money back guarantee period).
Basic Information and Set Up
Here is the VPS that I have ordered when YDGH had their promotion on LET:

Initially, their Chicago location was sold out (for some reason Chicago seems to be their most popular area, and it is normally the first one YDGH sold out whenever they have a sale) and I had to order the one in Dallas first. However, I have submitted a ticket for them and they actually remembered to reply to my tickets a few weeks later when they had stock in Chicago and offered to cancel my Dallas VPS and moved everything to the Chicago location.
Their homepage is actually pretty nicely designed, and although I am not exactly a fan of their background picture, I actually really like the slider:
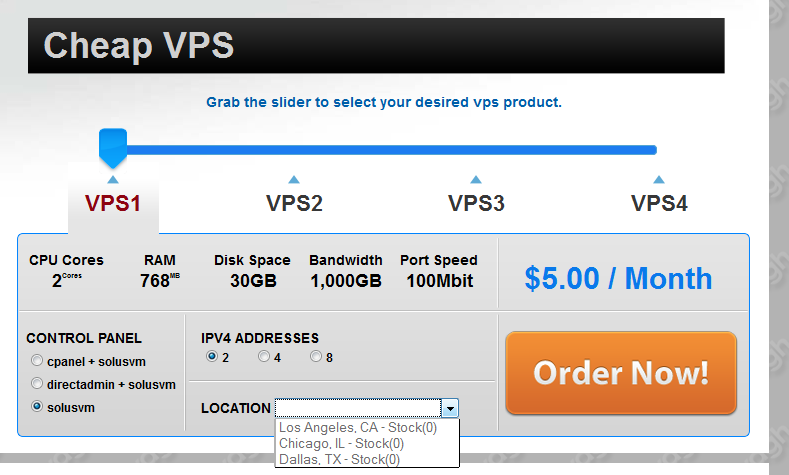
As you can see, at the moment, there is no stock on the lowest plan in all three areas, YDGH, for some reason, seems to have the same principle as BuyVM, where not having enough stock all the time is something good.
Note that they included SolusVM among all three options for control panels, but this does not mean you get a SolusVM master or slave license, instead, it just means you will be able to use SolusVM to control your VPS. CPanel, however, will set you back an extra 15 USD per month, which is the same as the outside price and DirectAdmin will set you back an extra 7.95 USD per month, which is not any cheaper than the regular market price. By default, the plan comes with 2 IP addresses and extra IP address is a dollar each.
Their larger plans have pretty interesting pricing as well, while most of the providers would offer a price of either a full dollar amount or something like .99 or .95 cents, their price for the third-largest plan ends with .88, so is the largest plan they have:
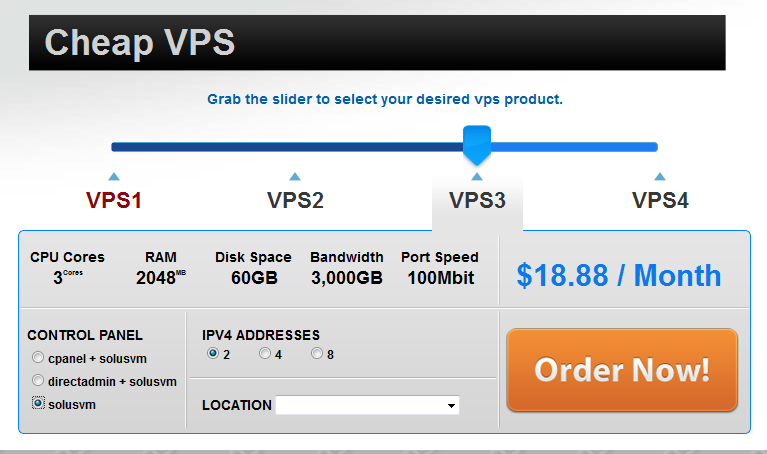
Also, unlike most of the providers w ho tend to advertise dedicated and swap RAM separately, they do not actually advertise that. For example, the plan that I have received has 512MB of dedicated RAM and 512MB of burstable RAM, which is not the same as what people would normally think when they see a 1024GB RAM plan, I believe I have read at least one complain about the way YDGH advertise the RAM amount on LowEndTalk before, but I guess it is their business and their decision.
Provision was instant and it was pretty interesting when I received the email, the subject actually stated “New Dedicated Server Information”. Of course I would be insane (or rather they would be) if they have offered me a dedicated server at that price. Everything else was pretty standard though.
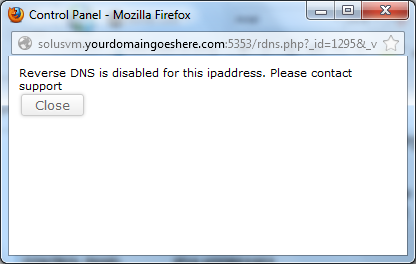
SolusVM is on non-standard HTTP port and there is no instant rDNS and nor any centralized backup feature.
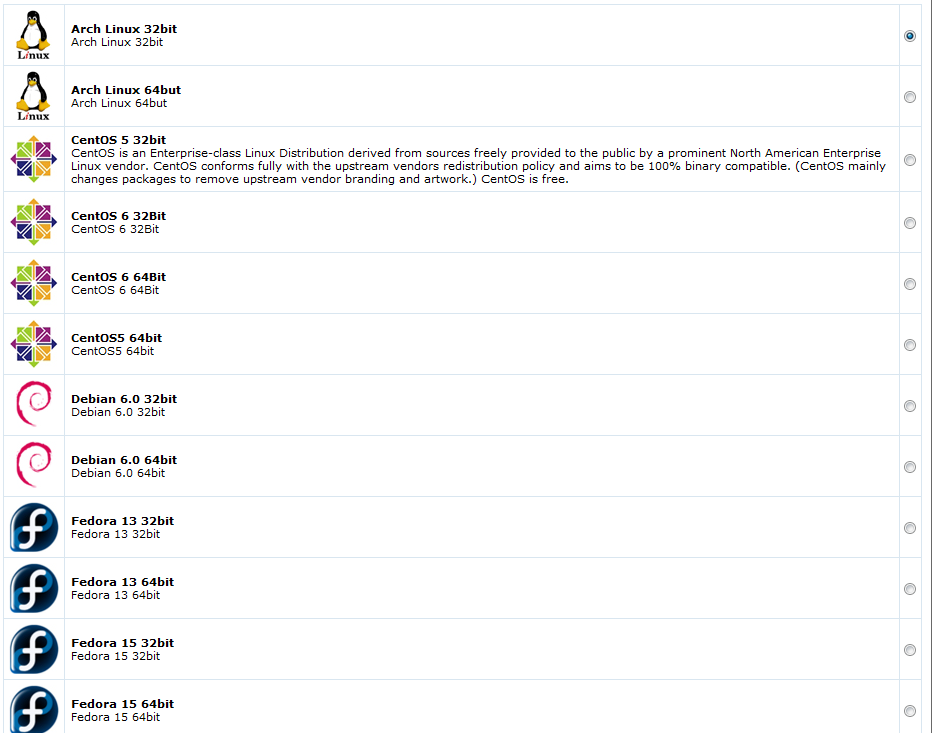
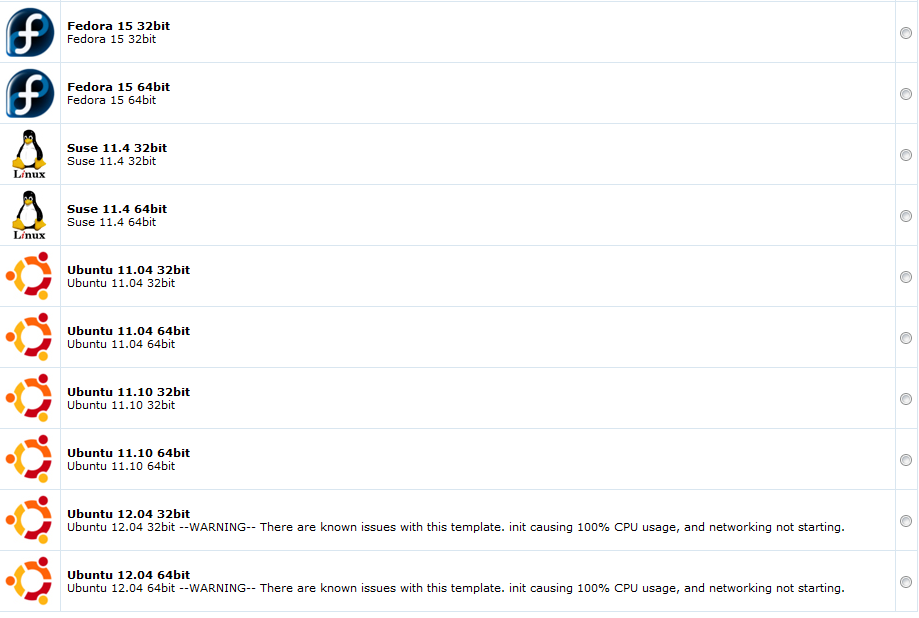
There are quite a few common OS template for reinstallation:
Test on the VPS
As mentioned above, the VPS that I have bought is an OpenVZ VPS with 512MB of dedicated RAM and 512MB of burstable RAM, the server is located in Continuum DC in Chicago, IL and I have installed Debian 6 32 bit for testing purposes.
Probably because I have left this server running for a while and completely forgot about it, it is actually one of the servers that I have the longest uptime so far (of course, other than the uptime of this server that this blog sits on):
 uptime
 09:06:42 up 54 days, 18:11,  1 user,  load average: 0.00, 0.00, 0.00
Therefore it was difficult for me to say goodbye to the uptime and reinstall the system for testing, however I guess it is worth when the readers like you gets a good view of the services YDGH provides via the review.
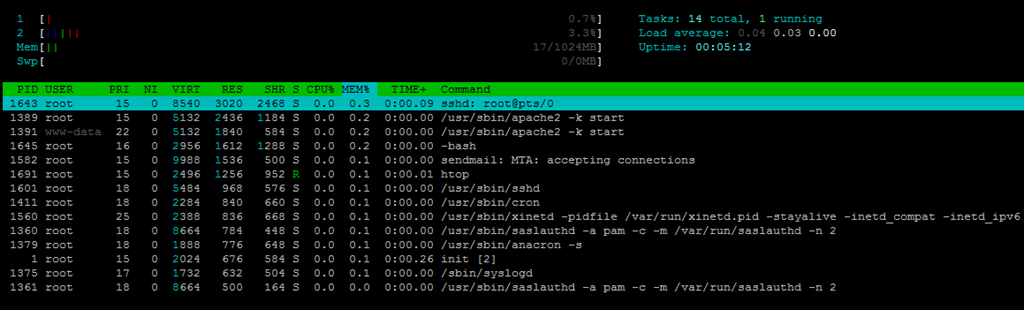
When the OS template was first loaded, about 16MB of RAM was used, which is quite standard for the Debian 6 installation:
free -m
             total       used       free     shared    buffers     cached
Mem:          1024         16       1007          0          0          0
-/+ buffers/cache:         16       1007
Swap:            0          0          0
Top showing the processes running:
top - 21:55:08 up 12 min,  1 user,  load average: 0.00, 0.00, 0.00
Tasks:  14 total,   2 running,  12 sleeping,   0 stopped,   0 zombie
Cpu(s):  0.0%us,  0.0%sy,  0.0%ni,100.0%id,  0.0%wa,  0.0%hi,  0.0%si,  0.0%st
Mem:   1048576k total,    16840k used,  1031736k free,        0k buffers
Swap:        0k total,        0k used,        0k free,        0k cached

  PID USER      PR  NI  VIRT  RES  SHR S %CPU %MEM    TIME+  COMMAND
 1655 root      18   0  8672 3020 2468 R    0  0.3   0:00.07 sshd
 1389 root      15   0  5132 2436 1184 S    0  0.2   0:00.00 apache2
 1390 www-data  20   0  5132 1844  584 S    0  0.2   0:00.00 apache2
 1679 root      15   0  2956 1608 1288 S    0  0.2   0:00.00 bash
 1582 root      18   0  9988 1548  500 S    0  0.1   0:00.00 sendmail-mta
 1686 root      15   0  2324 1064  872 R    0  0.1   0:00.00 top
 1601 root      18   0  5484  968  576 S    0  0.1   0:00.00 sshd
 1411 root      18   0  2284  840  660 S    0  0.1   0:00.00 cron
 1560 root      25   0  2388  832  668 S    0  0.1   0:00.00 xinetd
 1360 root      18   0  8664  788  448 S    0  0.1   0:00.00 saslauthd
 1379 root      18   0  1888  780  648 S    0  0.1   0:00.00 anacron
    1 root      18   0  2024  676  584 S    0  0.1   0:00.40 init
 1375 root      15   0  1732  628  504 S    0  0.1   0:00.00 syslogd
 1361 root      18   0  8664  504  164 S    0  0.0   0:00.00 saslauthd
And htop output:
Slightly more than 400MB of hard drive space was used after the install, which was pretty reasonable:
df -h
Filesystem            Size  Used Avail Use% Mounted on
/dev/simfs             30G  413M   30G   2% /
tmpfs                 512M     0  512M   0% /lib/init/rw
tmpfs                 512M     0  512M   0% /dev/shm
And the inodes are set to pretty reasonable values:
 df -i
Filesystem            Inodes   IUsed   IFree IUse% Mounted on
/dev/simfs           15728640   26125 15702515    1% /
tmpfs                 131072       4  131068    1% /lib/init/rw
tmpfs                 131072       1  131071    1% /dev/shm
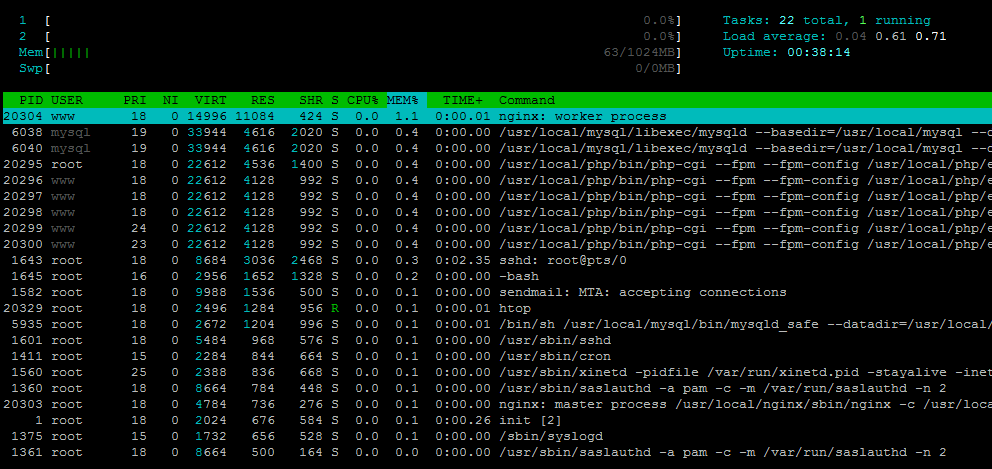
When the full LNMP stack was loaded, about 63MB of RAM was used:
 free -m
             total       used       free     shared    buffers     cached
Mem:          1024         63        960          0          0          0
-/+ buffers/cache:         63        960
Swap:            0          0          0
Top output showing the processes running:
top - 04:48:50 up  3:06,  1 user,  load average: 0.00, 0.00, 0.00
Tasks:  21 total,   2 running,  19 sleeping,   0 stopped,   0 zombie
Cpu(s):  0.0%us,  0.0%sy,  0.0%ni,100.0%id,  0.0%wa,  0.0%hi,  0.0%si,  0.0%st
Mem:   1048576k total,    65100k used,   983476k free,        0k buffers
Swap:        0k total,        0k used,        0k free,        0k cached

  PID USER      PR  NI  VIRT  RES  SHR S %CPU %MEM    TIME+  COMMAND
21589 www       21   0 14992  10m  416 S    0  1.1   0:00.00 nginx
21570 mysql     19   0 33944 4624 2020 S    0  0.4   0:00.00 mysqld
21580 root      18   0 22620 4540 1400 S    0  0.4   0:00.05 php-cgi
21581 www       18   0 22620 4132  992 S    0  0.4   0:00.00 php-cgi
21582 www       18   0 22620 4132  992 S    0  0.4   0:00.00 php-cgi
21583 www       18   0 22620 4132  992 S    0  0.4   0:00.00 php-cgi
21584 www       18   0 22620 4132  992 S    0  0.4   0:00.00 php-cgi
21585 www       25   0 22620 4132  992 S    0  0.4   0:00.00 php-cgi
 1655 root      15   0  8816 3220 2484 R    0  0.3   0:02.30 sshd
 1679 root      15   0  2956 1652 1328 S    0  0.2   0:00.00 bash
20443 root      18   0  2672 1200  996 S    0  0.1   0:00.00 mysqld_safe
21826 root      15   0  2324 1076  880 R    0  0.1   0:00.00 top
 1601 root      18   0  5484  968  576 S    0  0.1   0:00.00 sshd
 1411 root      15   0  2284  832  664 S    0  0.1   0:00.00 cron
 1560 root      25   0  2388  832  668 S    0  0.1   0:00.00 xinetd
 1582 root      15   0  9988  716  500 S    0  0.1   0:00.01 sendmail-mta
21588 root      19   0  4780  708  276 S    0  0.1   0:00.00 nginx
And htop output:
About 1.6GB of hard drive space was used:
df -h
Filesystem            Size  Used Avail Use% Mounted on
/dev/simfs             30G  1.6G   29G   6% /
tmpfs                 512M     0  512M   0% /lib/init/rw
tmpfs                 512M     0  512M   0% /dev/shm
And iNodes are set to pretty standard values:
 df -i
Filesystem            Inodes   IUsed   IFree IUse% Mounted on
/dev/simfs           15728640   69283 15659357    1% /
tmpfs                 131072       4  131068    1% /lib/init/rw
tmpfs                 131072       1  131071    1% /dev/shm
Note that the template is somewhat “broken” when I initially ran apt upgrade:
Ign http://ftp.debian.org squeeze/updates/main i386 Packages
Ign http://ftp.debian.org squeeze/updates/contrib i386 Packages
Ign http://ftp.debian.org squeeze/updates/non-free i386 Packages
Err http://ftp.debian.org squeeze/updates/main i386 Packages
  404  Not Found
Err http://ftp.debian.org squeeze/updates/contrib i386 Packages
  404  Not Found
Err http://ftp.debian.org squeeze/updates/non-free i386 Packages
  404  Not Found
Fetched 6833 kB in 6s (1016 kB/s)
W: Failed to fetch http://ftp.debian.org/debian-security/dists/squeeze/updates/main/binary-i386/Packages.gz  404  Not Found

W: Failed to fetch http://ftp.debian.org/debian-security/dists/squeeze/updates/contrib/binary-i386/Packages.gz  404  Not Found

W: Failed to fetch http://ftp.debian.org/debian-security/dists/squeeze/updates/non-free/binary-i386/Packages.gz  404  Not Found

E: Some index files failed to download, they have been ignored, or old ones used instead.
However changing the http to ftp in the apt sources seems to have fixed this problem.
CPU info shows it was assigned two virtual CPU cores on a Quad-core Q9300 CPU:
cat /proc/cpuinfo
processor       : 0
vendor_id       : GenuineIntel
cpu family      : 6
model           : 23
model name      : Intel(R) Core(TM)2 Quad  CPU   Q9300  @ 2.50GHz
stepping        : 7
cpu MHz         : 2493.750
cache size      : 3072 KB
physical id     : 0
siblings        : 4
core id         : 0
cpu cores       : 4
apicid          : 0
fpu             : yes
fpu_exception   : yes
cpuid level     : 10
wp              : yes
flags           : fpu vme de pse tsc msr pae mce cx8 apic sep mtrr pge mca cmov pat pse36 clflush dts acpi mmx fxsr sse sse2 ss ht tm syscall nx lm constant_tsc pni monitor ds_cpl vmx smx est tm2 ssse3 cx16 xtpr sse4_1 lahf_lm
bogomips        : 4987.50
clflush size    : 64
cache_alignment : 64
address sizes   : 36 bits physical, 48 bits virtual
power management:

processor       : 1
vendor_id       : GenuineIntel
cpu family      : 6
model           : 23
model name      : Intel(R) Core(TM)2 Quad  CPU   Q9300  @ 2.50GHz
stepping        : 7
cpu MHz         : 2493.750
cache size      : 3072 KB
physical id     : 0
siblings        : 4
core id         : 2
cpu cores       : 4
apicid          : 2
fpu             : yes
fpu_exception   : yes
cpuid level     : 10
wp              : yes
flags           : fpu vme de pse tsc msr pae mce cx8 apic sep mtrr pge mca cmov pat pse36 clflush dts acpi mmx fxsr sse sse2 ss ht tm syscall nx lm constant_tsc pni monitor ds_cpl vmx smx est tm2 ssse3 cx16 xtpr sse4_1 lahf_lm
bogomips        : 4987.51
clflush size    : 64
cache_alignment : 64
address sizes   : 36 bits physical, 48 bits virtual
power management:
The interesting bit was shown when I ran vzfree, and it shows only half of the swap was committed. The fact that there is swap usage, even though the VPS was more or less running at the bare minimum, may not be a good sign and indicate at least some level of overselling:
 vzfree
             Total     Used     Free
Kernel:   2048.00M    2.98M 2045.02M
Allocate: 1024.00M   76.69M  947.31M (512M Guaranteed)
Commit:    512.00M   39.77M  472.23M (48.0% of Allocated)
Swap:                18.37M          (49.9% of Committed)
Meminfo for those who are interested:
cat /proc/meminfo
MemTotal:      1048576 kB
MemFree:        970196 kB
Buffers:             0 kB
Cached:              0 kB
SwapCached:          0 kB
Active:              0 kB
Inactive:            0 kB
HighTotal:           0 kB
HighFree:            0 kB
LowTotal:      1048576 kB
LowFree:        970196 kB
SwapTotal:           0 kB
SwapFree:            0 kB
Dirty:           14040 kB
Writeback:           0 kB
AnonPages:           0 kB
Mapped:              0 kB
Slab:                0 kB
PageTables:          0 kB
NFS_Unstable:        0 kB
Bounce:              0 kB
CommitLimit:         0 kB
Committed_AS:        0 kB
VmallocTotal:        0 kB
VmallocUsed:         0 kB
VmallocChunk:        0 kB
HugePages_Total:     0
HugePages_Free:      0
HugePages_Rsvd:      0
Hugepagesize:     2048 kB
And time sync:
 time sync

real    0m0.530s
user    0m0.000s
sys     0m0.008s
The disk I/O speed was rather unimpressive during the test:
 dd if=/dev/zero of=test bs=64k count=16k conv=fdatasync
16384+0 records in
16384+0 records out
1073741824 bytes (1.1 GB) copied, 45.9206 s, 23.4 MB/s
Testing again did not improve too much either:
dd if=/dev/zero of=test bs=64k count=16k conv=fdatasync
16384+0 records in
16384+0 records out
1073741824 bytes (1.1 GB) copied, 33.0416 s, 32.5 MB/s
The ioping results were somewhat inconsistent as well, which could be an indicator of an oversold node:
ioping -c 10 .
4096 bytes from . (simfs /dev/simfs): request=1 time=60.2 ms
4096 bytes from . (simfs /dev/simfs): request=2 time=49.4 ms
4096 bytes from . (simfs /dev/simfs): request=3 time=15.7 ms
4096 bytes from . (simfs /dev/simfs): request=4 time=76.0 ms
4096 bytes from . (simfs /dev/simfs): request=5 time=33.1 ms
4096 bytes from . (simfs /dev/simfs): request=6 time=9.1 ms
4096 bytes from . (simfs /dev/simfs): request=7 time=13.3 ms
4096 bytes from . (simfs /dev/simfs): request=8 time=10.2 ms
4096 bytes from . (simfs /dev/simfs): request=9 time=26.0 ms
4096 bytes from . (simfs /dev/simfs): request=10 time=6.9 ms

--- . (simfs /dev/simfs) ioping statistics ---
10 requests completed in 9313.6 ms, 33 iops, 0.1 mb/s
min/avg/max/mdev = 6.9/30.0/76.0/23.0 ms
And testing again:
 ioping -c 10 .
4096 bytes from . (simfs /dev/simfs): request=1 time=59.3 ms
4096 bytes from . (simfs /dev/simfs): request=2 time=5.8 ms
4096 bytes from . (simfs /dev/simfs): request=3 time=7.9 ms
4096 bytes from . (simfs /dev/simfs): request=4 time=28.3 ms
4096 bytes from . (simfs /dev/simfs): request=5 time=73.0 ms
4096 bytes from . (simfs /dev/simfs): request=6 time=13.3 ms
4096 bytes from . (simfs /dev/simfs): request=7 time=8.6 ms
4096 bytes from . (simfs /dev/simfs): request=8 time=10.2 ms
4096 bytes from . (simfs /dev/simfs): request=9 time=21.4 ms
4096 bytes from . (simfs /dev/simfs): request=10 time=24.2 ms

--- . (simfs /dev/simfs) ioping statistics ---
10 requests completed in 9257.0 ms, 40 iops, 0.2 mb/s
min/avg/max/mdev = 5.8/25.2/73.0/21.9 ms
Despite the not-so-great disk I/O speed, the network speed is actually pretty impressive:
 wget cachefly.cachefly.net/100mb.test -O /dev/null
--2012-11-09 10:59:49--  http://cachefly.cachefly.net/100mb.test
Resolving cachefly.cachefly.net... 205.234.175.175
Connecting to cachefly.cachefly.net|205.234.175.175|:80... connected.
HTTP request sent, awaiting response... 200 OK
Length: 104857600 (100M) [application/octet-stream]
Saving to: `/dev/null'

100%[======================================>] 104,857,600 11.3M/s   in 9.1s

2012-11-09 10:59:58 (11.0 MB/s) - `/dev/null' saved [104857600/104857600]
Considering the port speed is 100mbit, this download speed is close to the port speed.
Downloading again showed similar results:
 wget cachefly.cachefly.net/100mb.test -O /dev/null
--2012-11-09 11:00:44--  http://cachefly.cachefly.net/100mb.test
Resolving cachefly.cachefly.net... 205.234.175.175
Connecting to cachefly.cachefly.net|205.234.175.175|:80... connected.
HTTP request sent, awaiting response... 200 OK
Length: 104857600 (100M) [application/octet-stream]
Saving to: `/dev/null'

100%[======================================>] 104,857,600 11.3M/s   in 8.9s

2012-11-09 11:00:53 (11.3 MB/s) - `/dev/null' saved [104857600/104857600]
For the upload test, the geographical location was once again the decisive factor:
First for the Quickweb VPS located in Chicago, IL (only a few miles away from where this VPS was located:
 wget 216.231.xxx.xxx/100mb.test -O /dev/null
--2012-11-08 22:02:45--  http://216.231.xxx.xxx/100mb.test
Connecting to 216.231.xxx.xxx:80... connected.
HTTP request sent, awaiting response... 200 OK
Length: 104857600 (100M) [application/octet-stream]
Saving to: `/dev/null'

100%[======================================>] 104,857,600 11.1M/s   in 9.0s

2012-11-08 22:02:54 (11.1 MB/s) - `/dev/null' saved [104857600/104857600]
As you can see, the upload speed is close to the port speed as well.
For the other test VPS located in Los Angeles, CA, the speed is significantly less impressive, although I would say is still pretty good for a 100mbit port:
wget 216.231.xxx.xxx/100mb.test -O /dev/null
--2012-11-09 11:07:51--  http://216.231.xxx.xxx/100mb.test
Connecting to 216.231.xxx.xxx:80... connected.
HTTP request sent, awaiting response... 200 OK
Length: 104857600 (100M) [application/octet-stream]
Saving to: `/dev/null'

100%[======================================>] 104,857,600 7.57M/s   in 16s

2012-11-09 11:08:07 (6.25 MB/s) - `/dev/null' saved [104857600/104857600]
Finally, for the XenVZ test VPS located in Maidenhead, UK, the speed is a lot slower:
wget 216.231.xxx.xxx/100mb.test -O /dev/null
--2012-11-09 11:00:37--  http://216.231.xxx.xxx/100mb.test
Connecting to 216.231.xxx.xxx:80... connected.
HTTP request sent, awaiting response... 200 OK
Length: 104857600 (100M) [application/octet-stream]
Saving to: `/dev/null'

100%[======================================>] 104,857,600 6.67M/s   in 27s

2012-11-09 11:01:04 (3.70 MB/s) - `/dev/null' saved [104857600/104857600]
For the benchmark testing, I honestly did not hope for too much, but was fairly glad to see close to 1000 points on the UnixBench tests:
   #    #  #    #  #  #    #          #####   ######  #    #   ####   #    #
   #    #  ##   #  #   #  #           #    #  #       ##   #  #    #  #    #
   #    #  # #  #  #    ##            #####   #####   # #  #  #       ######
   #    #  #  # #  #    ##            #    #  #       #  # #  #       #    #
   #    #  #   ##  #   #  #           #    #  #       #   ##  #    #  #    #
    ####   #    #  #  #    #          #####   ######  #    #   ####   #    #

   Version 5.1.3                      Based on the Byte Magazine Unix Benchmark

   Multi-CPU version                  Version 5 revisions by Ian Smith,
                                      Sunnyvale, CA, USA
   January 13, 2011                   johantheghost at yahoo period com


1 x Dhrystone 2 using register variables  1 2 3 4 5 6 7 8 9 10

1 x Double-Precision Whetstone  1 2 3 4 5 6 7 8 9 10

1 x Execl Throughput  1 2 3

1 x File Copy 1024 bufsize 2000 maxblocks  1 2 3

1 x File Copy 256 bufsize 500 maxblocks  1 2 3

1 x File Copy 4096 bufsize 8000 maxblocks  1 2 3

1 x Pipe Throughput  1 2 3 4 5 6 7 8 9 10

1 x Pipe-based Context Switching  1 2 3 4 5 6 7 8 9 10

1 x Process Creation  1 2 3

1 x System Call Overhead  1 2 3 4 5 6 7 8 9 10

1 x Shell Scripts (1 concurrent)  1 2 3

1 x Shell Scripts (8 concurrent)  1 2 3

2 x Dhrystone 2 using register variables  1 2 3 4 5 6 7 8 9 10

2 x Double-Precision Whetstone  1 2 3 4 5 6 7 8 9 10

2 x Execl Throughput  1 2 3

2 x File Copy 1024 bufsize 2000 maxblocks  1 2 3

2 x File Copy 256 bufsize 500 maxblocks  1 2 3

2 x File Copy 4096 bufsize 8000 maxblocks  1 2 3

2 x Pipe Throughput  1 2 3 4 5 6 7 8 9 10

2 x Pipe-based Context Switching  1 2 3 4 5 6 7 8 9 10

2 x Process Creation  1 2 3

2 x System Call Overhead  1 2 3 4 5 6 7 8 9 10

2 x Shell Scripts (1 concurrent)  1 2 3

2 x Shell Scripts (8 concurrent)  1 2 3

========================================================================
   BYTE UNIX Benchmarks (Version 5.1.3)

   System: xxxxx: GNU/Linux
   OS: GNU/Linux -- 2.6.32-274.3.1.el5.028stab094.3 -- #1 SMP Thu Sep 22 13:24:07 MSD 2011
   Machine: i686 (unknown)
   Language: en_US.utf8 (charmap="ANSI_X3.4-1968", collate="ANSI_X3.4-1968")
   CPU 0: Intel(R) Core(TM)2 Quad CPU Q9300 @ 2.50GHz (4987.5 bogomips)
          Hyper-Threading, x86-64, MMX, Physical Address Ext, SYSENTER/SYSEXIT, SYSCALL/SYSRET, Intel virtualization
   CPU 1: Intel(R) Core(TM)2 Quad CPU Q9300 @ 2.50GHz (4987.5 bogomips)
          Hyper-Threading, x86-64, MMX, Physical Address Ext, SYSENTER/SYSEXIT, SYSCALL/SYSRET, Intel virtualization
   23:53:40 up 40 min,  1 user,  load average: 0.00, 0.36, 0.60; runlevel 2

------------------------------------------------------------------------
Benchmark Run: Sat Oct 27 2012 23:53:40 - 00:22:17
2 CPUs in system; running 1 parallel copy of tests

Dhrystone 2 using register variables       10416228.7 lps   (10.0 s, 7 samples)
Double-Precision Whetstone                     2271.4 MWIPS (10.3 s, 7 samples)
Execl Throughput                               3378.7 lps   (29.3 s, 2 samples)
File Copy 1024 bufsize 2000 maxblocks        345537.8 KBps  (30.0 s, 2 samples)
File Copy 256 bufsize 500 maxblocks          102642.2 KBps  (30.0 s, 2 samples)
File Copy 4096 bufsize 8000 maxblocks        719422.2 KBps  (30.0 s, 2 samples)
Pipe Throughput                              714408.5 lps   (10.0 s, 7 samples)
Pipe-based Context Switching                 207499.7 lps   (10.0 s, 7 samples)
Process Creation                               9059.2 lps   (30.0 s, 2 samples)
Shell Scripts (1 concurrent)                   3933.7 lpm   (60.0 s, 2 samples)
Shell Scripts (8 concurrent)                    781.5 lpm   (60.1 s, 2 samples)
System Call Overhead                         588173.7 lps   (10.0 s, 7 samples)

System Benchmarks Index Values               BASELINE       RESULT    INDEX
Dhrystone 2 using register variables         116700.0   10416228.7    892.6
Double-Precision Whetstone                       55.0       2271.4    413.0
Execl Throughput                                 43.0       3378.7    785.8
File Copy 1024 bufsize 2000 maxblocks          3960.0     345537.8    872.6
File Copy 256 bufsize 500 maxblocks            1655.0     102642.2    620.2
File Copy 4096 bufsize 8000 maxblocks          5800.0     719422.2   1240.4
Pipe Throughput                               12440.0     714408.5    574.3
Pipe-based Context Switching                   4000.0     207499.7    518.7
Process Creation                                126.0       9059.2    719.0
Shell Scripts (1 concurrent)                     42.4       3933.7    927.8
Shell Scripts (8 concurrent)                      6.0        781.5   1302.6
System Call Overhead                          15000.0     588173.7    392.1
                                                                   ========
System Benchmarks Index Score                                         721.0

------------------------------------------------------------------------
Benchmark Run: Sun Oct 28 2012 00:22:17 - 00:50:51
2 CPUs in system; running 2 parallel copies of tests

Dhrystone 2 using register variables       22138840.9 lps   (10.0 s, 7 samples)
Double-Precision Whetstone                     4133.2 MWIPS (9.8 s, 7 samples)
Execl Throughput                               5087.7 lps   (29.6 s, 2 samples)
File Copy 1024 bufsize 2000 maxblocks        217814.2 KBps  (30.0 s, 2 samples)
File Copy 256 bufsize 500 maxblocks           65848.7 KBps  (30.1 s, 2 samples)
File Copy 4096 bufsize 8000 maxblocks        497121.6 KBps  (30.0 s, 2 samples)
Pipe Throughput                             1374523.3 lps   (10.0 s, 7 samples)
Pipe-based Context Switching                 432314.0 lps   (10.0 s, 7 samples)
Process Creation                              14865.6 lps   (30.0 s, 2 samples)
Shell Scripts (1 concurrent)                   5361.1 lpm   (60.0 s, 2 samples)
Shell Scripts (8 concurrent)                    801.7 lpm   (60.1 s, 2 samples)
System Call Overhead                         978904.5 lps   (10.0 s, 7 samples)

System Benchmarks Index Values               BASELINE       RESULT    INDEX
Dhrystone 2 using register variables         116700.0   22138840.9   1897.1
Double-Precision Whetstone                       55.0       4133.2    751.5
Execl Throughput                                 43.0       5087.7   1183.2
File Copy 1024 bufsize 2000 maxblocks          3960.0     217814.2    550.0
File Copy 256 bufsize 500 maxblocks            1655.0      65848.7    397.9
File Copy 4096 bufsize 8000 maxblocks          5800.0     497121.6    857.1
Pipe Throughput                               12440.0    1374523.3   1104.9
Pipe-based Context Switching                   4000.0     432314.0   1080.8
Process Creation                                126.0      14865.6   1179.8
Shell Scripts (1 concurrent)                     42.4       5361.1   1264.4
Shell Scripts (8 concurrent)                      6.0        801.7   1336.1
System Call Overhead                          15000.0     978904.5    652.6
                                                                   ========
System Benchmarks Index Score                                         942.5
Testing again showed even slightly better results:
  #    #  #    #  #  #    #          #####   ######  #    #   ####   #    #
   #    #  ##   #  #   #  #           #    #  #       ##   #  #    #  #    #
   #    #  # #  #  #    ##            #####   #####   # #  #  #       ######
   #    #  #  # #  #    ##            #    #  #       #  # #  #       #    #
   #    #  #   ##  #   #  #           #    #  #       #   ##  #    #  #    #
    ####   #    #  #  #    #          #####   ######  #    #   ####   #    #

   Version 5.1.3                      Based on the Byte Magazine Unix Benchmark

   Multi-CPU version                  Version 5 revisions by Ian Smith,
                                      Sunnyvale, CA, USA
   January 13, 2011                   johantheghost at yahoo period com


1 x Dhrystone 2 using register variables  1 2 3 4 5 6 7 8 9 10

1 x Double-Precision Whetstone  1 2 3 4 5 6 7 8 9 10

1 x Execl Throughput  1 2 3

1 x File Copy 1024 bufsize 2000 maxblocks  1 2 3

1 x File Copy 256 bufsize 500 maxblocks  1 2 3

1 x File Copy 4096 bufsize 8000 maxblocks  1 2 3

1 x Pipe Throughput  1 2 3 4 5 6 7 8 9 10

1 x Pipe-based Context Switching  1 2 3 4 5 6 7 8 9 10

1 x Process Creation  1 2 3

1 x System Call Overhead  1 2 3 4 5 6 7 8 9 10

1 x Shell Scripts (1 concurrent)  1 2 3

1 x Shell Scripts (8 concurrent)  1 2 3

2 x Dhrystone 2 using register variables  1 2 3 4 5 6 7 8 9 10

2 x Double-Precision Whetstone  1 2 3 4 5 6 7 8 9 10

2 x Execl Throughput  1 2 3

2 x File Copy 1024 bufsize 2000 maxblocks  1 2 3

2 x File Copy 256 bufsize 500 maxblocks  1 2 3

2 x File Copy 4096 bufsize 8000 maxblocks  1 2 3

2 x Pipe Throughput  1 2 3 4 5 6 7 8 9 10

2 x Pipe-based Context Switching  1 2 3 4 5 6 7 8 9 10

2 x Process Creation  1 2 3

2 x System Call Overhead  1 2 3 4 5 6 7 8 9 10

2 x Shell Scripts (1 concurrent)  1 2 3

2 x Shell Scripts (8 concurrent)  1 2 3

========================================================================
   BYTE UNIX Benchmarks (Version 5.1.3)

   System: xxxxx: GNU/Linux
   OS: GNU/Linux -- 2.6.32-274.3.1.el5.028stab094.3 -- #1 SMP Thu Sep 22 13:24:07 MSD 2011
   Machine: i686 (unknown)
   Language: en_US.utf8 (charmap="ANSI_X3.4-1968", collate="ANSI_X3.4-1968")
   CPU 0: Intel(R) Core(TM)2 Quad CPU Q9300 @ 2.50GHz (4987.5 bogomips)
          Hyper-Threading, x86-64, MMX, Physical Address Ext, SYSENTER/SYSEXIT, SYSCALL/SYSRET, Intel virtualization
   CPU 1: Intel(R) Core(TM)2 Quad CPU Q9300 @ 2.50GHz (4987.5 bogomips)
          Hyper-Threading, x86-64, MMX, Physical Address Ext, SYSENTER/SYSEXIT, SYSCALL/SYSRET, Intel virtualization
   01:17:27 up  2:04,  1 user,  load average: 0.00, 0.02, 0.69; runlevel 2

------------------------------------------------------------------------
Benchmark Run: Sun Oct 28 2012 01:17:27 - 01:45:46
2 CPUs in system; running 1 parallel copy of tests

Dhrystone 2 using register variables       10171392.2 lps   (10.0 s, 7 samples)
Double-Precision Whetstone                     2166.0 MWIPS (9.8 s, 7 samples)
Execl Throughput                               3410.4 lps   (29.9 s, 2 samples)
File Copy 1024 bufsize 2000 maxblocks        330921.3 KBps  (30.0 s, 2 samples)
File Copy 256 bufsize 500 maxblocks          104614.4 KBps  (30.0 s, 2 samples)
File Copy 4096 bufsize 8000 maxblocks        606851.3 KBps  (30.1 s, 2 samples)
Pipe Throughput                              699809.1 lps   (10.0 s, 7 samples)
Pipe-based Context Switching                 228356.8 lps   (10.0 s, 7 samples)
Process Creation                               9776.7 lps   (30.0 s, 2 samples)
Shell Scripts (1 concurrent)                   3852.3 lpm   (60.0 s, 2 samples)
Shell Scripts (8 concurrent)                    764.3 lpm   (60.0 s, 2 samples)
System Call Overhead                         622999.5 lps   (10.0 s, 7 samples)

System Benchmarks Index Values               BASELINE       RESULT    INDEX
Dhrystone 2 using register variables         116700.0   10171392.2    871.6
Double-Precision Whetstone                       55.0       2166.0    393.8
Execl Throughput                                 43.0       3410.4    793.1
File Copy 1024 bufsize 2000 maxblocks          3960.0     330921.3    835.7
File Copy 256 bufsize 500 maxblocks            1655.0     104614.4    632.1
File Copy 4096 bufsize 8000 maxblocks          5800.0     606851.3   1046.3
Pipe Throughput                               12440.0     699809.1    562.5
Pipe-based Context Switching                   4000.0     228356.8    570.9
Process Creation                                126.0       9776.7    775.9
Shell Scripts (1 concurrent)                     42.4       3852.3    908.6
Shell Scripts (8 concurrent)                      6.0        764.3   1273.9
System Call Overhead                          15000.0     622999.5    415.3
                                                                   ========
System Benchmarks Index Score                                         715.6

------------------------------------------------------------------------
Benchmark Run: Sun Oct 28 2012 01:45:46 - 02:14:17
2 CPUs in system; running 2 parallel copies of tests

Dhrystone 2 using register variables       21253800.0 lps   (10.0 s, 7 samples)
Double-Precision Whetstone                     4329.2 MWIPS (10.0 s, 7 samples)
Execl Throughput                               5009.9 lps   (29.8 s, 2 samples)
File Copy 1024 bufsize 2000 maxblocks        215174.6 KBps  (30.0 s, 2 samples)
File Copy 256 bufsize 500 maxblocks           69105.2 KBps  (30.0 s, 2 samples)
File Copy 4096 bufsize 8000 maxblocks        572029.4 KBps  (30.0 s, 2 samples)
Pipe Throughput                             1381243.7 lps   (10.0 s, 7 samples)
Pipe-based Context Switching                 430615.8 lps   (10.0 s, 7 samples)
Process Creation                              15201.7 lps   (30.0 s, 2 samples)
Shell Scripts (1 concurrent)                   5577.5 lpm   (60.0 s, 2 samples)
Shell Scripts (8 concurrent)                    817.3 lpm   (60.0 s, 2 samples)
System Call Overhead                        1005045.5 lps   (10.0 s, 7 samples)

System Benchmarks Index Values               BASELINE       RESULT    INDEX
Dhrystone 2 using register variables         116700.0   21253800.0   1821.2
Double-Precision Whetstone                       55.0       4329.2    787.1
Execl Throughput                                 43.0       5009.9   1165.1
File Copy 1024 bufsize 2000 maxblocks          3960.0     215174.6    543.4
File Copy 256 bufsize 500 maxblocks            1655.0      69105.2    417.6
File Copy 4096 bufsize 8000 maxblocks          5800.0     572029.4    986.3
Pipe Throughput                               12440.0    1381243.7   1110.3
Pipe-based Context Switching                   4000.0     430615.8   1076.5
Process Creation                                126.0      15201.7   1206.5
Shell Scripts (1 concurrent)                     42.4       5577.5   1315.5
Shell Scripts (8 concurrent)                      6.0        817.3   1362.2
System Call Overhead                          15000.0    1005045.5    670.0
                                                                   ========
System Benchmarks Index Score                                         964.4
Finally for the Geenbench tests, this VPS actually managed to score more than 3000 points:
System Information
  Platform:                  Linux x86 (32-bit)
  Compiler:                  GCC 4.1.2 20070925 (Red Hat 4.1.2-33)
  Operating System:          Linux 2.6.32-274.3.1.el5.028stab094.3 i686
  Model:                     Linux PC (Intel Core 2 Quad Q9300)
  Motherboard:               Unknown Motherboard
  Processor:                 Intel Core 2 Quad Q9300
  Processor ID:              GenuineIntel Family 6 Model 23 Stepping 7
  Logical Processors:        2
  Physical Processors:       1
  Processor Frequency:       2.49 GHz
  L1 Instruction Cache:      0.00 B
  L1 Data Cache:             0.00 B
  L2 Cache:                  3.00 MB
  L3 Cache:                  0.00 B
  Bus Frequency:             0.00 Hz
  Memory:                    7.75 GB
  Memory Type:               N/A
  SIMD:                      1
  BIOS:                      N/A
  Processor Model:           Intel Core 2 Quad Q9300
  Processor Cores:           2

Integer
  Blowfish
    single-threaded scalar    1786 |||||||
    multi-threaded scalar     3674 ||||||||||||||
  Text Compress
    single-threaded scalar    1999 |||||||
    multi-threaded scalar     3825 |||||||||||||||
  Text Decompress
    single-threaded scalar    1446 |||||
    multi-threaded scalar     2963 |||||||||||
  Image Compress
    single-threaded scalar    1376 |||||
    multi-threaded scalar     2657 ||||||||||
  Image Decompress
    single-threaded scalar    1195 ||||
    multi-threaded scalar     2225 ||||||||
  Lua
    single-threaded scalar    2650 ||||||||||
    multi-threaded scalar     6070 ||||||||||||||||||||||||

Floating Point
  Mandelbrot
    single-threaded scalar    1860 |||||||
    multi-threaded scalar     3507 ||||||||||||||
  Dot Product
    single-threaded scalar    3400 |||||||||||||
    multi-threaded scalar     5902 |||||||||||||||||||||||
    single-threaded vector    2559 ||||||||||
    multi-threaded vector     4666 ||||||||||||||||||
  LU Decomposition
    single-threaded scalar    1747 ||||||
    multi-threaded scalar     1778 |||||||
  Primality Test
    single-threaded scalar    2445 |||||||||
    multi-threaded scalar     4147 ||||||||||||||||
  Sharpen Image
    single-threaded scalar    4790 |||||||||||||||||||
    multi-threaded scalar     9249 ||||||||||||||||||||||||||||||||||||
  Blur Image
    single-threaded scalar    3536 ||||||||||||||
    multi-threaded scalar     6973 |||||||||||||||||||||||||||

Memory
  Read Sequential
    single-threaded scalar    3593 ||||||||||||||
  Write Sequential
    single-threaded scalar    3430 |||||||||||||
  Stdlib Allocate
    single-threaded scalar    1723 ||||||
  Stdlib Write
    single-threaded scalar    1561 ||||||
  Stdlib Copy
    single-threaded scalar    2938 |||||||||||

Stream
  Stream Copy
    single-threaded scalar    2163 ||||||||
    single-threaded vector    2339 |||||||||
  Stream Scale
    single-threaded scalar    2280 |||||||||
    single-threaded vector    2130 ||||||||
  Stream Add
    single-threaded scalar    2222 ||||||||
    single-threaded vector    2366 |||||||||
  Stream Triad
    single-threaded scalar    2462 |||||||||
    single-threaded vector    1839 |||||||

Integer Score:                2655 ||||||||||
Floating Point Score:         4039 ||||||||||||||||
Memory Score:                 2649 ||||||||||
Stream Score:                 2225 ||||||||

Overall Geekbench Score:      3095 ||||||||||||
Again, the second test showed somewhat better results:
System Information
  Platform:                  Linux x86 (32-bit)
  Compiler:                  GCC 4.1.2 20070925 (Red Hat 4.1.2-33)
  Operating System:          Linux 2.6.32-274.3.1.el5.028stab094.3 i686
  Model:                     Linux PC (Intel Core 2 Quad Q9300)
  Motherboard:               Unknown Motherboard
  Processor:                 Intel Core 2 Quad Q9300
  Processor ID:              GenuineIntel Family 6 Model 23 Stepping 7
  Logical Processors:        2
  Physical Processors:       1
  Processor Frequency:       2.49 GHz
  L1 Instruction Cache:      0.00 B
  L1 Data Cache:             0.00 B
  L2 Cache:                  3.00 MB
  L3 Cache:                  0.00 B
  Bus Frequency:             0.00 Hz
  Memory:                    7.75 GB
  Memory Type:               N/A
  SIMD:                      1
  BIOS:                      N/A
  Processor Model:           Intel Core 2 Quad Q9300
  Processor Cores:           2

Integer
  Blowfish
    single-threaded scalar    1428 |||||
    multi-threaded scalar     2971 |||||||||||
  Text Compress
    single-threaded scalar    1580 ||||||
    multi-threaded scalar     3776 |||||||||||||||
  Text Decompress
    single-threaded scalar    1800 |||||||
    multi-threaded scalar     3278 |||||||||||||
  Image Compress
    single-threaded scalar    1722 ||||||
    multi-threaded scalar     3275 |||||||||||||
  Image Decompress
    single-threaded scalar    1492 |||||
    multi-threaded scalar     2384 |||||||||
  Lua
    single-threaded scalar    3315 |||||||||||||
    multi-threaded scalar     6325 |||||||||||||||||||||||||

Floating Point
  Mandelbrot
    single-threaded scalar    1480 |||||
    multi-threaded scalar     2987 |||||||||||
  Dot Product
    single-threaded scalar    2704 ||||||||||
    multi-threaded scalar     5527 ||||||||||||||||||||||
    single-threaded vector    2544 ||||||||||
    multi-threaded vector     3837 |||||||||||||||
  LU Decomposition
    single-threaded scalar    2081 ||||||||
    multi-threaded scalar     2067 ||||||||
  Primality Test
    single-threaded scalar    2927 |||||||||||
    multi-threaded scalar     4497 |||||||||||||||||
  Sharpen Image
    single-threaded scalar    6034 ||||||||||||||||||||||||
    multi-threaded scalar    11740 ||||||||||||||||||||||||||||||||||||||||||||||
  Blur Image
    single-threaded scalar    4420 |||||||||||||||||
    multi-threaded scalar     8063 ||||||||||||||||||||||||||||||||

Memory
  Read Sequential
    single-threaded scalar    2400 |||||||||
  Write Sequential
    single-threaded scalar    2083 ||||||||
  Stdlib Allocate
    single-threaded scalar    2204 ||||||||
  Stdlib Write
    single-threaded scalar    1223 ||||
  Stdlib Copy
    single-threaded scalar    3412 |||||||||||||

Stream
  Stream Copy
    single-threaded scalar    2122 ||||||||
    single-threaded vector    2277 |||||||||
  Stream Scale
    single-threaded scalar    2272 |||||||||
    single-threaded vector    2168 ||||||||
  Stream Add
    single-threaded scalar    2248 ||||||||
    single-threaded vector    2407 |||||||||
  Stream Triad
    single-threaded scalar    2433 |||||||||
    single-threaded vector    1755 |||||||

Integer Score:                2778 |||||||||||
Floating Point Score:         4350 |||||||||||||||||
Memory Score:                 2264 |||||||||
Stream Score:                 2210 ||||||||

Overall Geekbench Score:      3168 ||||||||||||
Customer Service and Support
Despite having quite a few customers, YDGH has provided pretty good customer support and services. For instance, at the time when I signed up, the promo code was not working initially and the Chicago location was out of stock. I put in a ticket on 18:23 and received the response at 19:31 for the promo code issue. I ended up signed up for another location initially and the ticket was left in progress. Half a month later, when I almost forgot about the ticket, Corey actually contacted me to inform me that they have some stock in Chicago and asked me if I want to move over or not, which they happily did that for me for free and the ticket confirming the details of the move were answered in 2 or 3 minutes. When I switched to my own Google Apps rather than using GMail for my personal email, the invoice notification emails went to my spam box for some reason and I missed a payment for almost two weeks. Rather than simply shutting down the VPS, Corey has once again contacted me via ticket asking me if I would like to keep the VPS, and my reply to that ticket at 22:54 was answered two minutes later.
While many VPS service providers offer quick response, they are probably one of the few low-end providers that offer “active” response and rather than waiting for issues to happen and clients to complain, which would probably do a great amount of good deal to their business reputation.
Conclusion
The VPS from YDGH itself may not be that impressive, the disk I/O is slow and even RAM was probably oversold, network speed is great and the benchmarking is OK, but the fact that it is housed in Continuum DC, which, until recently, had only 2 upstream providers, worried me somewhat. However, their “active” style of support, despite being an unmanaged service, is somewhat comforting and it may be suitable for people who are on a budget and yet don’t want to worry about the VPS being cut off because of the invoice did not arrive to the inbox.
Chicago/La are likely to have lower performance than dallas. Dallas has our newest and best hardware. Our newest server in Dallas is FAR superior to past servers. Eventually we will upgrade all nodes including Chicago and Los Angeles to same or better hardware.
@YDGH-Wayne: Thanks a lot for your your comments and clarifications, unfortunately I only get to test the Chicago server. Hopefully the Chicago server will be upgraded to RAID 10 eventually and I’d be more than happy to give you some new feedbacks the next time I review YDGH!
Hi 96mb! We thank you for this review but there are a few things I would like to point out…
Our nodes in chicago and la are only a raid1 machine. We haven’t been able to upgrade that yet to our latest raid10 build which gives IO speeds upwards of 300MB/s. We realize that this raid1 build has it’s downfalls and it obviously shows in your tests.
Also – please contact me regarding some linking opportunities from your site.