
96MB Extreme 4 Hours VPS Review–Linode
It is a Friday evening and while I was browsing on the LowEndTalk and came across of this post. Instantly I thought it would be an interesting challenge for me to write an review given only a 4 hour window for me to try out the VPS (and another 2 hours to do the writing on a sunny Sunday morning). Granted there will be many shortcomings for such a review, since I might just be lucky to hit a “good” 4-hours window on the node, however I thought it would at least offer the 96MB.com readers some insight of Linode, who’s price is way beyond the standard LEB pricing, without sacrificing my own wallet so much.
So without further delay (since I only give myself two hours of writing time), let’s get started.
Basic Information and Set Up
According to this blog entry on Linode, the process for a 4 hour trial node is fairly simple. Basically all you need is a verified email address (and obviously a username and password), and you can fill up a form on their home page:

once you have the email address verified, you will be able to start a trial:

Basically you can create a VPS in any of their datacenters, and according to their payment page, their Linode 512MB plan has the following resources, note that on the top of the page, there is a small timer there informing you the total amount of time left in the trial. I believe the timer starts the moment you clicked on the “Continue with Free Trial” button, not when the VPS is actually boot up.
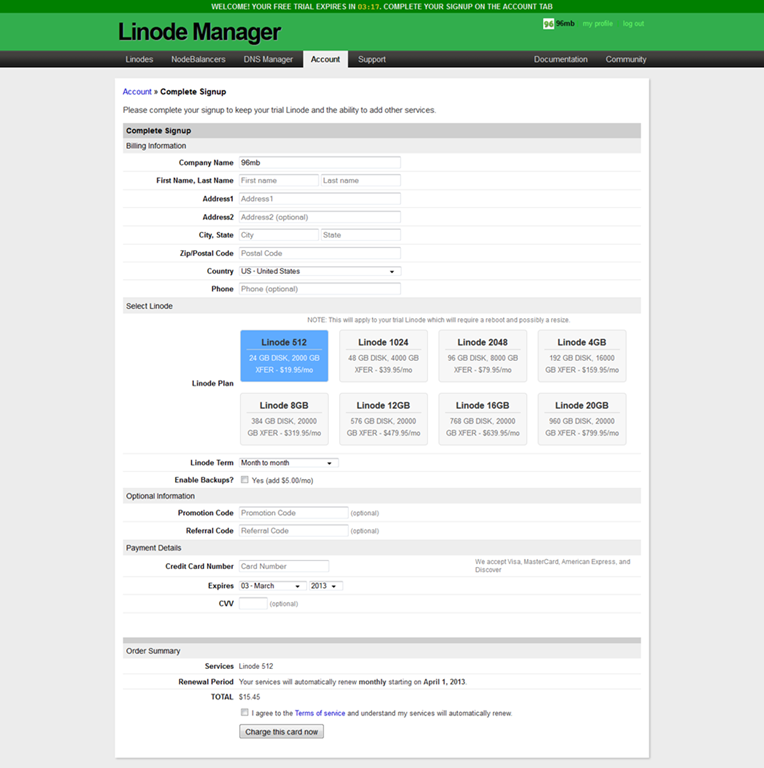
Also, the other interesting bit to note is that if once you have a trial VPS, if you would like to pay for it, you can upgrade to a full VPS without losing any of your configurations/data, however a reboot will be required. Linode starts the billing on the first day of the month and the first bill would be pro-rated to the first of the next month as you can see in the payment page. Finally, Linode only accept credit cards.
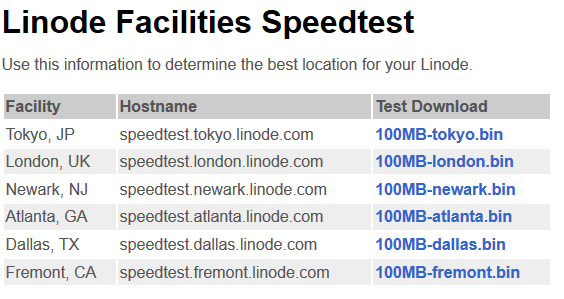
I thought testing the VPS in their Japan datacentre would be a good idea, simply because VPS in Asia are rare to see due to the cost and if I remembered correctly, this is probably one of the first, if not the first review that I have done for a VPS located in Asia. They have several other datacentres that you can choose from and the respective speedtest is on their website:
Once the VPS is created, you have to manually boot it up, and you can see the VPS showing on the main dashboard, with the amount of bandwidth available:
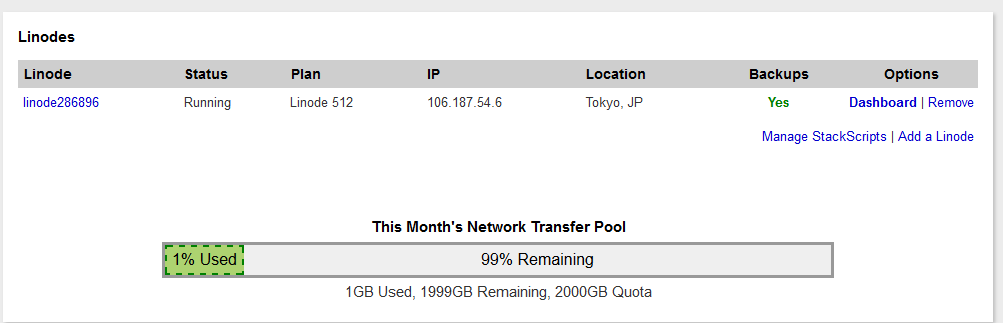
I believe for Linode, the bandwidth is pooled, which means if you have two Linode 512 and has a total of 4TB of bandwidth allowance, you can use 3TB on one server and 1TB on the other without getting charged anything extra, which I think would be neat. Obviously the graph seems to be a bit out of proportion for 1% of the graph (and it is actually more like 0.05% based on 1GB out of 2TB).
I think one of the biggest reasons why people are buying Linode is because of their control panel, which is really a piece of art. Once enters the Dashboard, the details of the VPS can be seen, as well as a log of actions performed on the VPS at a node level:
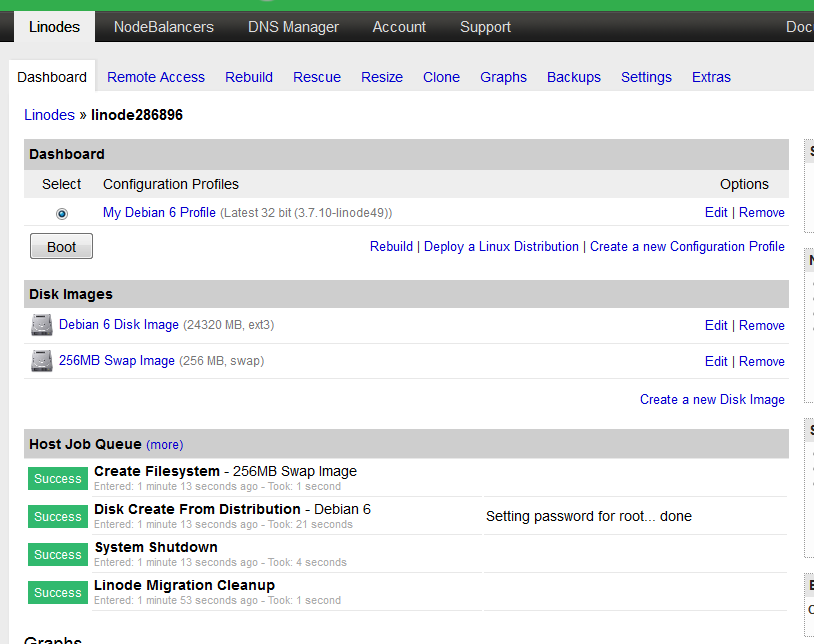
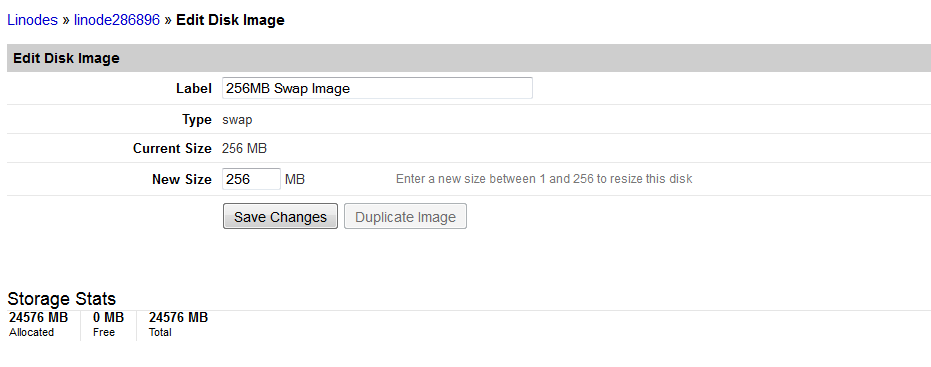
You can edit several component of the VPS configuration including the main disk. Note that the swap is included in your disk quota and you can create a swap image of up to 512MB.
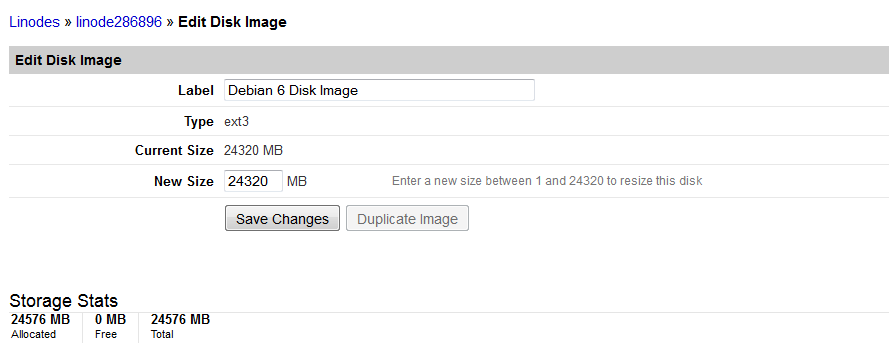
By default, I chose 256MB of swap space during creation, however, if in this case I need more swap space for whatever reason, I would need to shrink my main disk first to make room for the swap space. I can also shrink my swap space and make room for the main storage disk as well. Obviously it is something easy to do at in command line, but it is pretty cool that users would be able to do it on the control panel:
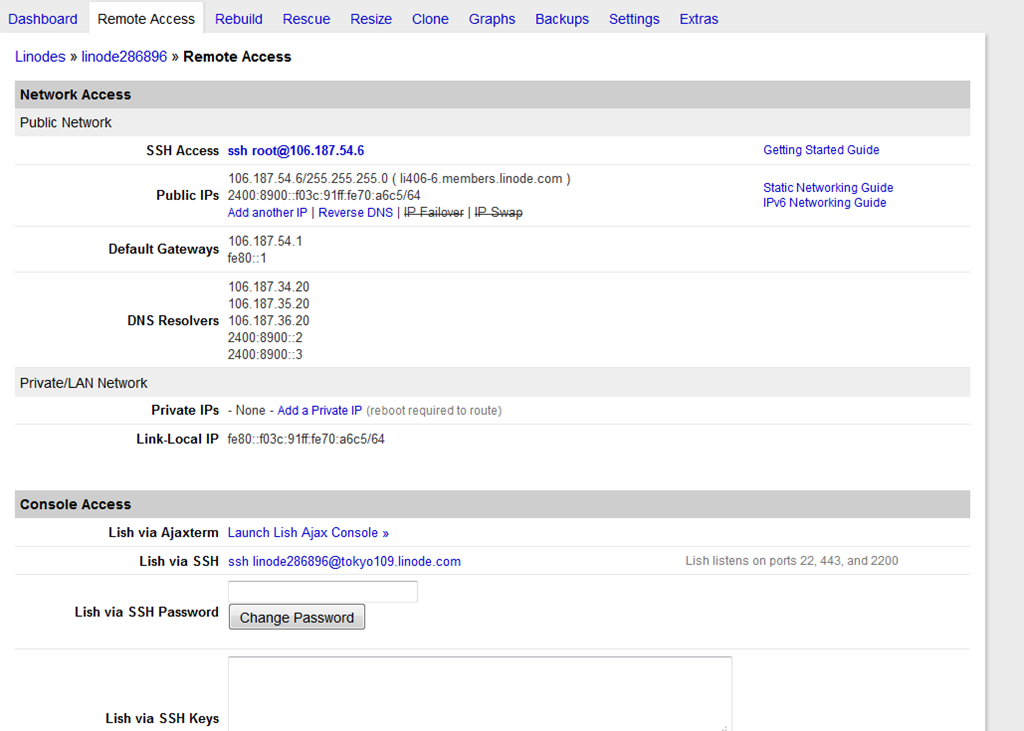
The Remote Access tab shows you the IP addresses as well as any other associated information that you will need to access your VPS remotely. Note that there is only 1 IPv4 and a /64 IPv6 address given by default, however you can buy more IPv4 addresses and for IPv6, I really doubt if you’ll need that many (to get an idea of how many IPv6 addresses there are in a /64 block, feel free to read this short article here):
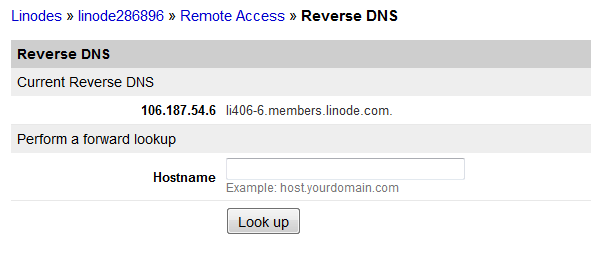
Instant rDNS can be assigned as well, by clicking on the Reverse DNS button. Note that if you have multiple IP addresses, you can use their IP failover and IP swap functionalities to give you a kind of HA set up.
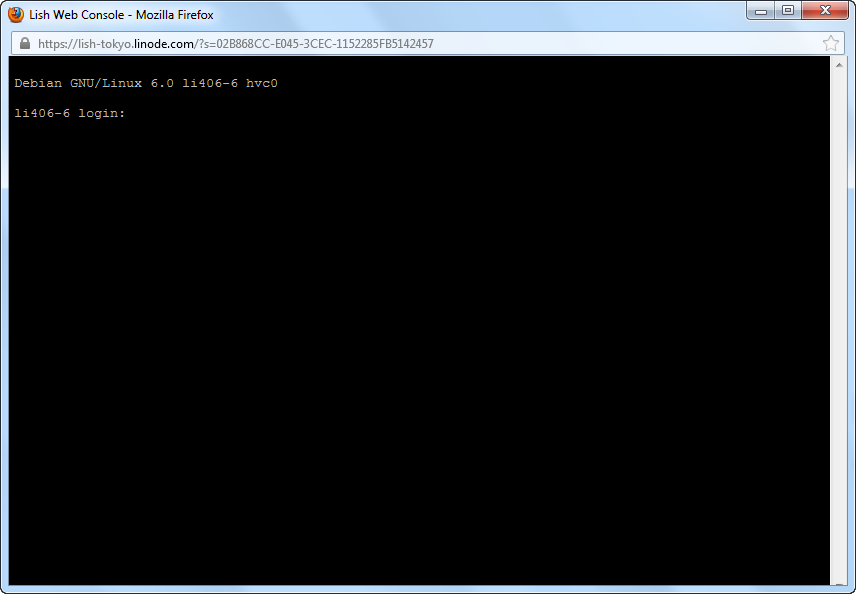
The emergency access console Linode has is called Lish, which is an Ajax-based terminal that you can use:
The next tab is Rebuild, which as the name suggests, you can wipe out and reinstall the VPS:
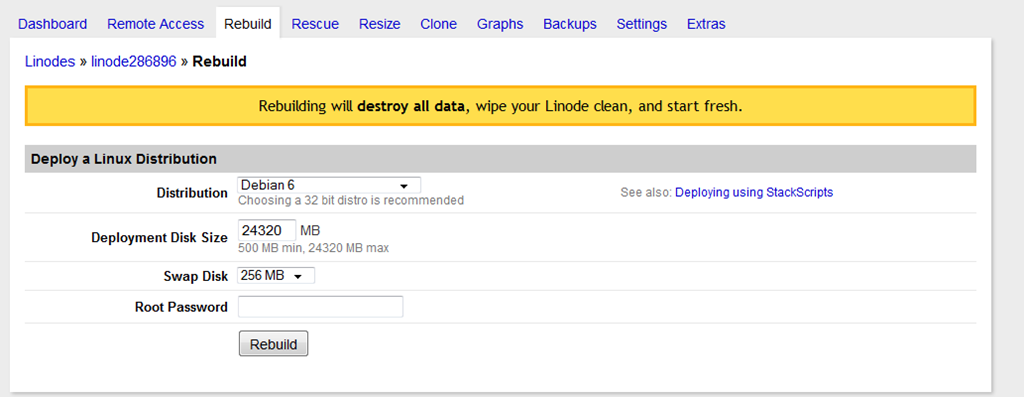
Note that you have quite a few options to choose from here when it comes to selection of OS:
Arch Linux 2012.10
Arch Linux 2012.10 64bit
CentOS 6.2
CentOS 6.2 64bit
Debian 6
Debian 6 64bit
Fedora 17
Fedora 17 64bit
Gentoo
Gentoo 64bit
openSUSE 12.1
openSUSE 12.1 64bit
Slackware 13.37
Slackware 13.37 64bit
Ubuntu 10.04 LTS
Ubuntu 10.04 LTS 64bit
Ubuntu 11.10
Ubuntu 11.10 64bit
Ubuntu 12.04 LTS
Ubuntu 12.04 LTS 64bit
Ubuntu 12.10
Ubuntu 12.10 64bit
Arch Linux 2012.07
Arch Linux 2012.07 64bit
CentOS 5.6
CentOS 5.6 64bit
Debian 5.0
Debian 5.0 64bit
Fedora 16
Fedora 16 64bit
openSUSE 11.4
openSUSE 11.4 64bit
Slackware 13.1
Slackware 13.1 64bit
Ubuntu 11.04
Ubuntu 11.04 64bit
Ubuntu 8.04 LTS
Ubuntu 8.04 LTS 64bit
As you can see, Linode not only has the newest OS for major Linux distributions but also the older version for those who can’t use the newest version.
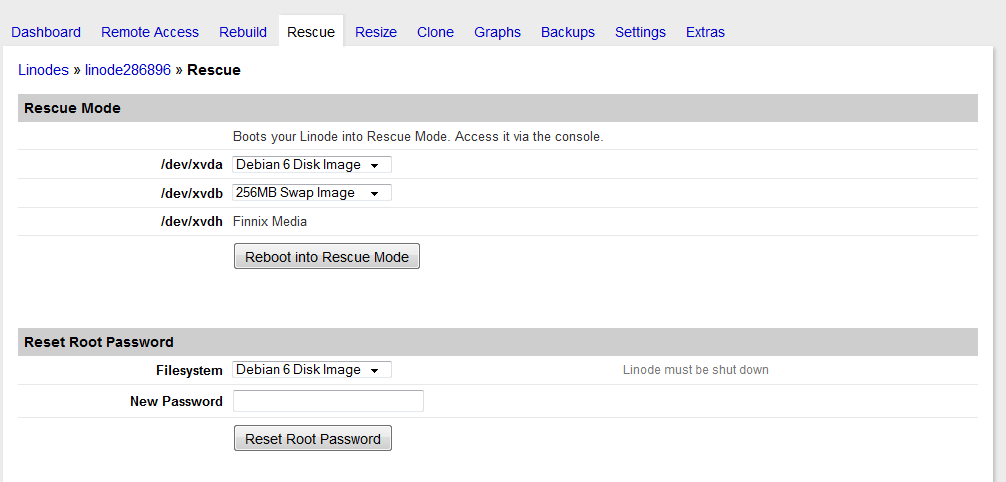
Other than rebuild, you can also boot into the rescue mode to save your files. You can also directly reset your root password using the control panel:
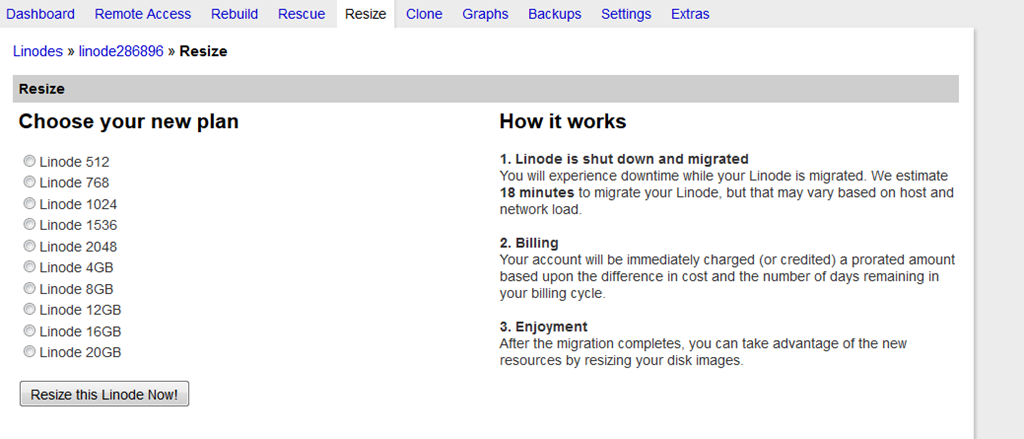
Since I was on a trial mode, in order to resize, I have to purchase an actual Linode (which I did not do), however as you can see, the process seems to be fairly simple and the Linode will be migrated automatically. They even have an estimate on how long the migration process will take.
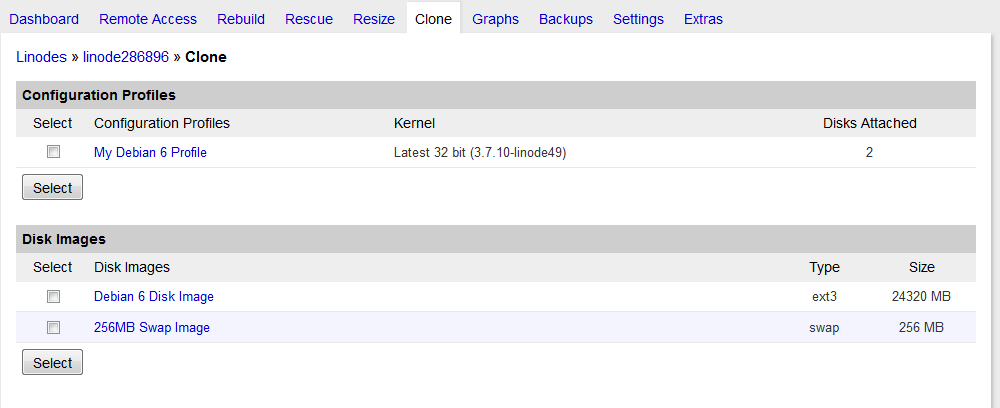
If you have multiple Linodes, you can also clone the Linode, which would be helpful if you have, say, an HA set up with multiple VPS for the cluster. You can also clone one of the disks if you prefer.
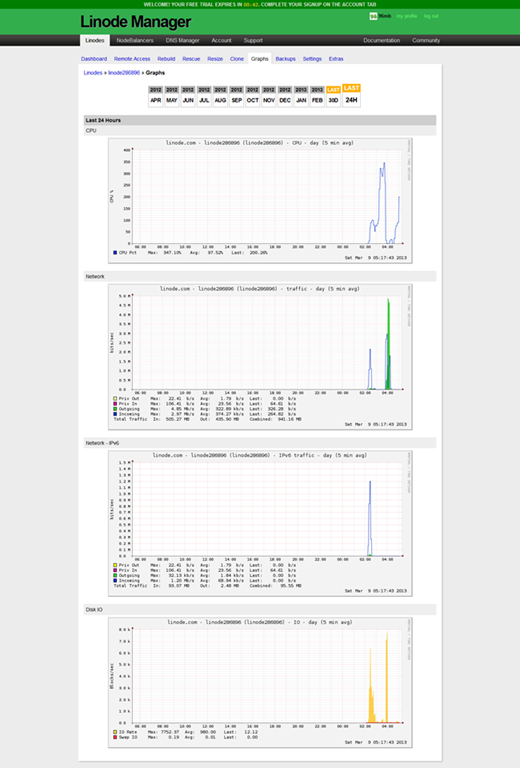
The graphs initially did not show anything for me and I thought it was an error on their end:

Turned out they simply didn’t have sufficient data to plot the graph as the default graph shown in daily for the past 30 days. Once I click on the Last 24 Hours, the graph will start to display, as you can see the CPU, network and disk I/O information are all displayed (yes, I know I have been using quite a bit of CPU and disk I/O power, which I have been getting emails during my short trial with them, but those are necessary to perform the tests):
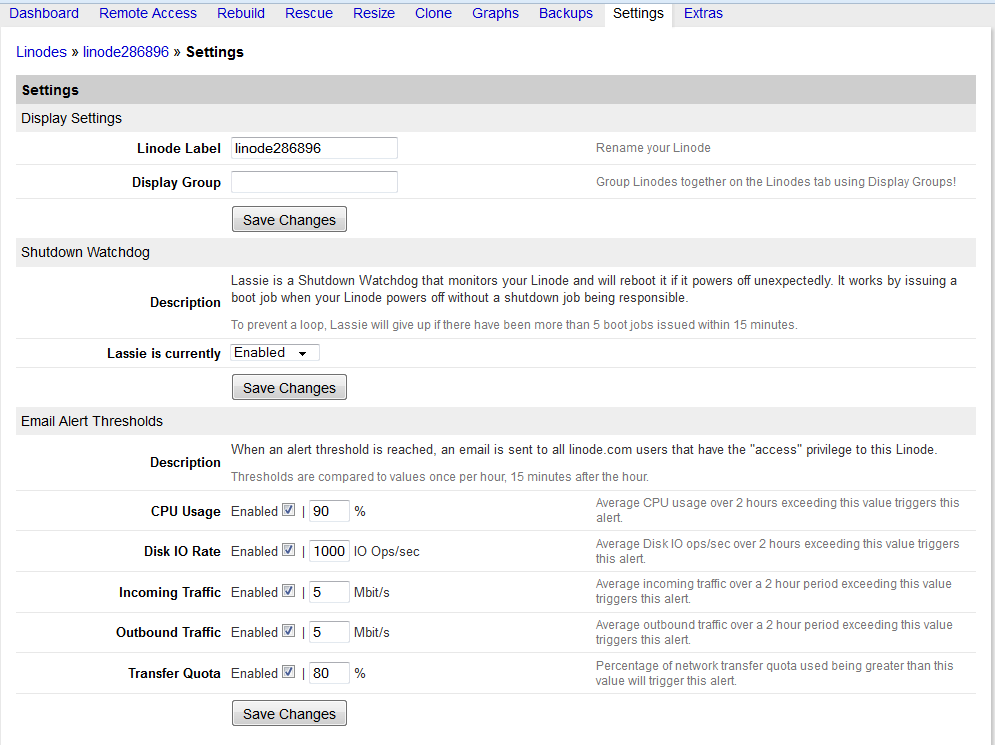
Settings tab will provide you the ability to change the Linode label as well as enable or disable the shutdown watchdog (I guess a sort of “autoboot” feature), but mostly importantly, it will set up the threshold for you to get alert emails so that you don’t have to keep an eye on the VPS 24×7 to know if anything bad happens:
Here is one of the automated email that I have received from them after running the DD tests:
![SNAGHTML543e1d1[5]](https://www.96mb.com/wp-content/uploads/2013/03/SNAGHTML543e1d15.png "SNAGHTML543e1d1[5]")
Finally, on the extra tab, you can purchase additional resources on the extra tab:
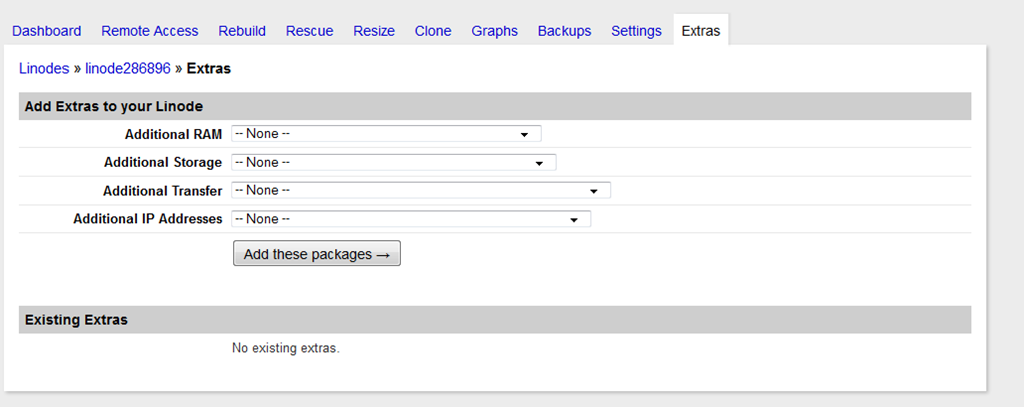
The prices, however, are not cheap (just like the Linode itself):
For the RAM, you are looking at 5 USD per month for each 90MB block, you can also pay yearly or two years at once:
Additional 90 MB RAM - (add $5.00/mo)
Additional 90 MB RAM - (add $60.00/year)
Additional 180 MB RAM - (add $10.00/mo)
Additional 180 MB RAM - (add $120.00/year)
Additional 270 MB RAM - (add $15.00/mo)
Additional 270 MB RAM - (add $180.00/year)
Additional 360 MB RAM - (add $20.00/mo)
Additional 360 MB RAM - (add $240.00/year)
Additional 360 MB RAM - (add $480.00/2 years)
And for disk space, each 2GB block costs an additional 2 USD per month, and you can prepay for a year’s worth of disk space as well:
Additional 2 GB Disk Space - (add $2.00/mo)
Additional 2 GB Disk Space - (add $24.00/year)
Additional 4 GB Disk Space - (add $4.00/mo)
Additional 4 GB Disk Space - (add $48.00/year)
Additional 6 GB Disk Space - (add $6.00/mo)
Additional 6 GB Disk Space - (add $72.00/year)
Additional 8 GB Disk Space - (add $8.00/mo)
Additional 8 GB Disk Space - (add $96.00/year)
Additional 10 GB Disk Space - (add $10.00/mo)
Additional 10 GB Disk Space - (add $120.00/year)
Additional 12 GB Disk Space - (add $12.00/mo)
Additional 12 GB Disk Space - (add $144.00/year)
Bandwidth upgrade cost 10 cents per GB per month, which is why quite a few Linode users were happy when Linode announced that they will upgrade the bandwidth to the existing clients for free, by 10 time of their original bandwidth:
Additional 100GB/month Transfer - (add $10.00/mo)
Additional 100GB/month Transfer - (add $120.00/year)
Additional 200GB/month Transfer - (add $20.00/mo)
Additional 200GB/month Transfer - (add $240.00/year)
Additional 400GB/month Transfer - (add $40.00/mo)
Additional 400GB/month Transfer - (add $480.00/year)
Additional 600GB/month Transfer - (add $60.00/mo)
Additional 600GB/month Transfer - (add $720.00/year)
Additional 800GB/month Transfer - (add $80.00/mo)
Additional 800GB/month Transfer - (add $960.00/year)
Additional 1000GB/month Transfer - (add $100.00/mo)
Additional 1000GB/month Transfer - (add $1,200.00/year)
Additional 2000GB/month Transfer - (add $200.00/mo)
Additional 2000GB/month Transfer - (add $2,400.00/year)
Additional 5000GB/month Transfer - (add $500.00/mo)
Additional 5000GB/month Transfer - (add $6,000.00/year)
Additional 10000GB/month Transfer - (add $1,000.00/mo)
Additional 10000GB/month Transfer - (add $12,000.00/year)
The only probably relatively reasonably priced (in low end VPS standard) add-on is the IP, which is 1 USD per month per IP:
Additional 1 IP Address - (add $1.00/mo)
Additional 1 IP Address (annual) - (add $12.00/year)
Additional 1 IP Address (biennial) - (add $24.00/2 years)
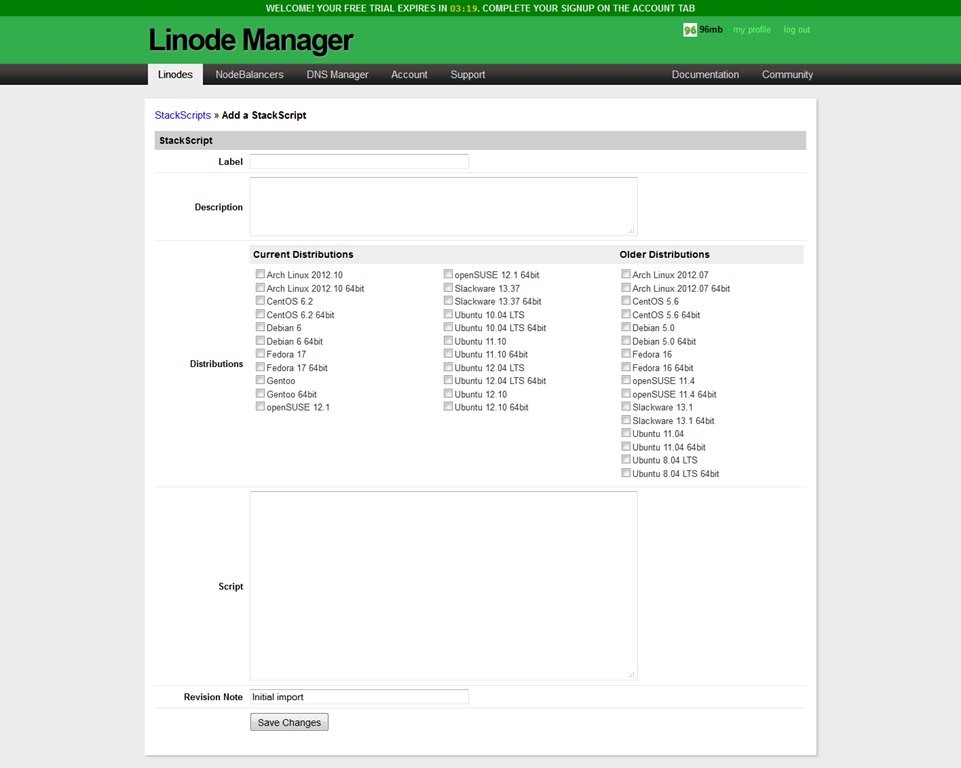
Other items on the main dashboard includes the ability to add Stackscripts to the VPS, which is a set of script that you could automatically add to the VPS during creation, which could be anything like changing the SSH port or allow key-only access to deploying a full software stack, which would be really useful if you need to deploy several machines or you would like the save the hassle of deploying the same software stack after you reimaged the VPS. In fact, Linode even has several stack scripts that are already written for you here:
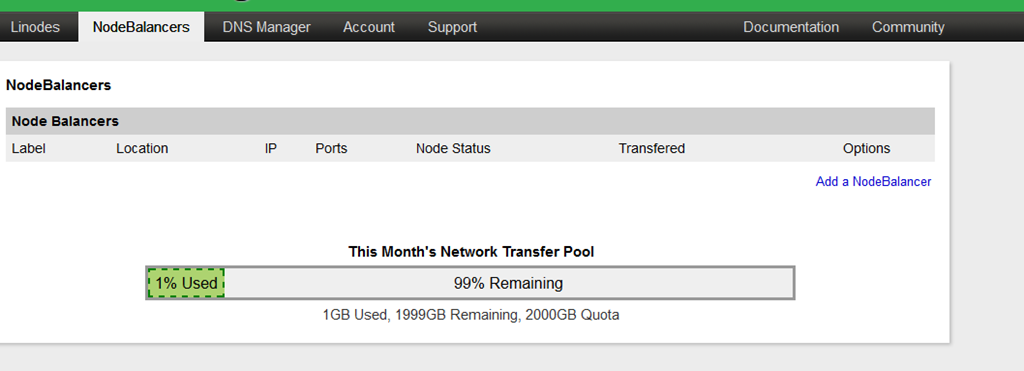
You can also add so-called NodeBlanacers, which would cost extra and I am not sure how is that different from adding another Linode:
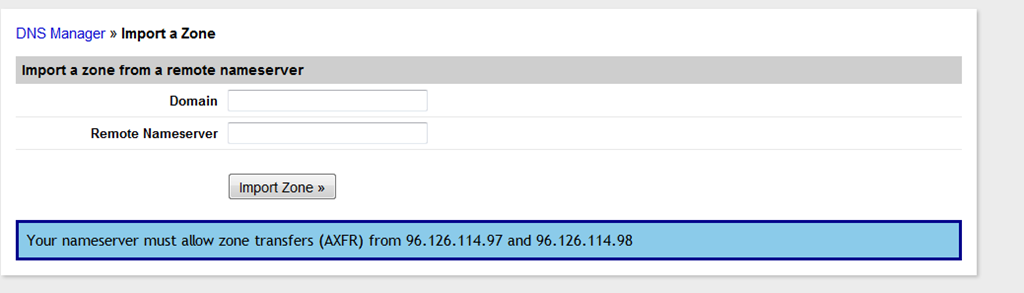
Linode also includes a DNS manager which people could make use of, which you can either import an existing zone for an active domain directly or create a new zone, the import zone interface is pretty intuitive and straight-forward to use:
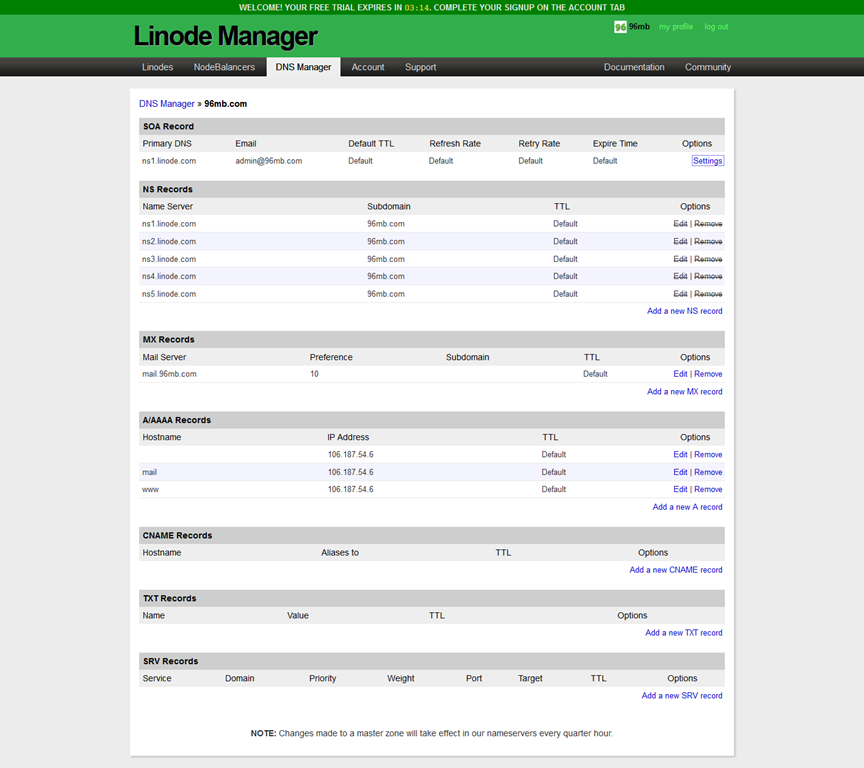
And to add a new zone, the task is fairly easy as well. In fact, the DNS manager even has the ability to set up some of the basic records for you based on the IP address of the VPS you have with Linode:

Here is a test set up I did and as you can see, some of the default records are set up once I click the button:
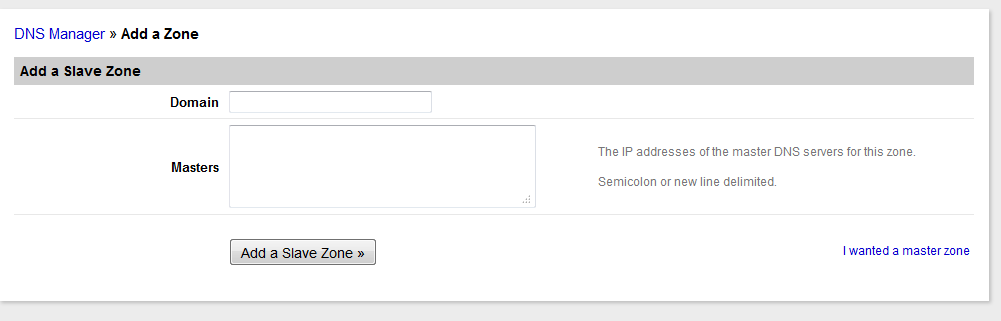
You can also create a slave zone, which I think would be great as a backup DNS if you prefer to run your own DNS server (or if you worried your primary DNS provider might fail):
The Account tab is just showing the sign up form, which we will skip here, and the last tab in the control panel is support, which gives you an option to open up a support ticket when needed, although they have already had a really a really good support system (which includes the FAQ, Library, Forum, and IRC), which you should be able to find a lot of answers by yourself:

P.S.: I just noticed I have already used more than 2 hours by the time I got here, but I guess in the interests of the 96MB readers, I will just keep going. Afterall, having a complete and detailed review is definitely a lot more important to me than the little 2 hours’ challenge.
Test of the VPS
As mentioned above, the VPS that I have signed up for testing is a 512MB RAM Linode with 2TB of bandwidth and is located in their Tokyo, JP datacentre. I have installed Debian 6 32 bit OS template for testing. The VPS, as with all other VPS from Linode, uses Xen virtualization.
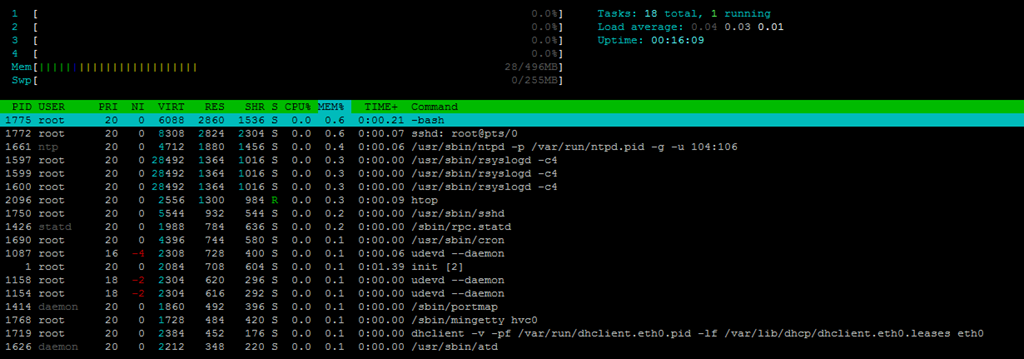
When the VPS was first reimaged, 25MB of RAM was used, which is a little higher than usual:
free -m
             total       used       free     shared    buffers     cached
Mem:           496         46        449          0          2         18
-/+ buffers/cache:         25        470
Swap:          255          0        255
Top showing the processes running:
top - 21:18:10 up 14 min,  1 user,  load average: 0.00, 0.01, 0.01
Tasks:  79 total,   1 running,  78 sleeping,   0 stopped,   0 zombie
Cpu(s):  0.0%us,  0.1%sy,  0.0%ni, 99.9%id,  0.0%wa,  0.0%hi,  0.0%si,  0.0%st
Mem:    508100k total,    48048k used,   460052k free,     2496k buffers
Swap:   262140k total,        0k used,   262140k free,    18968k cached

  PID USER      PR  NI  VIRT  RES  SHR S %CPU %MEM    TIME+  COMMAND
 1775 root      20   0  6088 2860 1536 S    0  0.6   0:00.20 bash
 1772 root      20   0  8308 2824 2304 S    0  0.6   0:00.05 sshd
 1661 ntp       20   0  4712 1880 1456 S    0  0.4   0:00.05 ntpd
 1597 root      20   0 28492 1364 1016 S    0  0.3   0:00.00 rsyslogd
 1818 root      20   0  2488 1064  816 R    0  0.2   0:00.00 top
 1750 root      20   0  5544  932  544 S    0  0.2   0:00.00 sshd
 1426 statd     20   0  1988  784  636 S    0  0.2   0:00.00 rpc.statd
 1690 root      20   0  4396  744  580 S    0  0.1   0:00.00 cron
 1087 root      16  -4  2308  728  400 S    0  0.1   0:00.06 udevd
    1 root      20   0  2084  708  604 S    0  0.1   0:01.39 init
 1158 root      18  -2  2304  620  296 S    0  0.1   0:00.00 udevd
 1154 root      18  -2  2304  616  292 S    0  0.1   0:00.00 udevd
 1414 daemon    20   0  1860  492  396 S    0  0.1   0:00.00 portmap
 1768 root      20   0  1728  484  420 S    0  0.1   0:00.00 mingetty
 1719 root      20   0  2384  452  176 S    0  0.1   0:00.00 dhclient
 1626 daemon    20   0  2212  348  220 S    0  0.1   0:00.00 atd
    2 root      20   0     0    0    0 S    0  0.0   0:00.00 kthreadd
    3 root      20   0     0    0    0 S    0  0.0   0:00.00 ksoftirqd/0
    4 root      20   0     0    0    0 S    0  0.0   0:00.00 kworker/0:0
    5 root       0 -20     0    0    0 S    0  0.0   0:00.00 kworker/0:0H
    6 root      20   0     0    0    0 S    0  0.0   0:00.02 kworker/u:0
    7 root       0 -20     0    0    0 S    0  0.0   0:00.00 kworker/u:0H
    8 root      RT   0     0    0    0 S    0  0.0   0:00.00 migration/0
    9 root      20   0     0    0    0 S    0  0.0   0:00.00 rcu_bh
   10 root      20   0     0    0    0 S    0  0.0   0:00.01 rcu_sched
   11 root      20   0     0    0    0 S    0  0.0   0:00.00 ksoftirqd/1
And htop output:
More than 400MB of hard drive space was used, which is quite standard:
df -h
Filesystem            Size  Used Avail Use% Mounted on
/dev/xvda              24G  439M   22G   2% /
tmpfs                 249M     0  249M   0% /lib/init/rw
udev                   10M  112K  9.9M   2% /dev
tmpfs                 249M     0  249M   0% /dev/shm
And the iNodes are obviously set according to the size of the hard drive:
df -i
Filesystem            Inodes   IUsed   IFree IUse% Mounted on
/dev/xvda            2511040   22485 2488555    1% /
tmpfs                  63512       5   63507    1% /lib/init/rw
udev                   63460    2090   61370    4% /dev
tmpfs                  63512       1   63511    1% /dev/shm
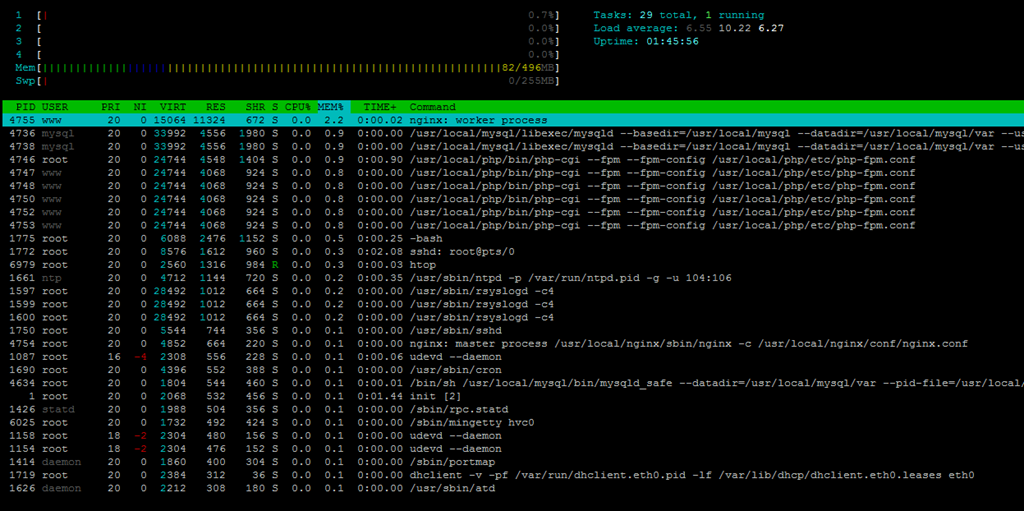
When the full LNMP stack was loaded, more than 80MB of RAM was used, which is quite high:
 free -m
             total       used       free     shared    buffers     cached
Mem:           496        475         20          0         33        358
-/+ buffers/cache:         82        413
Swap:          255          0        255
Top showing the full LNMP stack running:
top - 11:49:33 up  1:45,  1 user,  load average: 9.15, 10.93, 6.41
Tasks:  91 total,   1 running,  90 sleeping,   0 stopped,   0 zombie
Cpu(s):  0.0%us,  0.0%sy,  0.0%ni,100.0%id,  0.0%wa,  0.0%hi,  0.0%si,  0.0%st
Mem:    508100k total,   486488k used,    21612k free,    34732k buffers
Swap:   262140k total,       56k used,   262084k free,   367616k cached

  PID USER      PR  NI  VIRT  RES  SHR S %CPU %MEM    TIME+  COMMAND
 4755 www       20   0 15064  11m  672 S    0  2.2   0:00.02 nginx
 4736 mysql     20   0 33992 4556 1980 S    0  0.9   0:00.00 mysqld
 4746 root      20   0 24744 4548 1404 S    0  0.9   0:00.90 php-cgi
 4747 www       20   0 24744 4068  924 S    0  0.8   0:00.00 php-cgi
 4748 www       20   0 24744 4068  924 S    0  0.8   0:00.00 php-cgi
 4750 www       20   0 24744 4068  924 S    0  0.8   0:00.00 php-cgi
 4752 www       20   0 24744 4068  924 S    0  0.8   0:00.00 php-cgi
 4753 www       20   0 24744 4068  924 S    0  0.8   0:00.00 php-cgi
 1775 root      20   0  6088 2476 1152 S    0  0.5   0:00.25 bash
 1772 root      20   0  8576 1612  960 S    0  0.3   0:02.09 sshd
 1661 ntp       20   0  4712 1144  720 S    0  0.2   0:00.34 ntpd
 6978 root      20   0  2500 1072  816 R    0  0.2   0:00.00 top
 1597 root      20   0 28492 1012  664 S    0  0.2   0:00.00 rsyslogd
 1750 root      20   0  5544  744  356 S    0  0.1   0:00.00 sshd
 4754 root      20   0  4852  664  220 S    0  0.1   0:00.00 nginx
 1087 root      16  -4  2308  556  228 S    0  0.1   0:00.06 udevd
 1690 root      20   0  4396  552  388 S    0  0.1   0:00.00 cron
 4634 root      20   0  1804  544  460 S    0  0.1   0:00.01 mysqld_safe
    1 root      20   0  2068  532  456 S    0  0.1   0:01.45 init
 1426 statd     20   0  1988  504  356 S    0  0.1   0:00.00 rpc.statd
 6025 root      20   0  1732  492  424 S    0  0.1   0:00.00 mingetty
 1158 root      18  -2  2304  480  156 S    0  0.1   0:00.00 udevd
 1154 root      18  -2  2304  476  152 S    0  0.1   0:00.00 udevd
 1414 daemon    20   0  1860  400  304 S    0  0.1   0:00.00 portmap
 1719 root      20   0  2384  312   36 S    0  0.1   0:00.00 dhclient
 1626 daemon    20   0  2212  308  180 S    0  0.1   0:00.00 atd
    2 root      20   0     0    0    0 S    0  0.0   0:00.00 kthreadd
    3 root      20   0     0    0    0 S    0  0.0   0:00.18 ksoftirqd/0
    4 root      20   0     0    0    0 S    0  0.0   0:00.00 kworker/0:0
    5 root       0 -20     0    0    0 S    0  0.0   0:00.00 kworker/0:0H
And again, htop output:
About 1.7GB of hard drive space was used after the installation, which is quite standard:
 df -h
Filesystem            Size  Used Avail Use% Mounted on
/dev/xvda              24G  1.7G   21G   8% /
tmpfs                 249M     0  249M   0% /lib/init/rw
udev                   10M  112K  9.9M   2% /dev
tmpfs                 249M     0  249M   0% /dev/shm
As I was supposed to get the test done within 4 hours, I almost did not give this poor little machine a single second of break, and therefore the uptime might not be that great considering I have just run a Unixbench few minutes before:
 uptime
 11:51:41 up  1:47,  1 user,  load average: 1.07, 7.09, 5.57
However, a little bit more of waiting and the results is a lot better:
uptime
 12:10:22 up  2:06,  1 user,  load average: 0.00, 0.17, 1.68
From vmstat, you can see at least there is no iowait, which is great:
vmstat
procs -----------memory---------- ---swap-- -----io---- -system-- ----cpu----
 r  b   swpd   free   buff  cache   si   so    bi    bo   in   cs us sy id wa
 0  0     56  21736  34756 367720    0    0    13   107 1223  655 14 19 66  0
Running vmstat again when I ran uptime command for the second time shows better results in CPU usage, but IOWait remains to be 0, which is good:
vmstat
procs -----------memory---------- ---swap-- -----io---- -system-- ----cpu----
 r  b   swpd   free   buff  cache   si   so    bi    bo   in   cs us sy id wa
 0  0     56   7236  20740 422268    0    0    12   163 1045  559 12 16 71  0
Meminfo shows there are four CPU cores assigned to the VPS, and none of them are throttled:
 cat /proc/cpuinfo
processor       : 0
vendor_id       : GenuineIntel
cpu family      : 6
model           : 26
model name      : Intel(R) Xeon(R) CPU           L5520  @ 2.27GHz
stepping        : 5
microcode       : 0x16
cpu MHz         : 2266.842
cache size      : 8192 KB
physical id     : 0
siblings        : 4
core id         : 0
cpu cores       : 1
apicid          : 0
initial apicid  : 20
fdiv_bug        : no
hlt_bug         : no
f00f_bug        : no
coma_bug        : no
fpu             : yes
fpu_exception   : yes
cpuid level     : 11
wp              : yes
flags           : fpu de tsc msr pae cx8 cmov pat clflush mmx fxsr sse sse2 ss ht nx constant_tsc nonstop_tsc pni ssse3 sse4_1 sse4_2 popcnt hypervisor ida dtherm
bogomips        : 4533.68
clflush size    : 64
cache_alignment : 64
address sizes   : 40 bits physical, 48 bits virtual
power management:

processor       : 1
vendor_id       : GenuineIntel
cpu family      : 6
model           : 26
model name      : Intel(R) Xeon(R) CPU           L5520  @ 2.27GHz
stepping        : 5
microcode       : 0x16
cpu MHz         : 2266.842
cache size      : 8192 KB
physical id     : 0
siblings        : 4
core id         : 0
cpu cores       : 1
apicid          : 0
initial apicid  : 20
fdiv_bug        : no
hlt_bug         : no
f00f_bug        : no
coma_bug        : no
fpu             : yes
fpu_exception   : yes
cpuid level     : 11
wp              : yes
flags           : fpu de tsc msr pae cx8 cmov pat clflush mmx fxsr sse sse2 ss ht nx constant_tsc nonstop_tsc pni ssse3 sse4_1 sse4_2 popcnt hypervisor ida dtherm
bogomips        : 4533.68
clflush size    : 64
cache_alignment : 64
address sizes   : 40 bits physical, 48 bits virtual
power management:

processor       : 2
vendor_id       : GenuineIntel
cpu family      : 6
model           : 26
model name      : Intel(R) Xeon(R) CPU           L5520  @ 2.27GHz
stepping        : 5
microcode       : 0x16
cpu MHz         : 2266.842
cache size      : 8192 KB
physical id     : 0
siblings        : 4
core id         : 0
cpu cores       : 1
apicid          : 0
initial apicid  : 20
fdiv_bug        : no
hlt_bug         : no
f00f_bug        : no
coma_bug        : no
fpu             : yes
fpu_exception   : yes
cpuid level     : 11
wp              : yes
flags           : fpu de tsc msr pae cx8 cmov pat clflush mmx fxsr sse sse2 ss ht nx constant_tsc nonstop_tsc pni ssse3 sse4_1 sse4_2 popcnt hypervisor ida dtherm
bogomips        : 4533.68
clflush size    : 64
cache_alignment : 64
address sizes   : 40 bits physical, 48 bits virtual
power management:

processor       : 3
vendor_id       : GenuineIntel
cpu family      : 6
model           : 26
model name      : Intel(R) Xeon(R) CPU           L5520  @ 2.27GHz
stepping        : 5
microcode       : 0x16
cpu MHz         : 2266.842
cache size      : 8192 KB
physical id     : 0
siblings        : 4
core id         : 0
cpu cores       : 1
apicid          : 0
initial apicid  : 20
fdiv_bug        : no
hlt_bug         : no
f00f_bug        : no
coma_bug        : no
fpu             : yes
fpu_exception   : yes
cpuid level     : 11
wp              : yes
flags           : fpu de tsc msr pae cx8 cmov pat clflush mmx fxsr sse sse2 ss ht nx constant_tsc nonstop_tsc pni ssse3 sse4_1 sse4_2 popcnt hypervisor ida dtherm
bogomips        : 4533.68
clflush size    : 64
cache_alignment : 64
address sizes   : 40 bits physical, 48 bits virtual
power management:
It is interesting to note that Linode actually uses pretty old, energy-efficient CPUs like L5520 rather than the new E3 or E5 CPUs.
Meminfo output:
 cat /proc/meminfo
MemTotal:         508100 kB
MemFree:            7244 kB
Buffers:           20424 kB
Cached:           422672 kB
SwapCached:           24 kB
Active:            43776 kB
Inactive:         422428 kB
Active(anon):       8884 kB
Inactive(anon):    14312 kB
Active(file):      34892 kB
Inactive(file):   408116 kB
Unevictable:           0 kB
Mlocked:               0 kB
HighTotal:             0 kB
HighFree:              0 kB
LowTotal:         508100 kB
LowFree:            7244 kB
SwapTotal:        262140 kB
SwapFree:         262084 kB
Dirty:                 0 kB
Writeback:             0 kB
AnonPages:         23160 kB
Mapped:             6604 kB
Shmem:                68 kB
Slab:              21156 kB
SReclaimable:      14072 kB
SUnreclaim:         7084 kB
KernelStack:         768 kB
PageTables:          804 kB
NFS_Unstable:          0 kB
Bounce:                0 kB
WritebackTmp:          0 kB
CommitLimit:      516188 kB
Committed_AS:     105400 kB
VmallocTotal:     329720 kB
VmallocUsed:        2976 kB
VmallocChunk:     326720 kB
DirectMap4k:      532480 kB
DirectMap2M:           0 kB
And time sync:
 time sync

real    0m0.003s
user    0m0.000s
sys     0m0.002s
The download speed is decent considering it is on a 100mbit port and the VPS is in Tokyo, which Cachefly probably does not have that much extensive network as what they have in North America:
wget cachefly.cachefly.net/100mb.test -O /dev/null
--2013-03-09 11:56:08--  http://cachefly.cachefly.net/100mb.test
Resolving cachefly.cachefly.net... 205.234.175.175
Connecting to cachefly.cachefly.net|205.234.175.175|:80... connected.
HTTP request sent, awaiting response... 200 OK
Length: 104857600 (100M) [application/octet-stream]
Saving to: a€?/dev/nulla€

100%[=======================================================================================================================================>] 104,857,600 9.99M/s   in 12s

2013-03-09 11:56:20 (8.60 MB/s) - a€?/dev/nulla€
Testing a little later again and the speed is slightly worse:
 wget cachefly.cachefly.net/100mb.test -O /dev/null
--2013-03-09 12:10:44--  http://cachefly.cachefly.net/100mb.test
Resolving cachefly.cachefly.net... 205.234.175.175
Connecting to cachefly.cachefly.net|205.234.175.175|:80... connected.
HTTP request sent, awaiting response... 200 OK
Length: 104857600 (100M) [application/octet-stream]
Saving to: a€?/dev/nulla€

100%[=======================================================================================================================================>] 104,857,600 8.38M/s   in 13s

2013-03-09 12:10:57 (7.80 MB/s) - a€?/dev/nulla€
For the upload test, I did not expect much since we all know that in general, connectivity from Asia to the rest of the world is not too great, and indeed that turned out to be the case. When downloading to my Quickweb test VPS in Chicago, IL, I was only able to get close to 700KB/s:
wget 106.187.54.6/100mb.test -O /dev/null
--2013-03-08 22:57:07--  http://106.187.54.6/100mb.test
Connecting to 106.187.54.6:80... connected.
HTTP request sent, awaiting response... 200 OK
Length: 104857600 (100M) [application/octet-stream]
Saving to: `/dev/null'

100%[======================================>] 104,857,600  696K/s   in 2m 28s

2013-03-08 22:59:35 (691 KB/s) - `/dev/null' saved [104857600/104857600]
Downloading from the West Coast on my ChicagoVPS VPS in Los Angeles, IL, shows even worse result:
 wget 106.187.54.6/100mb.test -O /dev/null
--2013-03-09 08:02:11--  http://106.187.54.6/100mb.test
Connecting to 106.187.54.6:80... connected.
HTTP request sent, awaiting response... 200 OK
Length: 104857600 (100M) [application/octet-stream]
Saving to: `/dev/null'

100%[======================================>] 104,857,600  552K/s   in 3m 23s

2013-03-09 08:05:34 (505 KB/s) - `/dev/null' saved [104857600/104857600]
And when I tried to download the test file from the test VPS from DireVPS in Maindenhead, UK, the speed is even worse at slightly more than 500KB/s:
 wget 106.187.54.6/100mb.test -O /dev/null
--2013-03-09 08:02:11--  http://106.187.54.6/100mb.test
Connecting to 106.187.54.6:80... connected.
HTTP request sent, awaiting response... 200 OK
Length: 104857600 (100M) [application/octet-stream]
Saving to: `/dev/null'

100%[======================================>] 104,857,600  552K/s   in 3m 23s

2013-03-09 08:05:34 (505 KB/s) - `/dev/null' saved [104857600/104857600]
The only bright spot among all the speed tests is from my Prometeus test VPS located in Milan, Italy, and for some amazing reason, I was able to get to more than 5MB/s:
wget 106.187.54.6/100mb.test -O /dev/null
--2013-03-08 23:06:12--  http://106.187.54.6/100mb.test
Connecting to 106.187.54.6:80... connected.
HTTP request sent, awaiting response... 200 OK
Length: 104857600 (100M) [application/octet-stream]
Saving to: `/dev/null'

100%[======================================>] 104,857,600 5.25M/s   in 22s

2013-03-08 23:06:35 (4.51 MB/s) - `/dev/null' saved [104857600/104857600]
Since DireVPS and Prometeus are both located in continental Europe, I was actually quite curious why it was the case while I am writing these,and did a traceroute back to the Linode Tokyo VPS from both my VPS with DireVPS and Prometeus to see if there is any difference.
Turns out Prometeus actually has more hops to go through, but it is taking the Frankfurt -> New York -> San Jose -> Japan route:
traceroute to 106.187.54.6 (106.187.54.6), 30 hops max, 60 byte packets
 1  pm17.prometeus.net (192.71.245.117)  0.036 ms  0.016 ms  0.014 ms
 2  gw-cdlan-2.prometeus.cdlan.net (217.171.46.253)  0.409 ms  0.483 ms  0.558 ms
 3  212.73.241.129 (212.73.241.129)  0.150 ms  0.164 ms  0.141 ms
 4  ae-14-14.ebr1.Frankfurt1.Level3.net (4.69.142.194)  156.697 ms  156.762 ms  156.743 ms
 5  ae-91-91.csw4.Frankfurt1.Level3.net (4.69.140.14)  159.771 ms ae-81-81.csw3.Frankfurt1.Level3.net (4.69.140.10)  156.510 ms ae-71-71.csw2.Frankfurt1.Level3.net (4.69.140.6)  156.135 ms
 6  ae-92-92.ebr2.Frankfurt1.Level3.net (4.69.140.29)  163.318 ms ae-82-82.ebr2.Frankfurt1.Level3.net (4.69.140.25)  164.247 ms  164.170 ms
 7  * * *
 8  * * *
 9  ae-71-71.csw2.NewYork1.Level3.net (4.69.134.70)  173.058 ms ae-61-61.csw1.NewYork1.Level3.net (4.69.134.66)  160.378 ms  160.272 ms
10  ae-72-72.ebr2.NewYork1.Level3.net (4.69.148.37)  164.656 ms  164.185 ms ae-62-62.ebr2.NewYork1.Level3.net (4.69.148.33)  158.105 ms
11  4.69.135.185 (4.69.135.185)  156.118 ms  156.296 ms  156.179 ms
12  ae-81-81.csw3.SanJose1.Level3.net (4.69.153.10)  155.730 ms ae-91-91.csw4.SanJose1.Level3.net (4.69.153.14)  158.815 ms ae-71-71.csw2.SanJose1.Level3.net (4.69.153.6)  156.205 ms
13  ae-3-80.edge1.SanJose2.Level3.net (4.69.152.135)  162.596 ms ae-1-60.edge1.SanJose2.Level3.net (4.69.152.7)  160.925 ms ae-3-80.edge1.SanJose2.Level3.net (4.69.152.135)  164.665 ms
14  KDDI-AMERIC.edge1.SanJose2.Level3.net (4.28.172.22)  165.296 ms  165.312 ms  164.558 ms
15  pajbb001.int-gw.kddi.ne.jp (111.87.3.49)  166.823 ms pajbb002.int-gw.kddi.ne.jp (111.87.3.53)  161.624 ms  160.963 ms
16  otejbb206.int-gw.kddi.ne.jp (203.181.100.153)  289.325 ms otejbb205.int-gw.kddi.ne.jp (203.181.100.137)  273.034 ms  273.359 ms
17  cm-fcu203.kddnet.ad.jp (124.215.194.180)  278.613 ms cm-fcu203.kddnet.ad.jp (124.215.194.164)  272.763 ms cm-fcu203.kddnet.ad.jp (124.215.194.180)  276.008 ms
18  124.215.199.122 (124.215.199.122)  278.101 ms  268.418 ms  277.754 ms
And with DireVPS, it was taking the London -> LA -> Japan route:
traceroute 106.187.54.6
traceroute to 106.187.54.6 (106.187.54.6), 30 hops max, 60 byte packets
 1  12.108.255.149.in-addr.arpa (149.255.108.12)  0.036 ms  0.010 ms  0.007 ms
 2  87.117.212.41 (87.117.212.41)  0.328 ms  0.318 ms  0.307 ms
 3  610.core1.hex.as20860.net (62.233.127.181)  1.186 ms  1.211 ms  1.261 ms
 4  TenGigabitEthernet7-1.ar4.LON3.gblx.net (64.211.1.189)  1.259 ms  1.298 ms  1.336 ms
 5  ae0.scr3.LON3.gblx.net (67.16.142.101)  1.216 ms  1.207 ms  1.197 ms
 6  xe2-3-2-10G.scr3.LAX1.gblx.net (67.16.165.65)  131.997 ms  132.008 ms  131.996 ms
 7  e5-1-40G.ar6.LAX1.gblx.net (67.17.111.65)  139.965 ms  132.110 ms  132.107 ms
 8  64.208.27.114 (64.208.27.114)  241.854 ms  241.961 ms  242.003 ms
 9  lajbb001.int-gw.kddi.ne.jp (59.128.2.209)  255.244 ms  255.241 ms lajbb002.k
10  otejbb206.int-gw.kddi.ne.jp (203.181.100.21)  243.136 ms  243.139 ms  243.12
11  cm-fcu203.kddnet.ad.jp (124.215.194.164)  266.662 ms cm-fcu203.kddnet.ad.jp
12  124.215.199.122 (124.215.199.122)  268.107 ms  259.761 ms  259.760 ms
Since both GlobalCrossing (gblx.net) and Level3 (level3.net) are under the same brand and I would assume they have similar infrastructure (correct me if I am wrong please), I can only assume the route taken by Prometeus is a much (and apparently faster route) than GlobalCrossing.
The disk I/O is not the greatest but pretty decent:
dd if=/dev/zero of=test bs=64k count=16k conv=fdatasync
16384+0 records in
16384+0 records out
1073741824 bytes (1.1 GB) copied, 10.5379 s, 102 MB/s
Testing again showed similar results:
 dd if=/dev/zero of=test bs=64k count=16k conv=fdatasync
16384+0 records in
16384+0 records out
1073741824 bytes (1.1 GB) copied, 10.0793 s, 107 MB/s
IOPing shows the disk is in general pretty stable, however it did flicker a little towards the end of my first ioping test on the VPS:
4096 bytes from . (ext3 /dev/root): request=1 time=0.1 ms
4096 bytes from . (ext3 /dev/root): request=2 time=0.2 ms
4096 bytes from . (ext3 /dev/root): request=3 time=0.2 ms
4096 bytes from . (ext3 /dev/root): request=4 time=0.2 ms
4096 bytes from . (ext3 /dev/root): request=5 time=0.2 ms
4096 bytes from . (ext3 /dev/root): request=6 time=0.2 ms
4096 bytes from . (ext3 /dev/root): request=7 time=0.2 ms
4096 bytes from . (ext3 /dev/root): request=8 time=0.2 ms
4096 bytes from . (ext3 /dev/root): request=9 time=0.2 ms
4096 bytes from . (ext3 /dev/root): request=10 time=65.5 ms

--- . (ext3 /dev/root) ioping statistics ---
10 requests completed in 9068.8 ms, 150 iops, 0.6 mb/s
min/avg/max/mdev = 0.1/6.7/65.5/19.6 ms
Testing again and the results are better:
dd if=/dev/zero of=test bs=64k count=16k conv=fdatasync
16384+0 records in
16384+0 records out
1073741824 bytes (1.1 GB) copied, 10.0793 s, 107 MB/s


 ioping -c 10 .
4096 bytes from . (ext3 /dev/root): request=1 time=0.1 ms
4096 bytes from . (ext3 /dev/root): request=2 time=0.2 ms
4096 bytes from . (ext3 /dev/root): request=3 time=0.2 ms
4096 bytes from . (ext3 /dev/root): request=4 time=0.1 ms
4096 bytes from . (ext3 /dev/root): request=5 time=0.2 ms
4096 bytes from . (ext3 /dev/root): request=6 time=0.2 ms
4096 bytes from . (ext3 /dev/root): request=7 time=0.2 ms
4096 bytes from . (ext3 /dev/root): request=8 time=0.2 ms
4096 bytes from . (ext3 /dev/root): request=9 time=0.2 ms
4096 bytes from . (ext3 /dev/root): request=10 time=0.2 ms

--- . (ext3 /dev/root) ioping statistics ---
10 requests completed in 9003.9 ms, 5467 iops, 21.4 mb/s
min/avg/max/mdev = 0.1/0.2/0.2/0.0 ms
Benchmark testing was what takes most of the time in general, so I was a little afraid that I did not get a chance to complete my usual benchmark testing (which is Unixbench twice, Geekbench twice). As such, I ran a Unixbench test when the VPS was first booted and after about an hour, this is what I see:
   #    #  #    #  #  #    #          #####   ######  #    #   ####   #    #
   #    #  ##   #  #   #  #           #    #  #       ##   #  #    #  #    #
   #    #  # #  #  #    ##            #####   #####   # #  #  #       ######
   #    #  #  # #  #    ##            #    #  #       #  # #  #       #    #
   #    #  #   ##  #   #  #           #    #  #       #   ##  #    #  #    #
    ####   #    #  #  #    #          #####   ######  #    #   ####   #    #

   Version 5.1.3                      Based on the Byte Magazine Unix Benchmark

   Multi-CPU version                  Version 5 revisions by Ian Smith,
                                      Sunnyvale, CA, USA
   January 13, 2011                   johantheghost at yahoo period com


1 x Dhrystone 2 using register variables  1 2 3 4 5 6 7 8 9 10

1 x Double-Precision Whetstone  1 2 3 4 5 6 7 8 9 10

1 x Execl Throughput  1 2 3

1 x File Copy 1024 bufsize 2000 maxblocks  1 2 3

1 x File Copy 256 bufsize 500 maxblocks  1 2 3

1 x File Copy 4096 bufsize 8000 maxblocks  1 2 3

1 x Pipe Throughput  1 2 3 4 5 6 7 8 9 10

1 x Pipe-based Context Switching  1 2 3 4 5 6 7 8 9 10

1 x Process Creation  1 2 3

1 x System Call Overhead  1 2 3 4 5 6 7 8 9 10

1 x Shell Scripts (1 concurrent)  1  2 3

1 x Shell Scripts (8 concurrent)  1 2 3

4 x Dhrystone 2 using register variables  1 2 3 4 5 6 7 8 9 10

4 x Double-Precision Whetstone  1 2 3 4 5 6 7 8 9 10

4 x Execl Throughput  1 2 3

4 x File Copy 1024 bufsize 2000 maxblocks  1 2 3

4 x File Copy 256 bufsize 500 maxblocks  1 2 3

4 x File Copy 4096 bufsize 8000 maxblocks  1 2 3

4 x Pipe Throughput  1 2 3 4 5 6 7 8 9 10

4 x Pipe-based Context Switching  1 2 3 4 5 6 7 8 9 10

4 x Process Creation  1 2 3

4 x System Call Overhead  1 2 3 4 5 6 7 8 9 10

4 x Shell Scripts (1 concurrent)  1 2 3

4 x Shell Scripts (8 concurrent)  1 2 3

========================================================================
   BYTE UNIX Benchmarks (Version 5.1.3)

   System: li406-6: GNU/Linux
   OS: GNU/Linux -- 3.7.10-linode49 -- #2 SMP Wed Feb 27 14:15:25 EST 2013
   Machine: i686 (unknown)
   Language: en_US.utf8 (charmap="UTF-8", collate="UTF-8")
   CPU 0: Intel(R) Xeon(R) CPU L5520 @ 2.27GHz (4533.7 bogomips)
          Hyper-Threading, MMX, Physical Address Ext
   CPU 1: Intel(R) Xeon(R) CPU L5520 @ 2.27GHz (4533.7 bogomips)
          Hyper-Threading, MMX, Physical Address Ext
   CPU 2: Intel(R) Xeon(R) CPU L5520 @ 2.27GHz (4533.7 bogomips)
          Hyper-Threading, MMX, Physical Address Ext
   CPU 3: Intel(R) Xeon(R) CPU L5520 @ 2.27GHz (4533.7 bogomips)
          Hyper-Threading, MMX, Physical Address Ext
   10:52:39 up 48 min,  1 user,  load average: 0.14, 1.07, 1.05; runlevel 2

------------------------------------------------------------------------
Benchmark Run: Sat Mar 09 2013 10:52:39 - 11:20:32
4 CPUs in system; running 1 parallel copy of tests

Dhrystone 2 using register variables       12107109.4 lps   (10.0 s, 7 samples)
Double-Precision Whetstone                     2282.4 MWIPS (10.3 s, 7 samples)
Execl Throughput                               1673.2 lps   (30.0 s, 2 samples)
File Copy 1024 bufsize 2000 maxblocks        415721.6 KBps  (30.0 s, 2 samples)
File Copy 256 bufsize 500 maxblocks          110845.3 KBps  (30.0 s, 2 samples)
File Copy 4096 bufsize 8000 maxblocks       1000748.6 KBps  (30.0 s, 2 samples)
Pipe Throughput                              619820.8 lps   (10.0 s, 7 samples)
Pipe-based Context Switching                  33203.0 lps   (10.0 s, 7 samples)
Process Creation                               2927.5 lps   (30.0 s, 2 samples)
Shell Scripts (1 concurrent)                   4154.8 lpm   (60.0 s, 2 samples)
Shell Scripts (8 concurrent)                   1274.3 lpm   (60.0 s, 2 samples)
System Call Overhead                         470786.1 lps   (10.0 s, 7 samples)

System Benchmarks Index Values               BASELINE       RESULT    INDEX
Dhrystone 2 using register variables         116700.0   12107109.4   1037.5
Double-Precision Whetstone                       55.0       2282.4    415.0
Execl Throughput                                 43.0       1673.2    389.1
File Copy 1024 bufsize 2000 maxblocks          3960.0     415721.6   1049.8
File Copy 256 bufsize 500 maxblocks            1655.0     110845.3    669.8
File Copy 4096 bufsize 8000 maxblocks          5800.0    1000748.6   1725.4
Pipe Throughput                               12440.0     619820.8    498.2
Pipe-based Context Switching                   4000.0      33203.0     83.0
Process Creation                                126.0       2927.5    232.3
Shell Scripts (1 concurrent)                     42.4       4154.8    979.9
Shell Scripts (8 concurrent)                      6.0       1274.3   2123.9
System Call Overhead                          15000.0     470786.1    313.9
                                                                   ========
System Benchmarks Index Score                                         573.9

------------------------------------------------------------------------
Benchmark Run: Sat Mar 09 2013 11:20:32 - 11:48:28
4 CPUs in system; running 4 parallel copies of tests

Dhrystone 2 using register variables       41692937.3 lps   (10.0 s, 7 samples)
Double-Precision Whetstone                     8699.5 MWIPS (10.4 s, 7 samples)
Execl Throughput                               5910.9 lps   (30.0 s, 2 samples)
File Copy 1024 bufsize 2000 maxblocks        750775.3 KBps  (30.0 s, 2 samples)
File Copy 256 bufsize 500 maxblocks          194696.9 KBps  (30.0 s, 2 samples)
File Copy 4096 bufsize 8000 maxblocks       1997695.4 KBps  (30.0 s, 2 samples)
Pipe Throughput                             2291065.3 lps   (10.0 s, 7 samples)
Pipe-based Context Switching                 278929.9 lps   (10.0 s, 7 samples)
Process Creation                              10579.3 lps   (30.0 s, 2 samples)
Shell Scripts (1 concurrent)                  10814.3 lpm   (60.0 s, 2 samples)
Shell Scripts (8 concurrent)                   1393.5 lpm   (60.1 s, 2 samples)
System Call Overhead                        1760326.1 lps   (10.0 s, 7 samples)

System Benchmarks Index Values               BASELINE       RESULT    INDEX
Dhrystone 2 using register variables         116700.0   41692937.3   3572.7
Double-Precision Whetstone                       55.0       8699.5   1581.7
Execl Throughput                                 43.0       5910.9   1374.6
File Copy 1024 bufsize 2000 maxblocks          3960.0     750775.3   1895.9
File Copy 256 bufsize 500 maxblocks            1655.0     194696.9   1176.4
File Copy 4096 bufsize 8000 maxblocks          5800.0    1997695.4   3444.3
Pipe Throughput                               12440.0    2291065.3   1841.7
Pipe-based Context Switching                   4000.0     278929.9    697.3
Process Creation                                126.0      10579.3    839.6
Shell Scripts (1 concurrent)                     42.4      10814.3   2550.5
Shell Scripts (8 concurrent)                      6.0       1393.5   2322.5
System Call Overhead                          15000.0    1760326.1   1173.6
                                                                   ========
System Benchmarks Index Score                                        1663.0
For a four-core CPU, I would say the score is definitely not on the impressive end of the scale.
I had some time before the trial VPS was turned off (in fact, it was the last thing I did before the VPS turned off) so I ran the Unixbench test again, and the score is even slightly worse than before:
   #    #  #    #  #  #    #          #####   ######  #    #   ####   #    #
   #    #  ##   #  #   #  #           #    #  #       ##   #  #    #  #    #
   #    #  # #  #  #    ##            #####   #####   # #  #  #       ######
   #    #  #  # #  #    ##            #    #  #       #  # #  #       #    #
   #    #  #   ##  #   #  #           #    #  #       #   ##  #    #  #    #
    ####   #    #  #  #    #          #####   ######  #    #   ####   #    #

   Version 5.1.3                      Based on the Byte Magazine Unix Benchmark

   Multi-CPU version                  Version 5 revisions by Ian Smith,
                                      Sunnyvale, CA, USA
   January 13, 2011                   johantheghost at yahoo period com


1 x Dhrystone 2 using register variables  1 2 3 4 5 6 7 8 9 10

1 x Double-Precision Whetstone  1 2 3 4 5 6 7 8 9 10

1 x Execl Throughput  1 2 3

1 x File Copy 1024 bufsize 2000 maxblocks  1 2 3

1 x File Copy 256 bufsize 500 maxblocks  1 2 3

1 x File Copy 4096 bufsize 8000 maxblocks  1 2 3

1 x Pipe Throughput  1 2 3 4 5 6 7 8 9 10

1 x Pipe-based Context Switching  1 2 3 4 5 6 7 8 9 10

1 x Process Creation  1 2 3

1 x System Call Overhead  1 2 3 4 5 6 7 8 9 10

1 x Shell Scripts (1 concurrent)  1 2 3

1 x Shell Scripts (8 concurrent)  1 2 3

4 x Dhrystone 2 using register variables  1 2 3 4 5 6 7 8 9 10

4 x Double-Precision Whetstone  1 2 3 4 5 6 7 8 9 10

4 x Execl Throughput  1 2 3

4 x File Copy 1024 bufsize 2000 maxblocks  1 2 3

4 x File Copy 256 bufsize 500 maxblocks  1 2 3

4 x File Copy 4096 bufsize 8000 maxblocks  1 2 3

4 x Pipe Throughput  1 2 3 4 5 6 7 8 9 10

4 x Pipe-based Context Switching  1 2 3 4 5 6 7 8 9 10

4 x Process Creation  1 2 3

4 x System Call Overhead  1 2 3 4 5 6 7 8 9 10

4 x Shell Scripts (1 concurrent)  1 2 3

4 x Shell Scripts (8 concurrent)  1 2 3

========================================================================
   BYTE UNIX Benchmarks (Version 5.1.3)

   System: li406-6: GNU/Linux
   OS: GNU/Linux -- 3.7.10-linode49 -- #2 SMP Wed Feb 27 14:15:25 EST 2013
   Machine: i686 (unknown)
   Language: en_US.utf8 (charmap="UTF-8", collate="UTF-8")
   CPU 0: Intel(R) Xeon(R) CPU L5520 @ 2.27GHz (4533.7 bogomips)
          Hyper-Threading, MMX, Physical Address Ext
   CPU 1: Intel(R) Xeon(R) CPU L5520 @ 2.27GHz (4533.7 bogomips)
          Hyper-Threading, MMX, Physical Address Ext
   CPU 2: Intel(R) Xeon(R) CPU L5520 @ 2.27GHz (4533.7 bogomips)
          Hyper-Threading, MMX, Physical Address Ext
   CPU 3: Intel(R) Xeon(R) CPU L5520 @ 2.27GHz (4533.7 bogomips)
          Hyper-Threading, MMX, Physical Address Ext
   12:39:39 up  2:35,  1 user,  load average: 0.00, 0.01, 0.28; runlevel 2

------------------------------------------------------------------------
Benchmark Run: Sat Mar 09 2013 12:39:39 - 13:07:31
4 CPUs in system; running 1 parallel copy of tests

Dhrystone 2 using register variables       12474842.4 lps   (10.0 s, 7 samples)
Double-Precision Whetstone                     2301.5 MWIPS (10.2 s, 7 samples)
Execl Throughput                               1707.4 lps   (30.0 s, 2 samples)
File Copy 1024 bufsize 2000 maxblocks        422687.3 KBps  (30.0 s, 2 samples)
File Copy 256 bufsize 500 maxblocks          113581.4 KBps  (30.0 s, 2 samples)
File Copy 4096 bufsize 8000 maxblocks        986131.9 KBps  (30.0 s, 2 samples)
Pipe Throughput                              623029.0 lps   (10.0 s, 7 samples)
Pipe-based Context Switching                  33192.5 lps   (10.0 s, 7 samples)
Process Creation                               2998.7 lps   (30.0 s, 2 samples)
Shell Scripts (1 concurrent)                   4194.7 lpm   (60.0 s, 2 samples)
Shell Scripts (8 concurrent)                   1265.2 lpm   (60.0 s, 2 samples)
System Call Overhead                         471201.8 lps   (10.0 s, 7 samples)

System Benchmarks Index Values               BASELINE       RESULT    INDEX
Dhrystone 2 using register variables         116700.0   12474842.4   1069.0
Double-Precision Whetstone                       55.0       2301.5    418.5
Execl Throughput                                 43.0       1707.4    397.1
File Copy 1024 bufsize 2000 maxblocks          3960.0     422687.3   1067.4
File Copy 256 bufsize 500 maxblocks            1655.0     113581.4    686.3
File Copy 4096 bufsize 8000 maxblocks          5800.0     986131.9   1700.2
Pipe Throughput                               12440.0     623029.0    500.8
Pipe-based Context Switching                   4000.0      33192.5     83.0
Process Creation                                126.0       2998.7    238.0
Shell Scripts (1 concurrent)                     42.4       4194.7    989.3
Shell Scripts (8 concurrent)                      6.0       1265.2   2108.7
System Call Overhead                          15000.0     471201.8    314.1
                                                                   ========
System Benchmarks Index Score                                         579.5

------------------------------------------------------------------------
Benchmark Run: Sat Mar 09 2013 13:07:31 - 13:35:24
4 CPUs in system; running 4 parallel copies of tests

Dhrystone 2 using register variables       42405873.1 lps   (10.0 s, 7 samples)
Double-Precision Whetstone                     8725.8 MWIPS (10.2 s, 7 samples)
Execl Throughput                               5945.3 lps   (30.0 s, 2 samples)
File Copy 1024 bufsize 2000 maxblocks        639121.4 KBps  (30.0 s, 2 samples)
File Copy 256 bufsize 500 maxblocks          195722.4 KBps  (30.0 s, 2 samples)
File Copy 4096 bufsize 8000 maxblocks       1829198.7 KBps  (30.0 s, 2 samples)
Pipe Throughput                             2198171.9 lps   (10.0 s, 7 samples)
Pipe-based Context Switching                 263732.4 lps   (10.0 s, 7 samples)
Process Creation                               9621.8 lps   (30.0 s, 2 samples)
Shell Scripts (1 concurrent)                  10388.6 lpm   (60.0 s, 2 samples)
Shell Scripts (8 concurrent)                   1359.3 lpm   (60.1 s, 2 samples)
System Call Overhead                        1724663.1 lps   (10.0 s, 7 samples)

System Benchmarks Index Values               BASELINE       RESULT    INDEX
Dhrystone 2 using register variables         116700.0   42405873.1   3633.8
Double-Precision Whetstone                       55.0       8725.8   1586.5
Execl Throughput                                 43.0       5945.3   1382.6
File Copy 1024 bufsize 2000 maxblocks          3960.0     639121.4   1613.9
File Copy 256 bufsize 500 maxblocks            1655.0     195722.4   1182.6
File Copy 4096 bufsize 8000 maxblocks          5800.0    1829198.7   3153.8
Pipe Throughput                               12440.0    2198171.9   1767.0
Pipe-based Context Switching                   4000.0     263732.4    659.3
Process Creation                                126.0       9621.8    763.6
Shell Scripts (1 concurrent)                     42.4      10388.6   2450.2
Shell Scripts (8 concurrent)                      6.0       1359.3   2265.5
System Call Overhead                          15000.0    1724663.1   1149.8
                                                                   ========
System Benchmarks Index Score                                        1595.7
Geekbench score, on the other hand, showed a somewhat more reasonable score:
System Information
  Platform:                  Linux x86 (32-bit)
  Compiler:                  GCC 4.1.2 20070925 (Red Hat 4.1.2-33)
  Operating System:          Linux 3.7.10-linode49 i686
  Model:                     Linux PC (Intel(R) Xeon(R) CPU           L5520  @ 2.27GHz)
  Motherboard:               Unknown Motherboard
  Processor:                 Intel(R) Xeon(R) CPU           L5520  @ 2.27GHz
  Processor ID:              GenuineIntel Family 6 Model 26 Stepping 5
  Logical Processors:        4
  Physical Processors:       1
  Processor Frequency:       2.27 GHz
  L1 Instruction Cache:      0.00 B
  L1 Data Cache:             0.00 B
  L2 Cache:                  256 KB
  L3 Cache:                  0.00 B
  Bus Frequency:             0.00 Hz
  Memory:                    496 MB
  Memory Type:               N/A
  SIMD:                      1
  BIOS:                      N/A
  Processor Model:           Intel(R) Xeon(R) CPU           L5520  @ 2.27GHz
  Processor Cores:           4

Integer
  Blowfish
    single-threaded scalar    1555 ||||||
    multi-threaded scalar     5996 |||||||||||||||||||||||
  Text Compress
    single-threaded scalar    1728 ||||||
    multi-threaded scalar     5475 |||||||||||||||||||||
  Text Decompress
    single-threaded scalar    1793 |||||||
    multi-threaded scalar     6097 ||||||||||||||||||||||||
  Image Compress
    single-threaded scalar    1475 |||||
    multi-threaded scalar     4996 |||||||||||||||||||
  Image Decompress
    single-threaded scalar    1339 |||||
    multi-threaded scalar     3991 |||||||||||||||
  Lua
    single-threaded scalar    2706 ||||||||||
    multi-threaded scalar     7592 ||||||||||||||||||||||||||||||

Floating Point
  Mandelbrot
    single-threaded scalar    1879 |||||||
    multi-threaded scalar     7346 |||||||||||||||||||||||||||||
  Dot Product
    single-threaded scalar    3028 ||||||||||||
    multi-threaded scalar     9653 ||||||||||||||||||||||||||||||||||||||
    single-threaded vector    3492 |||||||||||||
    multi-threaded vector    11019 ||||||||||||||||||||||||||||||||||||||||||||
  LU Decomposition
    single-threaded scalar    2099 ||||||||
    multi-threaded scalar     5211 ||||||||||||||||||||
  Primality Test
    single-threaded scalar    3026 ||||||||||||
    multi-threaded scalar     8611 ||||||||||||||||||||||||||||||||||
  Sharpen Image
    single-threaded scalar    5065 ||||||||||||||||||||
    multi-threaded scalar    13969 |||||||||||||||||||||||||||||||||||||||||||||||||||||||
  Blur Image
    single-threaded scalar    4605 ||||||||||||||||||
    multi-threaded scalar    14928 |||||||||||||||||||||||||||||||||||||||||||||||||||||||||||

Memory
  Read Sequential
    single-threaded scalar    4274 |||||||||||||||||
  Write Sequential
    single-threaded scalar    6100 ||||||||||||||||||||||||
  Stdlib Allocate
    single-threaded scalar    3289 |||||||||||||
  Stdlib Write
    single-threaded scalar    3337 |||||||||||||
  Stdlib Copy
    single-threaded scalar    6627 ||||||||||||||||||||||||||

Stream
  Stream Copy
    single-threaded scalar    3032 ||||||||||||
    single-threaded vector    3791 |||||||||||||||
  Stream Scale
    single-threaded scalar    3230 ||||||||||||
    single-threaded vector    3599 ||||||||||||||
  Stream Add
    single-threaded scalar    2770 |||||||||||
    single-threaded vector    3497 |||||||||||||
  Stream Triad
    single-threaded scalar    2953 |||||||||||
    single-threaded vector    2532 ||||||||||

Integer Score:                3728 ||||||||||||||
Floating Point Score:         6709 ||||||||||||||||||||||||||
Memory Score:                 4725 ||||||||||||||||||
Stream Score:                 3175 ||||||||||||

Overall Geekbench Score:      4915 |||||||||||||||||||
Testing again showed slightly better results:
System Information
  Platform:                  Linux x86 (32-bit)
  Compiler:                  GCC 4.1.2 20070925 (Red Hat 4.1.2-33)
  Operating System:          Linux 3.7.10-linode49 i686
  Model:                     Linux PC (Intel(R) Xeon(R) CPU           L5520  @ 2.27GHz)
  Motherboard:               Unknown Motherboard
  Processor:                 Intel(R) Xeon(R) CPU           L5520  @ 2.27GHz
  Processor ID:              GenuineIntel Family 6 Model 26 Stepping 5
  Logical Processors:        4
  Physical Processors:       1
  Processor Frequency:       2.27 GHz
  L1 Instruction Cache:      0.00 B
  L1 Data Cache:             0.00 B
  L2 Cache:                  256 KB
  L3 Cache:                  0.00 B
  Bus Frequency:             0.00 Hz
  Memory:                    496 MB
  Memory Type:               N/A
  SIMD:                      1
  BIOS:                      N/A
  Processor Model:           Intel(R) Xeon(R) CPU           L5520  @ 2.27GHz
  Processor Cores:           4

Integer
  Blowfish
    single-threaded scalar    1564 ||||||
    multi-threaded scalar     6523 ||||||||||||||||||||||||||
  Text Compress
    single-threaded scalar    1762 |||||||
    multi-threaded scalar     6346 |||||||||||||||||||||||||
  Text Decompress
    single-threaded scalar    1790 |||||||
    multi-threaded scalar     6911 |||||||||||||||||||||||||||
  Image Compress
    single-threaded scalar    1485 |||||
    multi-threaded scalar     5516 ||||||||||||||||||||||
  Image Decompress
    single-threaded scalar    1317 |||||
    multi-threaded scalar     4586 ||||||||||||||||||
  Lua
    single-threaded scalar    2713 ||||||||||
    multi-threaded scalar     7688 ||||||||||||||||||||||||||||||

Floating Point
  Mandelbrot
    single-threaded scalar    1877 |||||||
    multi-threaded scalar     7439 |||||||||||||||||||||||||||||
  Dot Product
    single-threaded scalar    3041 ||||||||||||
    multi-threaded scalar    10933 |||||||||||||||||||||||||||||||||||||||||||
    single-threaded vector    3629 ||||||||||||||
    multi-threaded vector    15689 ||||||||||||||||||||||||||||||||||||||||||||||||||||||||||||||
  LU Decomposition
    single-threaded scalar    2129 ||||||||
    multi-threaded scalar     6728 ||||||||||||||||||||||||||
  Primality Test
    single-threaded scalar    3066 ||||||||||||
    multi-threaded scalar     8981 |||||||||||||||||||||||||||||||||||
  Sharpen Image
    single-threaded scalar    4999 |||||||||||||||||||
    multi-threaded scalar    16637 ||||||||||||||||||||||||||||||||||||||||||||||||||||||||||||||||||
  Blur Image
    single-threaded scalar    4661 ||||||||||||||||||
    multi-threaded scalar    14020 ||||||||||||||||||||||||||||||||||||||||||||||||||||||||

Memory
  Read Sequential
    single-threaded scalar    4226 ||||||||||||||||
  Write Sequential
    single-threaded scalar    6051 ||||||||||||||||||||||||
  Stdlib Allocate
    single-threaded scalar    3278 |||||||||||||
  Stdlib Write
    single-threaded scalar    3298 |||||||||||||
  Stdlib Copy
    single-threaded scalar    6532 ||||||||||||||||||||||||||

Stream
  Stream Copy
    single-threaded scalar    3286 |||||||||||||
    single-threaded vector    4027 ||||||||||||||||
  Stream Scale
    single-threaded scalar    3192 ||||||||||||
    single-threaded vector    3221 ||||||||||||
  Stream Add
    single-threaded scalar    2756 |||||||||||
    single-threaded vector    3430 |||||||||||||
  Stream Triad
    single-threaded scalar    2878 |||||||||||
    single-threaded vector    2557 ||||||||||

Integer Score:                4016 ||||||||||||||||
Floating Point Score:         7416 |||||||||||||||||||||||||||||
Memory Score:                 4677 ||||||||||||||||||
Stream Score:                 3168 ||||||||||||

Overall Geekbench Score:      5253 |||||||||||||||||||||
Customer Service and Support
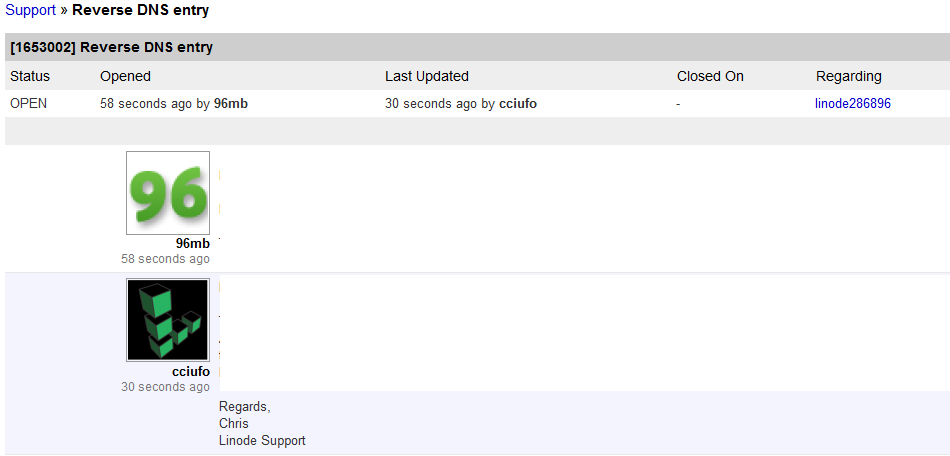
One of the most remarkable feature that really impressed me was how fast Linode was when it comes to responding to support tickets. I raised a ticket about how to enter rDNS and it was responded in 28 seconds! Even though they do not have a fancy live chat feature on their support, their response to ticket is definitely close to instant:
On top of a great ticket response time, Linode also offers extensive resources for you to figure out the problem/do the work yourself, which includes the FAQ, Library, Forum, and IRC. In fact, Linode library is probably one of the most extensive library showing how to set up various software stack yourself, and the best part is it is actually open to public, meaning that you do not have to be a Linode member to enjoy this knowledgebase.
Finally, Linode has a very good notification system that keeps your VPS monitored. In the short four hours span, I have 12 emails from Linode that includes one welcome email, 4 ticket-related email (open, two replies and close), one disk I/O usage warning and two CPU warning, as well as four more emails whenever there are major events happened to the VPS (initial configuration, snapshot, shutdown and finally VPS termination). Basically for Linode, you can pretty much just let the server run without worrying too much.
Note that Linode also has its own IPhone app which you can use to monitor the VPS on your Apple devices, although it would be great if they could monitor the VPS on other mobile platform as well.
Conclusion
I found it is really difficult to give a one line comment about Linode. On one hand, we all know the prices it charges is not cheap and considering the old hardware and not-so-impressive network on the VPS, it probably does not worth the price. However, the support and the control panel, which are two major selling points of Linode, are indeed nothing less than absolutely awesome. Therefore, if you would like to have a VPS that you don’t have to worry about too much (until of course, your site gets DDOSed) once it is up and running, and get support whenever you need, then Linode would probably the best fit for you, otherwise, I have no doubt that you would be able to pay a little less and get a lot more.
Finally, what do you think of extreme reviews like this? Granted reviews like this are really quick and I might just be lucky to be on a good node and when the node is doing great, but is it something that would at least help? If so I’ll do a few more when I have time. Feel free to post your comments below. Thanks!
Nodebalencers is a load balancing service not a VPS. I know you can achieve the same with a VPS but nodebalencers got less overhead and easy to use
@Ruchira: thanks for the clarification, so essentially you don’t get root access with the node balancers?
yep no root access. its just the control panel which you can enter the ips,ports of your servers and it just do the work for you 🙂
Ah, I see, so basically it will know how to mirror the contents automatically, that’s pretty good.
I did the 4 hour trial as well and received a VPS on a newer node. I can’t recall if it was E3 or E5 but it was one of the two.
Disk IO was better.
Though to be fair I think people who buy Linodes do so because of the network and service. Things like good staff, The ability to load balance. high uptime etc.
Its surprising that they have anythig other than L5520. L5520 is the only processor they have used for past 2+ years.
@Luma: What can I say? you are just one of their favorite boys 🙂 I could not capture the uptime since I only had it for 4 hours, but indeed the support really impressed me.
Great review.
I think when you really think about this review as a whole the reason Linode make it work the money is not that they use beading edge CPU’s, the greatest disk arrays, or even run the worlds fastest network it is that the quality of the ‘service’ is through the roof.
They have unique services, top level support staff, and a great reputation. I know 5520’s are not top of the line but let us be honest if you are using a VPS you don’t need dedicated hardware to begin with and you are unlikely to even use even 20% of a 5520 at any given time and if you really do need that you should not be using a VPS.
I think Linode just have things right.. they know what actually works and they know how to do things right and they know how to make sure you have everything you need from the 1st second with them.
As a VPS host this really makes me think hard about things, is the highest unixbench score important or would my efforts be better spent in developing service features and quality while providing a fair amount of performance.
My own reviews of Inception Hosting that you have done in the past blow the raw numbers out of the water, but can you really feel the difference between a 2000 and 1600 unixBench score as an end user? probably not, and can the avg user hitting your site tell the difference… almost certainly not.
Very interesting stuff, glad you did this.
Superb site you have here but I was curious if youu knew of any message boards that cover the same topics discussed in this article?
I’d really like to be a part of group where I can get responses from other experienced people that share the same interest.
If you have any recommendations, please leet me know.
Thanks!
@Edgar: Low end talk (lowendtalk.com) might be a good point to start if you are looking for more discussions on the low end VPS. 96MB also has its own forum (96forum.com) but it has been a while since anyone posted anything on it.