
96MB Low End VPS Review Part XXXVIII – servaRICA
So…it has been a few weeks since the last VPS review from 96MB.com and as promised in my last review, I will present another review as my Christmas present to the readers of 96MB.com. As promised, and since Hani from servaRICA has emailed me almost 3 months ago asking for a review, we will get it started without any further delay.
Basic Information and Set Up
Servarica is a provider that only provide VPS using Xen virtualization technology, as per this post on WHT and their lowest VPS offering, the XenSource VPS Offer 1, comes with the following specification:

The price is not exactly “low end” for a 256MB VPS, so we’ll hope for a solid specification for the VPS. However, the servers are located in Montreal, Quebec, Canada, which could be a factor to justify the price.
The sign up page is using HTTPS page, and there is only monthly payment available:

Furthermore, as you can see, the price is actually 6.99CAD, which is less than 7USD.
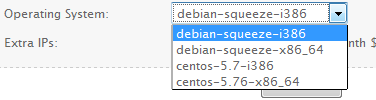
On the sign up page, relatively few OS templates can be chosen as well:
The IP address is not that cheap as well

I have received the VPS email the same minute as the Paypal payment confirmation, however the VPS was not immediately activated and I waited for 6 minutes to be able to ping my VPS server. It turns out that the server details were sent before the server was built, which could take as long as an hour.
Once the server is up and running, you can use the WHMCS interface to get to the control panel of the VPS. Interestingly, there is no SolusVM control panel for this particular VPS (or at least the information was not revealed in the welcome email) and the only control functionalities you have in WHMCS is Shutdown, Reboot, and Hard Shutdown (UPDATE: Hani from servaRICA has promised me since this review was published that the SolusVM would be up and running “in 1 week”, could servaRICA customers please confirm that?):
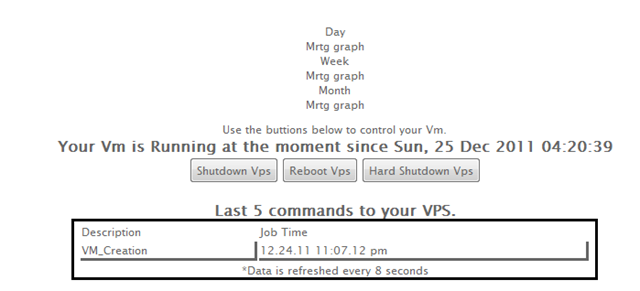
The little control panel also shows the commands to the VPS, as well as the uptime. It should show the usage graph as well, however from the screenshot above, the graph somehow did not work for me.
There is no functionalities to rebuild the VPS automatically, which is rather interesting and different from the regular Xen PV platforms. And obviously, lack of a proper control panel has severely limited how much I can do with the VPS.
Test On the VPS
As mentioned above, the VPS that I have purchased has 256MB of RAM, 8GB of storage and 250 GB of monthly traffic, and the server is located in Montreal, Quebec, Canada. As usual, I have installed Debian 6 32 bit for testing purposes.
With the fresh installation, 15MB of RAM was used, which is pretty standard:
free -m
             total       used       free     shared    buffers     cached
Mem:           247         70        177          0         17         38
-/+ buffers/cache:         15        232
Swap:          486          0        486
And the top output showing the processes running:
top - 00:01:53 up 1 day, 41 min,  1 user,  load average: 0.00, 0.00, 0.00
Tasks:  47 total,   1 running,  46 sleeping,   0 stopped,   0 zombie
Cpu(s):  0.0%us,  0.0%sy,  0.0%ni,100.0%id,  0.0%wa,  0.0%hi,  0.0%si,  0.0%st
Mem:    253900k total,    72704k used,   181196k free,    17624k buffers
Swap:   498680k total,        0k used,   498680k free,    39212k cached

  PID USER      PR  NI  VIRT  RES  SHR S %CPU %MEM    TIME+  COMMAND
 1597 root      20   0  8260 2848 2324 S  0.0  1.1   0:00.13 sshd
 1601 root      20   0  4416 2832 1436 S  0.0  1.1   0:00.22 bash
  529 root      20   0 27304 1464 1024 S  0.0  0.6   0:00.07 rsyslogd
 1616 root      20   0  2336 1092  876 R  0.5  0.4   0:00.01 top
  705 root      20   0  5496  972  580 S  0.0  0.4   0:00.38 sshd
  838 Debian-e  20   0  6516  924  612 S  0.0  0.4   0:00.05 exim4
  425 statd     20   0  1940  792  656 S  0.0  0.3   0:00.00 rpc.statd
  620 root      20   0  2640  768  600 S  0.0  0.3   0:00.14 cron
  145 root      16  -4  2260  736  392 S  0.0  0.3   0:00.02 udevd
    1 root      20   0  2036  688  588 S  0.0  0.3   0:01.39 init
  185 root      18  -2  2256  636  296 S  0.0  0.3   0:00.00 udevd
  186 root      18  -2  2256  580  240 S  0.0  0.2   0:00.00 udevd
  856 root      20   0  1708  536  460 S  0.0  0.2   0:00.00 getty
  859 root      20   0  1708  536  456 S  0.0  0.2   0:00.00 getty
  860 root      20   0  1708  536  456 S  0.0  0.2   0:00.00 getty
  862 root      20   0  1708  536  456 S  0.0  0.2   0:00.00 getty
  857 root      20   0  1708  532  456 S  0.0  0.2   0:00.00 getty
As well as the htop output:
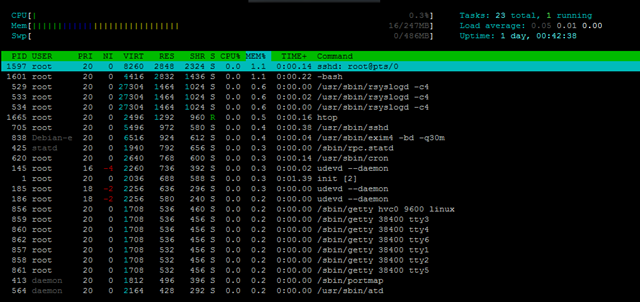
A fresh installation of the OS takes more than 700MB of hard drive space, which is again a pretty standard set up for Debian 6:
 df -h
Filesystem            Size  Used Avail Use% Mounted on
/dev/xvda1            7.5G  722M  6.4G  11% /
tmpfs                 124M     0  124M   0% /lib/init/rw
udev                  114M   64K  114M   1% /dev
tmpfs                 124M     0  124M   0% /dev/shm
The INodes values are set to a little low though:
df -i
Filesystem            Inodes   IUsed   IFree IUse% Mounted on
/dev/xvda1            493856   29625  464231    6% /
tmpfs                  31737       5   31732    1% /lib/init/rw
udev                   29088     438   28650    2% /dev
tmpfs                  31737       1   31736    1% /dev/shm
With the LNMP stack installed, 36MB of RAM was used:
 free -m
             total       used       free     shared    buffers     cached
Mem:           247        241          6          0          8        196
-/+ buffers/cache:         36        211
Swap:          486          0        486
Here is the top output showing the LNMP stack running:
top - 13:52:39 up 1 day,  1:31,  1 user,  load average: 0.33, 0.84, 0.81
Tasks:  57 total,   1 running,  56 sleeping,   0 stopped,   0 zombie
Cpu(s):  0.0%us,  0.4%sy,  0.0%ni, 99.6%id,  0.0%wa,  0.0%hi,  0.0%si,  0.0%st
Mem:    253900k total,   247888k used,     6012k free,     8816k buffers
Swap:   498680k total,      772k used,   497908k free,   201308k cached

  PID USER      PR  NI  VIRT  RES  SHR S %CPU %MEM    TIME+  COMMAND
29400 www       20   0 15008  10m  436 S  0.0  4.4   0:00.01 nginx
29390 root      20   0 22968 4540 1384 S  0.0  1.8   0:00.03 php-cgi
 9439 mysql     20   0 33944 4528 1924 S  0.0  1.8   0:00.01 mysqld
29391 www       20   0 22968 4148  992 S  0.0  1.6   0:00.00 php-cgi
29392 www       20   0 22968 4148  992 S  0.0  1.6   0:00.00 php-cgi
29393 www       20   0 22968 4148  992 S  0.0  1.6   0:00.00 php-cgi
29394 www       20   0 22968 4148  992 S  0.0  1.6   0:00.00 php-cgi
29395 www       20   0 22968 4148  992 S  0.0  1.6   0:00.00 php-cgi
31859 root      20   0  4804 3104 1316 S  0.0  1.2   0:00.35 bash
31856 root      20   0  8464 1604  992 S  0.0  0.6   0:01.08 sshd
  529 root      20   0 27304 1304  864 S  0.0  0.5   0:00.07 rsyslogd
29417 root      20   0  2336 1108  880 R  0.8  0.4   0:00.02 top
  705 root      20   0  5496  848  456 S  0.0  0.3   0:00.39 sshd
  838 Debian-e  20   0  6516  780  468 S  0.0  0.3   0:00.05 exim4
29398 root      20   0  4796  744  276 S  0.0  0.3   0:00.00 nginx
  620 root      20   0  2640  724  556 S  0.0  0.3   0:00.15 cron
  425 statd     20   0  1940  576  488 S  0.0  0.2   0:00.00 rpc.statd
And of course the htop output:
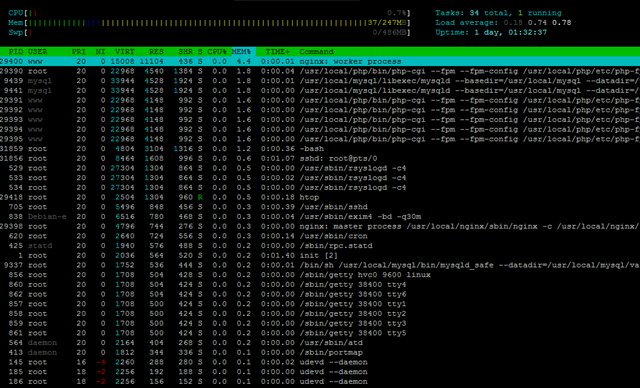
Close to 3GB of hard drive space was used when the LNMP stack is up and running:
 df -h
Filesystem            Size  Used Avail Use% Mounted on
/dev/xvda1            7.5G  2.9G  4.2G  41% /
tmpfs                 124M     0  124M   0% /lib/init/rw
udev                  114M   64K  114M   1% /dev
tmpfs                 124M     0  124M   0% /dev/shm
Uptime shows the VPS is mostly idle:
uptime
 00:04:14 up 1 day, 43 min,  1 user,  load average: 0.02, 0.01, 0.00
Which is also shown in the output of vmstat:
 vmstat
procs -----------memory---------- ---swap-- -----io---- -system-- ----cpu----
 r  b   swpd   free   buff  cache   si   so    bi    bo   in   cs us sy id wa
 0  0      0 181204  17640  39240    0    0     0     0    2    2  0  0 100  0
CPUInfo shows one core is available and it is not throttled:
cat /proc/cpuinfo
processor       : 0
vendor_id       : AuthenticAMD
cpu family      : 16
model           : 9
model name      : AMD Opteron(tm) Processor 6172
stepping        : 1
cpu MHz         : 2100.042
cache size      : 512 KB
fdiv_bug        : no
hlt_bug         : no
f00f_bug        : no
coma_bug        : no
fpu             : yes
fpu_exception   : yes
cpuid level     : 5
wp              : yes
flags           : fpu de tsc msr pae cx8 cmov pat clflush mmx fxsr sse sse2 ht syscall nx mmxext fxsr_opt 3dnowext 3dnow up amd_dcm pni popcnt hypervisor cmp_legacy extapic cr8_legacy abm sse4a misalignsse 3dnowprefetch nodeid_msr
bogomips        : 4200.08
clflush size    : 64
cache_alignment : 64
address sizes   : 48 bits physical, 48 bits virtual
power management: ts ttp tm stc 100mhzsteps hwpstate
And Meminfo does not really seems to show anything interesting, as usual:
cat /proc/meminfo
MemTotal:         253900 kB
MemFree:            7384 kB
Buffers:            8540 kB
Cached:           222384 kB
SwapCached:            0 kB
Active:            20836 kB
Inactive:         214956 kB
Active(anon):       2320 kB
Inactive(anon):     2616 kB
Active(file):      18516 kB
Inactive(file):   212340 kB
Unevictable:           0 kB
Mlocked:               0 kB
HighTotal:             0 kB
HighFree:              0 kB
LowTotal:         253900 kB
LowFree:            7384 kB
SwapTotal:        498680 kB
SwapFree:         498680 kB
Dirty:               520 kB
Writeback:             0 kB
AnonPages:          4868 kB
Mapped:             4120 kB
Shmem:                68 kB
Slab:               8128 kB
SReclaimable:       6268 kB
SUnreclaim:         1860 kB
KernelStack:         384 kB
PageTables:          404 kB
NFS_Unstable:          0 kB
Bounce:                0 kB
WritebackTmp:          0 kB
CommitLimit:      625628 kB
Committed_AS:      37516 kB
VmallocTotal:     598008 kB
VmallocUsed:         784 kB
VmallocChunk:     597092 kB
HardwareCorrupted:     0 kB
HugePages_Total:       0
HugePages_Free:        0
HugePages_Rsvd:        0
HugePages_Surp:        0
Hugepagesize:       2048 kB
DirectMap4k:      262144 kB
DirectMap2M:           0 kB
The disk I/O is really good and both of my tests shows the performance is above 100MB/s:
 dd if=/dev/zero of=test bs=64k count=16k conv=fdatasync
16384+0 records in
16384+0 records out
1073741824 bytes (1.1 GB) copied, 9.36236 s, 115 MB/s
Test again showed really good results as well:
dd if=/dev/zero of=test bs=64k count=16k conv=fdatasync
16384+0 records in
16384+0 records out
1073741824 bytes (1.1 GB) copied, 10.3571 s, 104 MB/s
IOPing results are pretty stable also:
 ioping -c 10 .
4096 bytes from . (ext3 /dev/xvda1): request=1 time=0.4 ms
4096 bytes from . (ext3 /dev/xvda1): request=2 time=0.7 ms
4096 bytes from . (ext3 /dev/xvda1): request=3 time=0.6 ms
4096 bytes from . (ext3 /dev/xvda1): request=4 time=0.7 ms
4096 bytes from . (ext3 /dev/xvda1): request=5 time=1.1 ms
4096 bytes from . (ext3 /dev/xvda1): request=6 time=0.6 ms
4096 bytes from . (ext3 /dev/xvda1): request=7 time=0.6 ms
4096 bytes from . (ext3 /dev/xvda1): request=8 time=0.6 ms
4096 bytes from . (ext3 /dev/xvda1): request=9 time=0.8 ms
4096 bytes from . (ext3 /dev/xvda1): request=10 time=0.6 ms

--- . (ext3 /dev/xvda1) ioping statistics ---
10 requests completed in 9009.0 ms, 1491 iops, 5.8 mb/s
min/avg/max/mdev = 0.4/0.7/1.1/0.2 ms
And test again showed similar results:
ioping -c 10 .
4096 bytes from . (ext3 /dev/xvda1): request=1 time=0.5 ms
4096 bytes from . (ext3 /dev/xvda1): request=2 time=0.7 ms
4096 bytes from . (ext3 /dev/xvda1): request=3 time=0.7 ms
4096 bytes from . (ext3 /dev/xvda1): request=4 time=0.9 ms
4096 bytes from . (ext3 /dev/xvda1): request=5 time=0.6 ms
4096 bytes from . (ext3 /dev/xvda1): request=6 time=0.5 ms
4096 bytes from . (ext3 /dev/xvda1): request=7 time=0.6 ms
4096 bytes from . (ext3 /dev/xvda1): request=8 time=0.6 ms
4096 bytes from . (ext3 /dev/xvda1): request=9 time=1.0 ms
4096 bytes from . (ext3 /dev/xvda1): request=10 time=0.5 ms

--- . (ext3 /dev/xvda1) ioping statistics ---
10 requests completed in 9008.9 ms, 1499 iops, 5.9 mb/s
min/avg/max/mdev = 0.5/0.7/1.0/0.2 ms
The network is also pretty good, with the download test from Cachefly scored close to 10MB/s:
 wget cachefly.cachefly.net/100mb.test -O /dev/null
--2011-12-26 00:05:00--  http://cachefly.cachefly.net/100mb.test
Resolving cachefly.cachefly.net... 205.234.175.175
Connecting to cachefly.cachefly.net|205.234.175.175|:80... connected.
HTTP request sent, awaiting response... 200 OK
Length: 104857600 (100M) [application/octet-stream]
Saving to: "/dev/null"

100%[======================================>] 104,857,600 9.85M/s   in 10s

2011-12-26 00:05:11 (9.82 MB/s) - "/dev/null" saved [104857600/104857600]
Test again showed slightly worse results, but is nontheless respectable, particularly since it is on a 100Mbps port:
wget cachefly.cachefly.net/100mb.test -O /dev/null
--2011-12-26 00:09:12--  http://cachefly.cachefly.net/100mb.test
Resolving cachefly.cachefly.net... 205.234.175.175
Connecting to cachefly.cachefly.net|205.234.175.175|:80... connected.
HTTP request sent, awaiting response... 200 OK
Length: 104857600 (100M) [application/octet-stream]
Saving to: "/dev/null"

100%[======================================>] 104,857,600 8.52M/s   in 11s

2011-12-26 00:09:23 (8.73 MB/s) - "/dev/null" saved [104857600/104857600]
The upload speed is obviously a little slower than the download speed, but is nontheless pretty good:
From my VPS in BuffaloVPS in Chicago, IL:
 wget 205.204.72.140/100mb.test -O /dev/null
--2011-12-26 01:03:32--  http://205.204.72.140/100mb.test
Connecting to 205.204.72.140:80... connected.
HTTP request sent, awaiting response... 200 OK
Length: 104857600 (100M) [application/octet-stream]
Saving to: `/dev/null'

100%[======================================>] 104,857,600 8.48M/s   in 16s

2011-12-26 01:03:47 (6.43 MB/s) - `/dev/null' saved [104857600/104857600]
From my BuyVM VPS in San Jose, CA:
wget 205.204.72.140/100mb.test -O /dev/null
--2011-12-26 01:09:30--  http://205.204.72.140/100mb.test
Connecting to 205.204.72.140:80... connected.
HTTP request sent, awaiting response... 200 OK
Length: 104857600 (100M) [application/octet-stream]
Saving to: `/dev/null'

100%[======================================>] 104,857,600 5.41M/s   in 23s

2011-12-26 01:09:54 (4.31 MB/s) - `/dev/null' saved [104857600/104857600]
And finally, from the Quickweb VPS in London, UK:
 wget 205.204.72.140/100mb.test -O /dev/null
--2011-12-26 01:03:05--  http://205.204.72.140/100mb.test
Connecting to 205.204.72.140:80... connected.
HTTP request sent, awaiting response... 200 OK
Length: 104857600 (100M) [application/octet-stream]
Saving to: `/dev/null'

100%[======================================>] 104,857,600 5.00M/s   in 16s

2011-12-26 01:03:22 (6.17 MB/s) - `/dev/null' saved [104857600/104857600]
Finally, the benchmark time. I do not have a really high expectation with the VPS on the Benchmark scores, since it has only 1 CPU core available. Indeed, with the UnixBench, I was only able to get a little more than 400 points:
   #    #  #    #  #  #    #          #####   ######  #    #   ####   #    #
   #    #  ##   #  #   #  #           #    #  #       ##   #  #    #  #    #
   #    #  # #  #  #    ##            #####   #####   # #  #  #       ######
   #    #  #  # #  #    ##            #    #  #       #  # #  #       #    #
   #    #  #   ##  #   #  #           #    #  #       #   ##  #    #  #    #
    ####   #    #  #  #    #          #####   ######  #    #   ####   #    #

   Version 5.1.3                      Based on the Byte Magazine Unix Benchmark

   Multi-CPU version                  Version 5 revisions by Ian Smith,
                                      Sunnyvale, CA, USA
   January 13, 2011                   johantheghost at yahoo period com

1 x Dhrystone 2 using register variables  1 2 3 4 5 6 7 8 9 10

1 x Double-Precision Whetstone  1 2 3 4 5 6 7 8 9 10

1 x Execl Throughput  1 2 3

1 x File Copy 1024 bufsize 2000 maxblocks  1 2 3

1 x File Copy 256 bufsize 500 maxblocks  1 2 3

1 x File Copy 4096 bufsize 8000 maxblocks  1 2 3

1 x Pipe Throughput  1 2 3 4 5 6 7 8 9 10

1 x Pipe-based Context Switching  1 2 3 4 5 6 7 8 9 10

1 x Process Creation  1 2 3

1 x System Call Overhead  1 2 3 4 5 6 7 8 9 10

1 x Shell Scripts (1 concurrent)  1 2 3

1 x Shell Scripts (8 concurrent)  1 2 3

========================================================================
   BYTE UNIX Benchmarks (Version 5.1.3)

   System: ******: GNU/Linux
   OS: GNU/Linux -- 2.6.32-5-686-bigmem -- #1 SMP Thu Nov 3 05:12:00 UTC 2011
   Machine: i686 (unknown)
   Language: en_US.utf8 (charmap="ANSI_X3.4-1968", collate="ANSI_X3.4-1968")
   CPU 0: AMD Opteron(tm) Processor 6172 (4200.1 bogomips)
          Hyper-Threading, MMX, AMD MMX, Physical Address Ext, SYSCALL/SYSRET
   14:10:56 up 1 day,  1:50,  1 user,  load average: 0.07, 0.03, 0.23; runlevel 2

------------------------------------------------------------------------
Benchmark Run: Mon Dec 26 2011 14:10:56 - 14:38:50
1 CPU in system; running 1 parallel copy of tests

Dhrystone 2 using register variables        9029284.2 lps   (10.0 s, 7 samples)
Double-Precision Whetstone                     1598.5 MWIPS (9.5 s, 7 samples)
Execl Throughput                               1589.4 lps   (30.0 s, 2 samples)
File Copy 1024 bufsize 2000 maxblocks        307229.7 KBps  (30.0 s, 2 samples)
File Copy 256 bufsize 500 maxblocks           89389.2 KBps  (30.0 s, 2 samples)
File Copy 4096 bufsize 8000 maxblocks        719917.0 KBps  (30.0 s, 2 samples)
Pipe Throughput                              569321.6 lps   (10.0 s, 7 samples)
Pipe-based Context Switching                  60202.0 lps   (10.0 s, 7 samples)
Process Creation                               2621.7 lps   (30.0 s, 2 samples)
Shell Scripts (1 concurrent)                   2845.5 lpm   (60.0 s, 2 samples)
Shell Scripts (8 concurrent)                    367.2 lpm   (60.1 s, 2 samples)
System Call Overhead                         690444.6 lps   (10.0 s, 7 samples)

System Benchmarks Index Values               BASELINE       RESULT    INDEX
Dhrystone 2 using register variables         116700.0    9029284.2    773.7
Double-Precision Whetstone                       55.0       1598.5    290.6
Execl Throughput                                 43.0       1589.4    369.6
File Copy 1024 bufsize 2000 maxblocks          3960.0     307229.7    775.8
File Copy 256 bufsize 500 maxblocks            1655.0      89389.2    540.1
File Copy 4096 bufsize 8000 maxblocks          5800.0     719917.0   1241.2
Pipe Throughput                               12440.0     569321.6    457.7
Pipe-based Context Switching                   4000.0      60202.0    150.5
Process Creation                                126.0       2621.7    208.1
Shell Scripts (1 concurrent)                     42.4       2845.5    671.1
Shell Scripts (8 concurrent)                      6.0        367.2    612.0
System Call Overhead                          15000.0     690444.6    460.3
                                                                   ========
System Benchmarks Index Score                                         470.3
Testing again showed similar results:
   #    #  #    #  #  #    #          #####   ######  #    #   ####   #    #
   #    #  ##   #  #   #  #           #    #  #       ##   #  #    #  #    #
   #    #  # #  #  #    ##            #####   #####   # #  #  #       ######
   #    #  #  # #  #    ##            #    #  #       #  # #  #       #    #
   #    #  #   ##  #   #  #           #    #  #       #   ##  #    #  #    #
    ####   #    #  #  #    #          #####   ######  #    #   ####   #    #

   Version 5.1.3                      Based on the Byte Magazine Unix Benchmark

   Multi-CPU version                  Version 5 revisions by Ian Smith,
                                      Sunnyvale, CA, USA
   January 13, 2011                   johantheghost at yahoo period com

1 x Dhrystone 2 using register variables  1 2 3 4 5 6 7 8 9 10

1 x Double-Precision Whetstone  1 2 3 4 5 6 7 8 9 10

1 x Execl Throughput  1 2 3

1 x File Copy 1024 bufsize 2000 maxblocks  1 2 3

1 x File Copy 256 bufsize 500 maxblocks  1 2 3

1 x File Copy 4096 bufsize 8000 maxblocks  1 2 3

1 x Pipe Throughput  1 2 3 4 5 6 7 8 9 10

1 x Pipe-based Context Switching  1 2 3 4 5 6 7 8 9 10

1 x Process Creation  1 2 3

1 x System Call Overhead  1 2 3 4 5 6 7 8 9 10

1 x Shell Scripts (1 concurrent)  1 2 3

1 x Shell Scripts (8 concurrent)  1 2 3

========================================================================
   BYTE UNIX Benchmarks (Version 5.1.3)

   System: *******: GNU/Linux
   OS: GNU/Linux -- 2.6.32-5-686-bigmem -- #1 SMP Thu Nov 3 05:12:00 UTC 2011
   Machine: i686 (unknown)
   Language: en_US.utf8 (charmap="ANSI_X3.4-1968", collate="ANSI_X3.4-1968")
   CPU 0: AMD Opteron(tm) Processor 6172 (4200.1 bogomips)
          Hyper-Threading, MMX, AMD MMX, Physical Address Ext, SYSCALL/SYSRET
   14:52:28 up 1 day,  2:31,  1 user,  load average: 0.12, 0.48, 0.87; runlevel 2

------------------------------------------------------------------------
Benchmark Run: Mon Dec 26 2011 14:52:28 - 15:21:36
1 CPU in system; running 1 parallel copy of tests

Dhrystone 2 using register variables        8980207.3 lps   (10.0 s, 7 samples)
Double-Precision Whetstone                     1566.3 MWIPS (9.4 s, 7 samples)
Execl Throughput                               1609.4 lps   (29.7 s, 2 samples)
File Copy 1024 bufsize 2000 maxblocks        225500.8 KBps  (30.2 s, 2 samples)
File Copy 256 bufsize 500 maxblocks           71066.0 KBps  (31.1 s, 2 samples)
File Copy 4096 bufsize 8000 maxblocks        325584.2 KBps  (30.6 s, 2 samples)
Pipe Throughput                              541613.0 lps   (10.0 s, 7 samples)
Pipe-based Context Switching                  59875.3 lps   (10.0 s, 7 samples)
Process Creation                               2713.1 lps   (30.0 s, 2 samples)
Shell Scripts (1 concurrent)                   2743.6 lpm   (60.0 s, 2 samples)
Shell Scripts (8 concurrent)                    360.8 lpm   (60.5 s, 2 samples)
System Call Overhead                         701450.0 lps   (10.0 s, 7 samples)

System Benchmarks Index Values               BASELINE       RESULT    INDEX
Dhrystone 2 using register variables         116700.0    8980207.3    769.5
Double-Precision Whetstone                       55.0       1566.3    284.8
Execl Throughput                                 43.0       1609.4    374.3
File Copy 1024 bufsize 2000 maxblocks          3960.0     225500.8    569.4
File Copy 256 bufsize 500 maxblocks            1655.0      71066.0    429.4
File Copy 4096 bufsize 8000 maxblocks          5800.0     325584.2    561.4
Pipe Throughput                               12440.0     541613.0    435.4
Pipe-based Context Switching                   4000.0      59875.3    149.7
Process Creation                                126.0       2713.1    215.3
Shell Scripts (1 concurrent)                     42.4       2743.6    647.1
Shell Scripts (8 concurrent)                      6.0        360.8    601.3
System Call Overhead                          15000.0     701450.0    467.6
                                                                   ========
System Benchmarks Index Score                                         418.4
The GeekBench score is not too bad though:
System Information
  Platform:                  Linux x86 (32-bit)
  Compiler:                  GCC 4.1.2 20070925 (Red Hat 4.1.2-33)
  Operating System:          Linux 2.6.32-5-686-bigmem i686
  Model:                     Linux PC (AMD Opteron(tm) Processor 6172)
  Motherboard:               Unknown Motherboard
  Processor:                 AMD Opteron(tm) Processor 6172
  Processor ID:              AuthenticAMD Family 16 Model 9 Stepping 1
  Logical Processors:        1
  Physical Processors:       1
  Processor Frequency:       2.10 GHz
  L1 Instruction Cache:      64.0 KB
  L1 Data Cache:             64.0 KB
  L2 Cache:                  512 KB
  L3 Cache:                  10.00 MB
  Bus Frequency:             0.00 Hz
  Memory:                    248 MB
  Memory Type:               N/A
  SIMD:                      1
  BIOS:                      N/A
  Processor Model:           AMD Opteron(tm) Processor 6172
  Processor Cores:           1

Integer
  Blowfish
    single-threaded scalar    1519 ||||||
    multi-threaded scalar     1628 ||||||
  Text Compress
    single-threaded scalar    1611 ||||||
    multi-threaded scalar     1564 ||||||
  Text Decompress
    single-threaded scalar    1625 ||||||
    multi-threaded scalar     1665 ||||||
  Image Compress
    single-threaded scalar    1311 |||||
    multi-threaded scalar     1287 |||||
  Image Decompress
    single-threaded scalar    1055 ||||
    multi-threaded scalar     1081 ||||
  Lua
    single-threaded scalar    2284 |||||||||
    multi-threaded scalar     2310 |||||||||

Floating Point
  Mandelbrot
    single-threaded scalar    1486 |||||
    multi-threaded scalar     1509 ||||||
  Dot Product
    single-threaded scalar    2156 ||||||||
    multi-threaded scalar     2284 |||||||||
    single-threaded vector    2021 ||||||||
    multi-threaded vector     2327 |||||||||
  LU Decomposition
    single-threaded scalar    1784 |||||||
    multi-threaded scalar     1818 |||||||
  Primality Test
    single-threaded scalar    2005 ||||||||
    multi-threaded scalar     1667 ||||||
  Sharpen Image
    single-threaded scalar    5511 ||||||||||||||||||||||
    multi-threaded scalar     5565 ||||||||||||||||||||||
  Blur Image
    single-threaded scalar    5967 |||||||||||||||||||||||
    multi-threaded scalar     6001 ||||||||||||||||||||||||

Memory
  Read Sequential
    single-threaded scalar    3020 ||||||||||||
  Write Sequential
    single-threaded scalar    4068 ||||||||||||||||
  Stdlib Allocate
    single-threaded scalar    2246 ||||||||
  Stdlib Write
    single-threaded scalar    1760 |||||||
  Stdlib Copy
    single-threaded scalar    2196 ||||||||

Stream
  Stream Copy
    single-threaded scalar    2752 |||||||||||
    single-threaded vector    3077 ||||||||||||
  Stream Scale
    single-threaded scalar    2842 |||||||||||
    single-threaded vector    2988 |||||||||||
  Stream Add
    single-threaded scalar    2739 ||||||||||
    single-threaded vector    3057 ||||||||||||
  Stream Triad
    single-threaded scalar    2906 |||||||||||
    single-threaded vector    2262 |||||||||

Integer Score:                1578 ||||||
Floating Point Score:         3007 ||||||||||||
Memory Score:                 2658 ||||||||||
Stream Score:                 2827 |||||||||||

Overall Geekbench Score:      2419 |||||||||
Testing again showed similar results:
System Information
  Platform:                  Linux x86 (32-bit)
  Compiler:                  GCC 4.1.2 20070925 (Red Hat 4.1.2-33)
  Operating System:          Linux 2.6.32-5-686-bigmem i686
  Model:                     Linux PC (AMD Opteron(tm) Processor 6172)
  Motherboard:               Unknown Motherboard
  Processor:                 AMD Opteron(tm) Processor 6172
  Processor ID:              AuthenticAMD Family 16 Model 9 Stepping 1
  Logical Processors:        1
  Physical Processors:       1
  Processor Frequency:       2.10 GHz
  L1 Instruction Cache:      64.0 KB
  L1 Data Cache:             64.0 KB
  L2 Cache:                  512 KB
  L3 Cache:                  10.00 MB
  Bus Frequency:             0.00 Hz
  Memory:                    248 MB
  Memory Type:               N/A
  SIMD:                      1
  BIOS:                      N/A
  Processor Model:           AMD Opteron(tm) Processor 6172
  Processor Cores:           1

Integer
  Blowfish
    single-threaded scalar    1521 ||||||
    multi-threaded scalar     1629 ||||||
  Text Compress
    single-threaded scalar    1610 ||||||
    multi-threaded scalar     1563 ||||||
  Text Decompress
    single-threaded scalar    1626 ||||||
    multi-threaded scalar     1664 ||||||
  Image Compress
    single-threaded scalar    1311 |||||
    multi-threaded scalar     1290 |||||
  Image Decompress
    single-threaded scalar    1054 ||||
    multi-threaded scalar     1080 ||||
  Lua
    single-threaded scalar    2298 |||||||||
    multi-threaded scalar     2309 |||||||||

Floating Point
  Mandelbrot
    single-threaded scalar    1486 |||||
    multi-threaded scalar     1509 ||||||
  Dot Product
    single-threaded scalar    2157 ||||||||
    multi-threaded scalar     2285 |||||||||
    single-threaded vector    2020 ||||||||
    multi-threaded vector     2327 |||||||||
  LU Decomposition
    single-threaded scalar    1786 |||||||
    multi-threaded scalar     1818 |||||||
  Primality Test
    single-threaded scalar    2081 ||||||||
    multi-threaded scalar     1668 ||||||
  Sharpen Image
    single-threaded scalar    5513 ||||||||||||||||||||||
    multi-threaded scalar     5574 ||||||||||||||||||||||
  Blur Image
    single-threaded scalar    5972 |||||||||||||||||||||||
    multi-threaded scalar     6004 ||||||||||||||||||||||||

Memory
  Read Sequential
    single-threaded scalar    3027 ||||||||||||
  Write Sequential
    single-threaded scalar    4069 ||||||||||||||||
  Stdlib Allocate
    single-threaded scalar    2250 |||||||||
  Stdlib Write
    single-threaded scalar    1764 |||||||
  Stdlib Copy
    single-threaded scalar    2162 ||||||||

Stream
  Stream Copy
    single-threaded scalar    2786 |||||||||||
    single-threaded vector    3120 ||||||||||||
  Stream Scale
    single-threaded scalar    2824 |||||||||||
    single-threaded vector    3041 ||||||||||||
  Stream Add
    single-threaded scalar    2733 ||||||||||
    single-threaded vector    3030 ||||||||||||
  Stream Triad
    single-threaded scalar    2886 |||||||||||
    single-threaded vector    2204 ||||||||

Integer Score:                1579 ||||||
Floating Point Score:         3014 ||||||||||||
Memory Score:                 2654 ||||||||||
Stream Score:                 2828 |||||||||||

Overall Geekbench Score:      2421 |||||||||
Customer Service and Support
I did not have a very high expectation on the technical support team when I signed up for the VPS, to be honest, it was Christmas Eve and I know how important it is to people living in North America. In fact, I was hoping that if I can get a reply by the end of Boxing Day, I would be a happy man. However, Servarica surprised me with how fast their response was. One of my tickets was responded within half an hour on the Christmas Eve at 11pm and another tickets created a few minutes later was responded at the same time. In that regards, I got to say the support was really quick and efficient.
Conclusion
I was a little uncomfortable when I first saw the price tag of Servarica VPS, since many providers has offered VPS with similar specifications at a fraction of the cost. However, during the period of review, I am impressed with the performance of the VPS in general, particularly in both disk I/O and the network speed. The support is pretty fast as well, even during Christmas Eve, which is another impressive aspect. Although lack of control panel could potentially a drawback, but I do not see it as a showstopper for most of us. Therefore, I would recommend this VPS to everyone who is considering spending a little more to get a more stable Xen VPS.
Finally, I would like to wish everyone a Merry Christmas and Happy New Year! Have a good time with family and friends and have fun shopping on Boxing Day for those living in Canada!
Pingback: 96MB Low End VPS Review Part XXXIX – Kazila | | 96MB.com96MB.com
Hi,
I just wanted to chime in. I’ve been a Servarica customer for 3 weeks and counting now and everything is going extremely well. The speed is as advertised and nothing is oversold. The server is extremely stable.
I couldn’t be happier with the support I’ve gotten from Hani. He’s very knowledgeable and very easy to talk to.
I’d just like to confirm that the SolusVM control panel is now ready (I’ve been migrated to it) so any new customers or existing customers can ask for it. The migration was rather painless when mine was done with very little down time.
Thanks for the very detailed and thorough review above, you convinced me to at the very least give Servarica a shot and I don’t regret it one bit.
@Marc: Really happy to hear about your experience, and I am really glad that SolusVM is up and running too!
Hi,
I just wanted to check in again for anyone who was still uncertain about Servarica. I’ve now been with them for 4 months and it’s working great. I’m very happy with them and it’s as stable as can be. I now have 2 game servers, a voice server, mail server and web server. No issues whatsoever. If anyone is still having doubts, give them a shot :).
@Marc: Glad you are still happy with them, and all the best to servaRICA!
They aren’t bad but they only peer with Cogent and Nlayer. Which defeats almost everything they talk about in their faq
* The advantage of this location is that we are so close to US market while we are not under the same laws as the US providers (e.g: PRISM, Tempora and patriot act)
@sadly: Agreed, although I think apparently PRISM is everywhere, whether you are in US or Europe. 🙂