
96MB Low End VPS Review Part XXXIII – SSD Nodes
Matt from SSD Nodes has dropped me a message on Webhostingtalk over a month ago asking for a review on their product and although he has encouraged me to try out a VPS using SSD on the root partition, I have decided to keep up with the spirit of choosing selecting a standard LEB offer where possible and ended up choosing the small plan that is almost the same as what is advertised on LEB, with a slight modification (but at the same cost), and we’ll take a look at how this box performs.
General Information and Set Up
As per the advertisement on LEB, here is what you will be getting for 6.99 per month:

However, while reading through the comments section, I have noticed that Matt has posted a comment that we can use SSD as a secondary storage at no additional cost, and that is what I have decided to give it a shot.
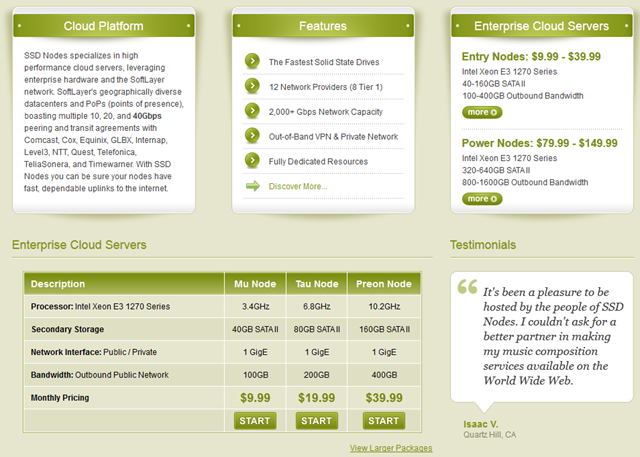
The word “cloud” and “SSD” are definitely some of the key words on their webpage:
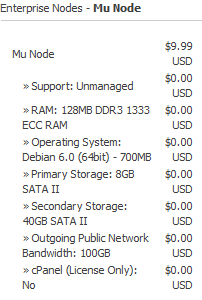
Once the START button is clicked, the default price and configuration are displayed on the right hand side of the order page:
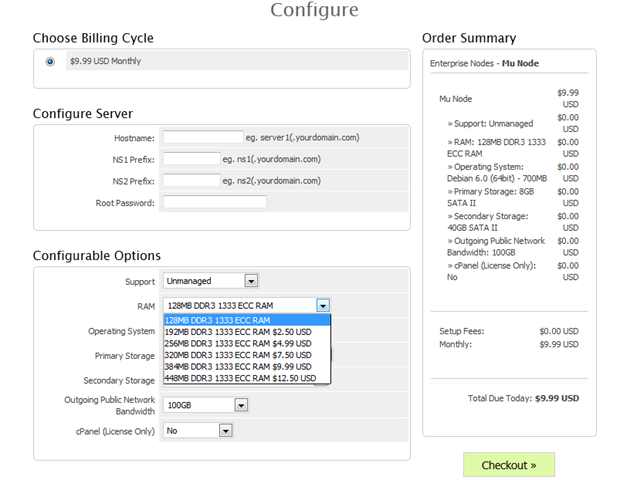
There are quite a few configurable options available on WHMCS, starting with the management option (which I think most of the LEB fans would not even want that :)). You can then add more RAMS to the package if desired. The RAM used here is pretty high end, which, of course, comes with a pretty high price as well:
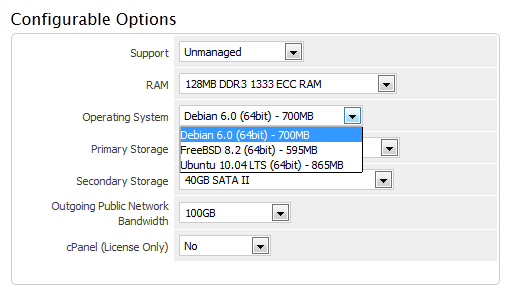
There are very limited options available for the initial OS installations, however I was being told that all templates are built from scratch and they can pretty much install any Linux distributions. Although, I have to say I was pretty amazed when I did not see CentOS distributions available, how could CPanel be installed in that case?
There are two options available for primary storage, either 8GB of SATA II (default) or 8GB of SATA III SSD (at a much higher cost though):

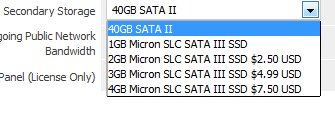
As per Matt’s comment on LEB, they have recently made 1GB SSD free as a secondary storage device, if you are willing to give up 40GB of SATA II hard drive for secondary storage. For each GB of storage, it cost approximately 2.50USD. However, considering it is a SATA III SSD, it could be worthwhile:
There is only 100GB of bandwidth included, which I have to say is not exactly that generous. Extra bandwidth cost 10USD per 100GB:

The highlight in the pricing is really their cPanel license, which cost only 9.99USD, a lot lower than the “standard” CPanel for VPS would cost (around 15USD per month):

There were actually some payment issue that I have had while trying to pay for the invoice, for some reason the invoice has only Subscribe option available (compared to both One Time Payment and Subscribe options that you will normally see in the invoices) and even when I tried to subscribe to the payment plan, the payment would not go through for some reason, instead, I ended up seeing an error message that says: You must add funds to your PayPal account before sending more money. I had to raise a ticket to SSD nodes for the payment issue, which was responded within 5 minutes (ticket raised on a Friday at 12:49PM, responded at 12:54PM).
I have received my invoice payment confirmation email at the same time with my VPS information. However I do not think it is instant provision. The welcome email is pretty unique:

As you can see, there is no link to the control panels but instead a link to SSL VPN, which made me wondering for a while why that is the case before I hit the last few lines (there is also very good documentation in their knowledgebase as well).
Basically, the SSH in VPS, by default, only listens to the internal address. Therefore, you can not access the VPS from external network unless you have the VPN connection first. Although I can definitely see it as a security benefit, for some reason my VPN connection using Softlayer basically gets disconnected once every 2 minutes if I am running it from Firefox (although it runs fine when I am using Internet Explorer), which did gave me a few moments of headaches. SSD Nodes has also mentioned you can get this setting changed by submitting a ticket, which is great.
There is currently no control panel available for them and if you log in to the WHMCS system, you do not see anything that can be used to control the VPS:
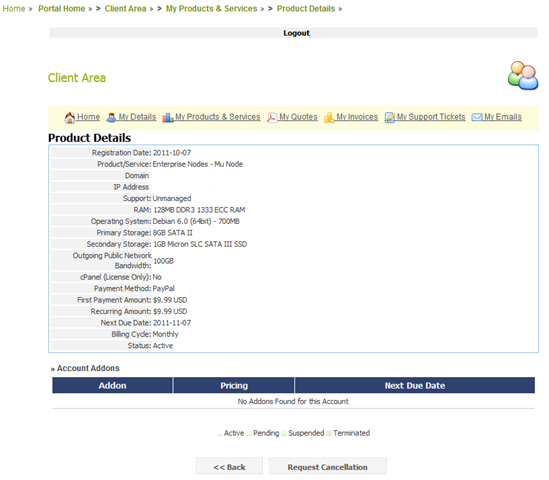
Therefore, you will need to send in a ticket for everything from changing root password to reload OS templates. From what James in SSD Nodes have told me, the infrastructure is “highly customized” and they will develop an entirely in-house control panel, which Matt has promised me it would be a top priority. However, until then, everything is handled via tickets and James believes it also added the “human” element of the services.
Test on the VPS
As mentioned above, the VPS that I have received for testing has 128MB of RAM, 8GB of SATA II hard drive as primary storage and 1GB of SATA III as secondary storage. The VPS is in Softlayer’s data centre in Dallas, Texas, and initially I have ordered Debian 6 64 bit, and actually submitted a ticket later on to get Debian 6 32 bit loaded into the VPS so that I can use the free version of GeekBench. To my pleasant surprise, instead of bringing my VPS offline for hours while they install the OS, he has actually offered to install the OS on a brand new VPS and then reassign my IP address so there won’t be any down time for the VPS. Although I do not actually need that kind of availability, I truly appreciate the thoughts that they have put in.
Initially, the 64 bit OS was installed:
uname -a
Linux ****** 2.6.32-5-amd64 #1 SMP Wed May 18 23:13:22 UTC 2011 x86_64 GNU/Linux
With this OS installed, about 26MB of RAM was used after the fresh installation:
free -m
             total       used       free     shared    buffers     cached
Mem:           119         94         24          0          3         63
-/+ buffers/cache:         26         92
Swap:          382          0        382
The top output showing the running processes:
top - 09:47:50 up  8:28,  4 users,  load average: 0.01, 0.01, 0.00
Tasks:  57 total,   1 running,  56 sleeping,   0 stopped,   0 zombie
Cpu(s):  0.0%us,  0.0%sy,  0.0%ni,100.0%id,  0.0%wa,  0.0%hi,  0.0%si,  0.0%st
Mem:    121868k total,    97100k used,    24768k free,     4056k buffers
Swap:   392184k total,      324k used,   391860k free,    65320k cached

  PID USER      PR  NI  VIRT  RES  SHR S %CPU %MEM    TIME+  COMMAND
20387 root      20   0 20564 3328 1504 S  0.0  2.7   0:00.10 bash
19970 root      20   0 70580 3324 2520 S  0.0  2.7   0:00.03 sshd
20385 root      20   0 70488 3236 2532 S  0.0  2.7   0:00.04 sshd
20112 root      20   0 70488 3228 2520 S  0.0  2.6   0:00.02 sshd
20207 root      20   0 70488 3224 2520 S  0.0  2.6   0:00.02 sshd
20210 root      20   0 20492 3164 1412 S  0.0  2.6   0:00.10 bash
20115 root      20   0 20492 3152 1404 S  0.0  2.6   0:00.09 bash
19973 root      20   0 20492 3148 1400 S  0.0  2.6   0:00.10 bash
20844 root      20   0 19032 1284 1000 R  0.3  1.1   0:00.02 top
  915 root      20   0  9096 1268 1052 S  0.0  1.0   0:00.29 xe-daemon
  600 root      20   0 54156 1216  744 S  0.0  1.0   0:00.01 rsyslogd
20347 root      20   0 49168 1140  584 S  0.0  0.9   0:00.00 sshd
  994 Debian-e  20   0 44144 1040  656 S  0.0  0.9   0:00.00 exim4
  649 root      20   0 22392  860  652 S  0.0  0.7   0:00.02 cron
  498 statd     20   0 14376  736  588 S  0.0  0.6   0:00.00 rpc.statd
    1 root      20   0  8352  684  628 S  0.0  0.6   0:00.29 init
  150 root      16  -4 16736  648  340 S  0.0  0.5   0:00.02 udevd
And close to 700MB of hard drive space was used:
 df -h
Filesystem            Size  Used Avail Use% Mounted on
/dev/xvda1            7.6G  689M  6.5G  10% /
tmpfs                  60M     0   60M   0% /lib/init/rw
udev                   47M   76K   47M   1% /dev
tmpfs                  60M     0   60M   0% /dev/shm
/dev/xvdb            1008M   34M  924M   4% /disk1
After the LNMP stack was installed, 44MB of RAM was used:
 free -m
             total       used       free     shared    buffers     cached
Mem:           119        115          3          0          4         66
-/+ buffers/cache:         44         74
Swap:          382         14        368
And again, the corresponding top output:
top - 10:19:17 up  9:00,  3 users,  load average: 0.02, 0.49, 0.60
Tasks:  65 total,   1 running,  64 sleeping,   0 stopped,   0 zombie
Cpu(s):  0.0%us,  0.0%sy,  0.0%ni, 89.9%id, 10.1%wa,  0.0%hi,  0.0%si,  0.0%st
Mem:    121868k total,   119220k used,     2648k free,     3964k buffers
Swap:   392184k total,    14940k used,   377244k free,    68688k cached

  PID USER      PR  NI  VIRT  RES  SHR S %CPU %MEM    TIME+  COMMAND
26482 www       20   0 47020  19m  436 S  0.0 16.7   0:00.01 nginx
26470 root      20   0  106m 5608 1308 S  0.0  4.6   0:00.03 php-cgi
26472 www       20   0  106m 5168  868 S  0.0  4.2   0:00.00 php-cgi
26473 www       20   0  106m 5168  868 S  0.0  4.2   0:00.00 php-cgi
26474 www       20   0  106m 5168  868 S  0.0  4.2   0:00.00 php-cgi
26476 www       20   0  106m 5168  868 S  0.0  4.2   0:00.00 php-cgi
26477 www       20   0  106m 5168  868 S  0.0  4.2   0:00.00 php-cgi
26662 root      20   0 19040 1292 1000 R  0.0  1.1   0:00.00 top
26480 root      20   0 27808  948  268 S  0.0  0.8   0:00.00 nginx
20387 root      20   0 20564  928  576 S  0.0  0.8   0:00.11 bash
  600 root      20   0 54156  660  424 S  0.0  0.5   0:00.01 rsyslogd
  915 root      20   0  9096  528  388 S  0.0  0.4   0:00.31 xe-daemon
26658 root      20   0  3868  504  420 S  0.0  0.4   0:00.00 sleep
20385 root      20   0 70488  336  204 S  0.0  0.3   0:00.63 sshd
  649 root      20   0 22392  180  116 S  0.0  0.1   0:00.03 cron
  994 Debian-e  20   0 44144  124   60 S  0.0  0.1   0:00.00 exim4
    1 root      20   0  8352   88   56 S  0.0  0.1   0:00.32 init
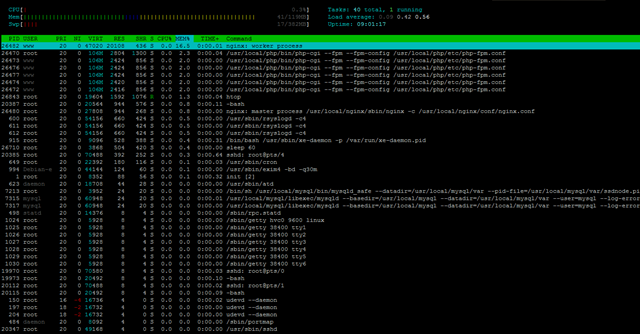
As well as the htop output for the htop fans:
And 2.1GB of hard drive space was used:
df -h
Filesystem            Size  Used Avail Use% Mounted on
/dev/xvda1            7.6G  2.1G  5.1G  30% /
tmpfs                  60M     0   60M   0% /lib/init/rw
udev                   47M   76K   47M   1% /dev
tmpfs                  60M     0   60M   0% /dev/shm
/dev/xvdb            1008M   34M  924M   4% /disk1
Note that here, you can also see the 1GB SSD space was mounted as /disk1 on the VPS.
Inodes are set to pretty low level, therefore it might not be suitable if you have too many small files:
 df -i
Filesystem            Inodes   IUsed   IFree IUse% Mounted on
/dev/xvda1            499712   74122  425590   15% /
tmpfs                  15233       5   15228    1% /lib/init/rw
udev                   11889     454   11435    4% /dev
tmpfs                  15233       1   15232    1% /dev/shm
/dev/xvdb              65536      11   65525    1% /disk1
VMStat output taken right after the LNMP stack installation shows some usage on the CPU:
 vmstat
procs -----------memory---------- ---swap-- -----io---- -system-- ----cpu----
 r  b   swpd   free   buff  cache   si   so    bi    bo   in   cs us sy id wa
 0  0  17932  25504   5084  49280    5    6    37    53   13   25  1  0 98  1
As well as the uptime output:
 uptime
 10:22:02 up  9:02,  3 users,  load average: 0.01, 0.30, 0.50
However, I believe it is just caused by the high CPU usage during the installation.
There is one single CPU core available and does not appear to be throttled:
 cat /proc/cpuinfo
processor       : 0
vendor_id       : GenuineIntel
cpu family      : 6
model           : 42
model name      : Intel(R) Xeon(R) CPU E31270 @ 3.40GHz
stepping        : 7
cpu MHz         : 3392.294
cache size      : 8192 KB
fpu             : yes
fpu_exception   : yes
cpuid level     : 13
wp              : yes
flags           : fpu de tsc msr pae cx8 sep cmov pat clflush mmx fxsr sse sse2 ss ht syscall nx lm constant_tsc up rep_good nonstop_tsc pni pclmulqdq ssse3 cx16 sse4_1 sse4_2 x2apic popcnt avx hypervisor lahf_lm
bogomips        : 6784.58
clflush size    : 64
cache_alignment : 64
address sizes   : 36 bits physical, 48 bits virtual
power management:
And the results of meminfo:
cat /proc/meminfo
MemTotal:         121868 kB
MemFree:           63188 kB
Buffers:            3556 kB
Cached:            13612 kB
SwapCached:         3268 kB
Active:            17520 kB
Inactive:          25420 kB
Active(anon):       1008 kB
Inactive(anon):    24768 kB
Active(file):      16512 kB
Inactive(file):      652 kB
Unevictable:           0 kB
Mlocked:               0 kB
SwapTotal:        392184 kB
SwapFree:         373104 kB
Dirty:                 0 kB
Writeback:             0 kB
AnonPages:         23076 kB
Mapped:             2136 kB
Shmem:                 4 kB
Slab:               8840 kB
SReclaimable:       5088 kB
SUnreclaim:         3752 kB
KernelStack:         536 kB
PageTables:         3196 kB
NFS_Unstable:          0 kB
Bounce:                0 kB
WritebackTmp:          0 kB
CommitLimit:      453116 kB
Committed_AS:     130608 kB
VmallocTotal:   34359738367 kB
VmallocUsed:         804 kB
VmallocChunk:   34359737512 kB
HardwareCorrupted:     0 kB
HugePages_Total:       0
HugePages_Free:        0
HugePages_Rsvd:        0
HugePages_Surp:        0
Hugepagesize:       2048 kB
DirectMap4k:      131072 kB
DirectMap2M:           0 kB
As well as time sync:
 time sync

real    0m0.024s
user    0m0.004s
sys     0m0.000s
Matt was really keen to ask me to test out the disk I/O on SSD, which, obviously, is a big selling point to them. So here is goes:
dd if=/dev/zero of=test bs=64k count=16k conv=fdatasync
dd: writing `test': No space left on device
15595+0 records in
15594+0 records out
1021976576 bytes (1.0 GB) copied, 4.94472 s, 207 MB/s
Test again showed very impressive results again as well:
 dd if=/dev/zero of=test bs=64k count=16k conv=fdatasync
dd: writing `test': No space left on device
15558+0 records in
15557+0 records out
1019564032 bytes (1.0 GB) copied, 3.98608 s, 256 MB/s
As you can see, the SSD disk I/O easily beat most of the disk I/O speed. I have also done several iopings just to see how things goes:
 ioping -c 10 /disk1/test
4096 bytes from /disk1/test (ext4 /dev/xvdb): request=1 time=0.5 ms
4096 bytes from /disk1/test (ext4 /dev/xvdb): request=2 time=0.5 ms
4096 bytes from /disk1/test (ext4 /dev/xvdb): request=3 time=0.3 ms
4096 bytes from /disk1/test (ext4 /dev/xvdb): request=4 time=0.5 ms
4096 bytes from /disk1/test (ext4 /dev/xvdb): request=5 time=0.5 ms
4096 bytes from /disk1/test (ext4 /dev/xvdb): request=6 time=0.4 ms
4096 bytes from /disk1/test (ext4 /dev/xvdb): request=7 time=0.4 ms
4096 bytes from /disk1/test (ext4 /dev/xvdb): request=8 time=0.5 ms
4096 bytes from /disk1/test (ext4 /dev/xvdb): request=9 time=0.5 ms
4096 bytes from /disk1/test (ext4 /dev/xvdb): request=10 time=0.5 ms

--- /disk1/test (ext4 /dev/xvdb) ioping statistics ---
10 requests completed in 9033.9 ms, 2163 iops, 8.4 mb/s
min/avg/max/mdev = 0.3/0.5/0.5/0.1 ms
And of course, test again:
ioping -c 10 /disk1/test
4096 bytes from /disk1/test (ext4 /dev/xvdb): request=1 time=0.4 ms
4096 bytes from /disk1/test (ext4 /dev/xvdb): request=2 time=0.5 ms
4096 bytes from /disk1/test (ext4 /dev/xvdb): request=3 time=0.5 ms
4096 bytes from /disk1/test (ext4 /dev/xvdb): request=4 time=0.5 ms
4096 bytes from /disk1/test (ext4 /dev/xvdb): request=5 time=0.5 ms
4096 bytes from /disk1/test (ext4 /dev/xvdb): request=6 time=0.5 ms
4096 bytes from /disk1/test (ext4 /dev/xvdb): request=7 time=0.5 ms
4096 bytes from /disk1/test (ext4 /dev/xvdb): request=8 time=0.4 ms
4096 bytes from /disk1/test (ext4 /dev/xvdb): request=9 time=0.5 ms
4096 bytes from /disk1/test (ext4 /dev/xvdb): request=10 time=0.5 ms

--- /disk1/test (ext4 /dev/xvdb) ioping statistics ---
10 requests completed in 9006.0 ms, 2049 iops, 8.0 mb/s
min/avg/max/mdev = 0.4/0.5/0.5/0.0 ms
However, since majority of the low end VPS users would opt for the SATA III drive simply due to cost reasons, I think it is only fair to test the disk I/O on the SATA III drives as well:
dd if=/dev/zero of=test bs=64k count=16k conv=fdatasync
16384+0 records in
16384+0 records out
1073741824 bytes (1.1 GB) copied, 14.939 s, 71.9 MB/s
And test again:
dd if=/dev/zero of=test bs=64k count=16k conv=fdatasync
16384+0 records in
16384+0 records out
1073741824 bytes (1.1 GB) copied, 18.4207 s, 58.3 MB/s
As you can see, the I/O of SATA III drives are a lot less impressive compare to the SSD drive. However, I can definitely think of some use for a hybrid box like this though. Say for example, if you have a WordPress blog, you can always put the MySQL database, which requires heavy disk I/O, on the SSD drive, and the less I/O intensive tasks, such as PHP children and Nginx workers, on the SATA III drives.
And here are the ioping results for the SATA III drives as well:
ioping -c 10 100mb.test
4096 bytes from 100mb.test (ext3 /dev/disk/by-uuid/898f0159-0540-4ccf-95dc-97aff400b320): request=1 time=14.1 ms
4096 bytes from 100mb.test (ext3 /dev/disk/by-uuid/898f0159-0540-4ccf-95dc-97aff400b320): request=2 time=8.5 ms
4096 bytes from 100mb.test (ext3 /dev/disk/by-uuid/898f0159-0540-4ccf-95dc-97aff400b320): request=3 time=8.8 ms
4096 bytes from 100mb.test (ext3 /dev/disk/by-uuid/898f0159-0540-4ccf-95dc-97aff400b320): request=4 time=6.1 ms
4096 bytes from 100mb.test (ext3 /dev/disk/by-uuid/898f0159-0540-4ccf-95dc-97aff400b320): request=5 time=7.0 ms
4096 bytes from 100mb.test (ext3 /dev/disk/by-uuid/898f0159-0540-4ccf-95dc-97aff400b320): request=6 time=14.0 ms
4096 bytes from 100mb.test (ext3 /dev/disk/by-uuid/898f0159-0540-4ccf-95dc-97aff400b320): request=7 time=4.3 ms
4096 bytes from 100mb.test (ext3 /dev/disk/by-uuid/898f0159-0540-4ccf-95dc-97aff400b320): request=8 time=6.1 ms
4096 bytes from 100mb.test (ext3 /dev/disk/by-uuid/898f0159-0540-4ccf-95dc-97aff400b320): request=9 time=5.1 ms
4096 bytes from 100mb.test (ext3 /dev/disk/by-uuid/898f0159-0540-4ccf-95dc-97aff400b320): request=10 time=0.4 ms

--- 100mb.test (ext3 /dev/disk/by-uuid/898f0159-0540-4ccf-95dc-97aff400b320) ioping statistics ---
10 requests completed in 9075.5 ms, 134 iops, 0.5 mb/s
min/avg/max/mdev = 0.4/7.4/14.1/4.0 ms
And test again:
ioping -c 10 100mb.test
4096 bytes from 100mb.test (ext3 /dev/disk/by-uuid/898f0159-0540-4ccf-95dc-97aff400b320): request=1 time=14.2 ms
4096 bytes from 100mb.test (ext3 /dev/disk/by-uuid/898f0159-0540-4ccf-95dc-97aff400b320): request=2 time=0.4 ms
4096 bytes from 100mb.test (ext3 /dev/disk/by-uuid/898f0159-0540-4ccf-95dc-97aff400b320): request=3 time=7.5 ms
4096 bytes from 100mb.test (ext3 /dev/disk/by-uuid/898f0159-0540-4ccf-95dc-97aff400b320): request=4 time=7.3 ms
4096 bytes from 100mb.test (ext3 /dev/disk/by-uuid/898f0159-0540-4ccf-95dc-97aff400b320): request=5 time=0.4 ms
4096 bytes from 100mb.test (ext3 /dev/disk/by-uuid/898f0159-0540-4ccf-95dc-97aff400b320): request=6 time=8.2 ms
4096 bytes from 100mb.test (ext3 /dev/disk/by-uuid/898f0159-0540-4ccf-95dc-97aff400b320): request=7 time=5.3 ms
4096 bytes from 100mb.test (ext3 /dev/disk/by-uuid/898f0159-0540-4ccf-95dc-97aff400b320): request=8 time=8.8 ms
4096 bytes from 100mb.test (ext3 /dev/disk/by-uuid/898f0159-0540-4ccf-95dc-97aff400b320): request=9 time=3.2 ms
4096 bytes from 100mb.test (ext3 /dev/disk/by-uuid/898f0159-0540-4ccf-95dc-97aff400b320): request=10 time=5.0 ms

--- 100mb.test (ext3 /dev/disk/by-uuid/898f0159-0540-4ccf-95dc-97aff400b320) ioping statistics ---
10 requests completed in 9061.6 ms, 165 iops, 0.6 mb/s
min/avg/max/mdev = 0.4/6.0/14.2/4.0 ms
As you can see, the ioping results are generally in line with the output of dd as well, although I do see (particularly in the second ioping test) some of the loops is a lot faster than the SSD drive, although much less stable.
The network speed is what actually puzzled me, innitially I was testing the download speed without actually have it to write to the disk, hoping to get a better results since disk I/O could take time, and the results is pretty bad:
wget cachefly.cachefly.net/100mb.test -O /dev/null
--2011-10-08 10:37:14--  http://cachefly.cachefly.net/100mb.test
Resolving cachefly.cachefly.net... 205.234.175.175
Connecting to cachefly.cachefly.net|205.234.175.175|:80... connected.
HTTP request sent, awaiting response... 200 OK
Length: 104857600 (100M) [application/octet-stream]
Saving to: a€?/dev/nulla€

100%[======================================>] 104,857,600 4.17M/s   in 24s

2011-10-08 10:37:43 (4.10 MB/s) - a€?/dev/nulla€
I then waited for a bit, hoping there won’t be any caching, before running the wget test again, but this time actually writing to the disk:
 wget cachefly.cachefly.net/100mb.test
--2011-10-08 10:40:20--  http://cachefly.cachefly.net/100mb.test
Resolving cachefly.cachefly.net... 205.234.175.175
Connecting to cachefly.cachefly.net|205.234.175.175|:80... connected.
HTTP request sent, awaiting response... 200 OK
Length: 104857600 (100M) [application/octet-stream]
Saving to: a€?100mb.testa€

100%[======================================>] 104,857,600 40.4M/s   in 2.5s

2011-10-08 10:40:28 (40.4 MB/s) - a€?100mb.testa€
As you can see, although I was expecting the wget results to be worse than what I have before, it is actually the other way round.
Test a few seconds later, again writing to the disk, actually showed me even better results:
wget cachefly.cachefly.net/100mb.test
--2011-10-08 10:40:50--  http://cachefly.cachefly.net/100mb.test
Resolving cachefly.cachefly.net... 205.234.175.175
Connecting to cachefly.cachefly.net|205.234.175.175|:80... connected.
HTTP request sent, awaiting response... 200 OK
Length: 104857600 (100M) [application/octet-stream]
Saving to: a€?100mb.test.1a€

100%[======================================>] 104,857,600 60.4M/s   in 1.7s

2011-10-08 10:40:57 (60.4 MB/s) - a€?100mb.test.1a€
I can certainly see the improvement from the second wget to the third one was due to caching, but why the big difference between first and second wget tests really puzzled me.
Upload speed is pretty low, which was to my surprise, especially considering the VPS is supposed to be on a 1Gbps port. First is the results from my BuffaloVPS in Chicago, IL:
wget 173.193.165.236/100mb.test -O /dev/null
--2011-10-07 22:43:17--  http://173.193.165.236/100mb.test
Connecting to 173.193.165.236:80... connected.
HTTP request sent, awaiting response... 200 OK
Length: 104857600 (100M) [application/octet-stream]
Saving to: `/dev/null'

100%[======================================>] 104,857,600 4.01M/s   in 28s

2011-10-07 22:43:45 (3.62 MB/s) - `/dev/null' saved [104857600/104857600]
Next from BuyVM VPS in San Jose, CA:
 wget 173.193.165.236/100mb.test -O /dev/null
--2011-10-07 22:44:30--  http://173.193.165.236/100mb.test
Connecting to 173.193.165.236:80... connected.
HTTP request sent, awaiting response... 200 OK
Length: 104857600 (100M) [application/octet-stream]
Saving to: `/dev/null'

100%[======================================>] 104,857,600 3.01M/s   in 42s

2011-10-07 22:45:12 (2.38 MB/s) - `/dev/null' saved [104857600/104857600]
And finally from my Quickweb VPS from London, UK:
 wget 173.193.165.236/100mb.test -O /dev/null
--2011-10-07 22:45:58--  http://173.193.165.236/100mb.test
Connecting to 173.193.165.236:80... connected.
HTTP request sent, awaiting response... 200 OK
Length: 104857600 (100M) [application/octet-stream]
Saving to: `/dev/null'

100%[======================================>] 104,857,600 3.22M/s   in 65s

2011-10-07 22:47:04 (1.53 MB/s) - `/dev/null' saved [104857600/104857600]
As you can see, the speed at the east coast is the best, followed by west coast and then Europe.
Finally, the benchmark time. Interestingly, the GeekBench test did not complain about my license, but instead I was caught with another error:
dist/Geekbench-2.2.0-Linux/geekbench_x86_64
Geekbench 2.2.0 : http://www.primatelabs.ca/geekbench/

Geekbench is in tryout mode

Geekbench is limited to running 32-bit benchmarks while in tryout mode.
Please purchase Geekbench to remove all limitations found in tryout mode.

If you would like to purchase Geekbench you can do so online:

        http://store.primatelabs.ca/

If you have already purchased Geekbench, enter your email address and license
key from your email receipt with the following command line:

        dist/Geekbench-2.2.0-Linux/geekbench_x86_64 -r

Run Geekbench as root to gather accurate system information.

Floating point exception
I am not sure if I have ever get Geekbench 2.2 to work, for some reason it is definitely not as VPS-friendly as its predecessor.
The UnixBench, as usual, managed to run properly though:
   #    #  #    #  #  #    #          #####   ######  #    #   ####   #    #
   #    #  ##   #  #   #  #           #    #  #       ##   #  #    #  #    #
   #    #  # #  #  #    ##            #####   #####   # #  #  #       ######
   #    #  #  # #  #    ##            #    #  #       #  # #  #       #    #
   #    #  #   ##  #   #  #           #    #  #       #   ##  #    #  #    #
    ####   #    #  #  #    #          #####   ######  #    #   ####   #    #

   Version 5.1.3                      Based on the Byte Magazine Unix Benchmark

   Multi-CPU version                  Version 5 revisions by Ian Smith,
                                      Sunnyvale, CA, USA
   January 13, 2011                   johantheghost at yahoo period com


1 x Dhrystone 2 using register variables  1 2 3 4 5 6 7 8 9 10

1 x Double-Precision Whetstone  1 2 3 4 5 6 7 8 9 10

1 x Execl Throughput  1 2 3

1 x File Copy 1024 bufsize 2000 maxblocks  1 2 3

1 x File Copy 256 bufsize 500 maxblocks  1 2 3

1 x File Copy 4096 bufsize 8000 maxblocks  1 2 3

1 x Pipe Throughput  1 2 3 4 5 6 7 8 9 10

1 x Pipe-based Context Switching  1 2 3 4 5 6 7 8 9 10

1 x Process Creation  1 2 3

1 x System Call Overhead  1 2 3 4 5 6 7 8 9 10

1 x Shell Scripts (1 concurrent)  1 2 3

1 x Shell Scripts (8 concurrent)  1 2 3

========================================================================
   BYTE UNIX Benchmarks (Version 5.1.3)

   System: : GNU/Linux
   OS: GNU/Linux -- 2.6.32-5-amd64 -- #1 SMP Wed May 18 23:13:22 UTC 2011
   Machine: x86_64 (unknown)
   Language: en_US.utf8 (charmap="UTF-8", collate="UTF-8")
   CPU 0: Intel(R) Xeon(R) CPU E31270 @ 3.40GHz (6784.6 bogomips)
          Hyper-Threading, x86-64, MMX, Physical Address Ext, SYSENTER/SYSEXIT, SYSCALL/SYSRET
   22:58:26 up  9:39,  3 users,  load average: 0.00, 0.01, 0.07; runlevel 2

------------------------------------------------------------------------
Benchmark Run: Fri Oct 07 2011 22:58:26 - 23:26:32
1 CPU in system; running 1 parallel copy of tests

Dhrystone 2 using register variables       36690330.4 lps   (10.0 s, 7 samples)
Double-Precision Whetstone                     4040.7 MWIPS (9.9 s, 7 samples)
Execl Throughput                               2142.7 lps   (30.0 s, 2 samples)
File Copy 1024 bufsize 2000 maxblocks        303524.1 KBps  (30.0 s, 2 samples)
File Copy 256 bufsize 500 maxblocks           77960.9 KBps  (30.0 s, 2 samples)
File Copy 4096 bufsize 8000 maxblocks       1001254.4 KBps  (30.0 s, 2 samples)
Pipe Throughput                              453192.7 lps   (10.0 s, 7 samples)
Pipe-based Context Switching                  91498.0 lps   (10.0 s, 7 samples)
Process Creation                               4305.4 lps   (30.0 s, 2 samples)
Shell Scripts (1 concurrent)                   4552.3 lpm   (60.0 s, 2 samples)
Shell Scripts (8 concurrent)                    597.6 lpm   (60.0 s, 2 samples)
System Call Overhead                         523649.3 lps   (10.0 s, 7 samples)

System Benchmarks Index Values               BASELINE       RESULT    INDEX
Dhrystone 2 using register variables         116700.0   36690330.4   3144.0
Double-Precision Whetstone                       55.0       4040.7    734.7
Execl Throughput                                 43.0       2142.7    498.3
File Copy 1024 bufsize 2000 maxblocks          3960.0     303524.1    766.5
File Copy 256 bufsize 500 maxblocks            1655.0      77960.9    471.1
File Copy 4096 bufsize 8000 maxblocks          5800.0    1001254.4   1726.3
Pipe Throughput                               12440.0     453192.7    364.3
Pipe-based Context Switching                   4000.0      91498.0    228.7
Process Creation                                126.0       4305.4    341.7
Shell Scripts (1 concurrent)                     42.4       4552.3   1073.6
Shell Scripts (8 concurrent)                      6.0        597.6    996.0
System Call Overhead                          15000.0     523649.3    349.1
                                                                   ========
System Benchmarks Index Score                                         666.1
Given the fact that it just have a single core, the UnixBench actually ran really fast (comparing to those 24 core monsters) and I did another run the next morning just to see how things goes:
   #    #  #    #  #  #    #          #####   ######  #    #   ####   #    #
   #    #  ##   #  #   #  #           #    #  #       ##   #  #    #  #    #
   #    #  # #  #  #    ##            #####   #####   # #  #  #       ######
   #    #  #  # #  #    ##            #    #  #       #  # #  #       #    #
   #    #  #   ##  #   #  #           #    #  #       #   ##  #    #  #    #
    ####   #    #  #  #    #          #####   ######  #    #   ####   #    #

   Version 5.1.3                      Based on the Byte Magazine Unix Benchmark

   Multi-CPU version                  Version 5 revisions by Ian Smith,
                                      Sunnyvale, CA, USA
   January 13, 2011                   johantheghost at yahoo period com


1 x Dhrystone 2 using register variables  1 2 3 4 5 6 7 8 9 10

1 x Double-Precision Whetstone  1 2 3 4 5 6 7 8 9 10

1 x Execl Throughput  1 2 3

1 x File Copy 1024 bufsize 2000 maxblocks  1 2 3

1 x File Copy 256 bufsize 500 maxblocks  1 2 3

1 x File Copy 4096 bufsize 8000 maxblocks  1 2 3

1 x Pipe Throughput  1 2 3 4 5 6 7 8 9 10

1 x Pipe-based Context Switching  1 2 3 4 5 6 7 8 9 10

1 x Process Creation  1 2 3

1 x System Call Overhead  1 2 3 4 5 6 7 8 9 10

1 x Shell Scripts (1 concurrent)  1 2 3

1 x Shell Scripts (8 concurrent)  1 2 3

========================================================================
   BYTE UNIX Benchmarks (Version 5.1.3)

   System: : GNU/Linux
   OS: GNU/Linux -- 2.6.32-5-amd64 -- #1 SMP Wed May 18 23:13:22 UTC 2011
   Machine: x86_64 (unknown)
   Language: en_US.utf8 (charmap="UTF-8", collate="UTF-8")
   CPU 0: Intel(R) Xeon(R) CPU E31270 @ 3.40GHz (6784.6 bogomips)
          Hyper-Threading, x86-64, MMX, Physical Address Ext, SYSENTER/SYSEXIT, SYSCALL/SYSRET
   10:06:42 up 20:47,  1 user,  load average: 0.16, 0.42, 0.24; runlevel 2

------------------------------------------------------------------------
Benchmark Run: Sat Oct 08 2011 10:06:42 - 10:34:48
1 CPU in system; running 1 parallel copy of tests

Dhrystone 2 using register variables       36644939.5 lps   (10.0 s, 7 samples)
Double-Precision Whetstone                     4048.3 MWIPS (9.9 s, 7 samples)
Execl Throughput                               2125.2 lps   (30.0 s, 2 samples)
File Copy 1024 bufsize 2000 maxblocks        303831.9 KBps  (30.0 s, 2 samples)
File Copy 256 bufsize 500 maxblocks           78273.1 KBps  (30.0 s, 2 samples)
File Copy 4096 bufsize 8000 maxblocks        992818.0 KBps  (30.0 s, 2 samples)
Pipe Throughput                              454269.2 lps   (10.0 s, 7 samples)
Pipe-based Context Switching                  91776.8 lps   (10.0 s, 7 samples)
Process Creation                               4345.3 lps   (30.0 s, 2 samples)
Shell Scripts (1 concurrent)                   4533.3 lpm   (60.0 s, 2 samples)
Shell Scripts (8 concurrent)                    595.1 lpm   (60.0 s, 2 samples)
System Call Overhead                         524091.9 lps   (10.0 s, 7 samples)

System Benchmarks Index Values               BASELINE       RESULT    INDEX
Dhrystone 2 using register variables         116700.0   36644939.5   3140.1
Double-Precision Whetstone                       55.0       4048.3    736.0
Execl Throughput                                 43.0       2125.2    494.2
File Copy 1024 bufsize 2000 maxblocks          3960.0     303831.9    767.3
File Copy 256 bufsize 500 maxblocks            1655.0      78273.1    472.9
File Copy 4096 bufsize 8000 maxblocks          5800.0     992818.0   1711.8
Pipe Throughput                               12440.0     454269.2    365.2
Pipe-based Context Switching                   4000.0      91776.8    229.4
Process Creation                                126.0       4345.3    344.9
Shell Scripts (1 concurrent)                     42.4       4533.3   1069.2
Shell Scripts (8 concurrent)                      6.0        595.1    991.8
System Call Overhead                          15000.0     524091.9    349.4
                                                                   ========
System Benchmarks Index Score                                         665.9
For a single core CPU VPS, I think the benchmark score is actually pretty good.
After I have the UnixBench tests done, I submitted a ticket to get the OS changed to Debian 6 32 bit version and Matt has basically provisioned another VPS for me:
 uname -a
Linux  2.6.32-5-686-bigmem #1 SMP Mon Oct 3 05:03:32 UTC 2011 i686 GNU/Linux
The 32 bit version, as you can guess, is a lot more memory efficient compare to its 64 bit sibling, using only 15MB of memory after a fresh install:
free -m
             total       used       free     shared    buffers     cached
Mem:           121        116          4          0         26         74
-/+ buffers/cache:         15        105
Swap:          382          0        382
And the corresponding top output showing all the processes running:
top - 17:00:25 up 1 day,  4:05,  1 user,  load average: 0.00, 0.00, 0.00
Tasks:  51 total,   1 running,  50 sleeping,   0 stopped,   0 zombie
Cpu(s):  0.0%us,  0.0%sy,  0.0%ni,100.0%id,  0.0%wa,  0.0%hi,  0.0%si,  0.0%st
Mem:    124336k total,   120636k used,     3700k free,    27592k buffers
Swap:   392184k total,        0k used,   392184k free,    76720k cached

  PID USER      PR  NI  VIRT  RES  SHR S %CPU %MEM    TIME+  COMMAND
  893 root      20   0  8476 2940 2320 S  0.0  2.4   0:00.07 sshd
  896 root      20   0  5512 2800 1452 S  0.0  2.3   0:00.10 bash
  597 root      20   0 27320 1456 1024 S  0.0  1.2   0:00.00 rsyslogd
  938 root      20   0  2664 1196 1008 S  0.0  1.0   0:00.95 xe-daemon
 1009 root      20   0  2340 1120  900 R  0.0  0.9   0:00.00 top
 1004 root      20   0  5500  980  592 S  0.0  0.8   0:00.00 sshd
  909 Debian-e  20   0  6524  944  624 S  0.0  0.8   0:00.02 exim4
  695 root      20   0  3792  780  604 S  0.0  0.6   0:00.08 cron
  488 statd     20   0  1944  776  640 S  0.0  0.6   0:00.00 rpc.statd
  150 root      16  -4  2264  748  416 S  0.0  0.6   0:00.01 udevd
    1 root      20   0  2040  724  628 S  0.0  0.6   0:00.79 init
  205 root      18  -2  2260  636  308 S  0.0  0.5   0:00.00 udevd
  212 root      18  -2  2260  636  308 S  0.0  0.5   0:00.00 udevd
 1029 root      20   0  1712  560  480 S  0.0  0.5   0:00.00 getty
 1031 root      20   0  1712  556  476 S  0.0  0.4   0:00.00 getty
 1033 root      20   0  1712  556  476 S  0.0  0.4   0:00.00 getty
 1034 root      20   0  1712  556  476 S  0.0  0.4   0:00.00 getty
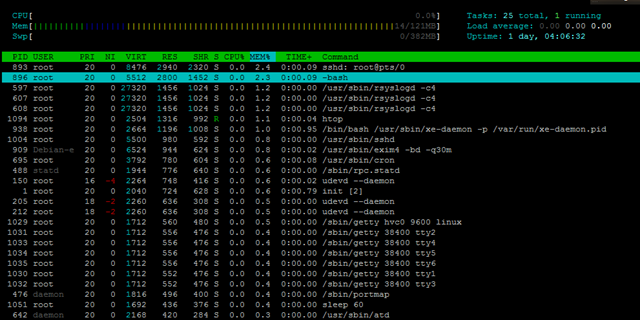
And htop output for the htop fans:
The installation used about 650MB of hard drive space.
df -h
Filesystem            Size  Used Avail Use% Mounted on
/dev/xvda1            7.6G  648M  6.5G   9% /
tmpfs                  61M     0   61M   0% /lib/init/rw
udev                   51M   68K   51M   1% /dev
tmpfs                  61M     0   61M   0% /dev/shm
/dev/xvdb            1008M   34M  924M   4% /disk1
With the full LNMP stack installed, only 28MB of RAM was used, which is pretty impressive:
 free -m
             total       used       free     shared    buffers     cached
Mem:           121        118          2          0          5         84
-/+ buffers/cache:         28         92
Swap:          382          6        376
And the top output showing the processes running:
top - 05:33:56 up 1 day,  4:38,  1 user,  load average: 0.05, 0.55, 0.57
Tasks:  61 total,   1 running,  60 sleeping,   0 stopped,   0 zombie
Cpu(s):  0.3%us,  0.3%sy,  0.0%ni, 90.6%id,  8.7%wa,  0.0%hi,  0.0%si,  0.0%st
Mem:    124336k total,   121472k used,     2864k free,     5656k buffers
Swap:   392184k total,     6928k used,   385256k free,    86008k cached

  PID USER      PR  NI  VIRT  RES  SHR S %CPU %MEM    TIME+  COMMAND
 6648 www       20   0 14508  10m  412 S  0.0  8.6   0:00.00 nginx
 6638 root      20   0 24208 4572 1408 S  0.0  3.7   0:00.02 php-cgi
 6639 www       20   0 24208 4172 1008 S  0.0  3.4   0:00.00 php-cgi
 6640 www       20   0 24208 4172 1008 S  0.0  3.4   0:00.00 php-cgi
 6642 www       20   0 24208 4172 1008 S  0.0  3.4   0:00.00 php-cgi
 6643 www       20   0 24208 4172 1008 S  0.0  3.4   0:00.00 php-cgi
 6644 www       20   0 24208 4172 1008 S  0.0  3.4   0:00.00 php-cgi
 1301 root      20   0  5512 1164  860 S  0.0  0.9   0:00.10 bash
 6747 root      20   0  2340 1124  900 R  0.0  0.9   0:00.00 top
  597 root      20   0 27320  928  732 S  0.0  0.7   0:00.01 rsyslogd
20003 mysql     20   0 34816  896  548 S  0.0  0.7   0:00.00 mysqld
  938 root      20   0  2664  848  712 S  0.3  0.7   0:00.98 xe-daemon
 1298 root      20   0  8404  784  668 S  0.0  0.6   0:00.65 sshd
 6646 root      20   0  4696  700  264 S  0.0  0.6   0:00.00 nginx
    1 root      20   0  2040  512  484 S  0.0  0.4   0:00.80 init
19901 root      20   0  1756  468  464 S  0.0  0.4   0:00.00 mysqld_safe
  695 root      20   0  3792  452  408 S  0.0  0.4   0:00.08 cron
2GB of hard drive space was used, which is slightly less than the 64 bit version.
df -h
Filesystem            Size  Used Avail Use% Mounted on
/dev/xvda1            7.6G  2.0G  5.2G  28% /
tmpfs                  61M     0   61M   0% /lib/init/rw
udev                   51M   68K   51M   1% /dev
tmpfs                  61M     0   61M   0% /dev/shm
/dev/xvdb            1008M   34M  924M   4% /disk1
The inodes limits are pretty low as well:
 df -i
Filesystem            Inodes   IUsed   IFree IUse% Mounted on
/dev/xvda1            499712   74086  425626   15% /
tmpfs                  15542       5   15537    1% /lib/init/rw
udev                   12892     448   12444    4% /dev
tmpfs                  15542       1   15541    1% /dev/shm
/dev/xvdb              65536      11   65525    1% /disk1
I have actually done the dd tests again on this VPS, but for the SATA III hard drives only, to see how it performs:
 dd if=/dev/zero of=test bs=64k count=16k conv=fdatasync
16384+0 records in
16384+0 records out
1073741824 bytes (1.1 GB) copied, 16.2198 s, 66.2 MB/s
And test again:
 dd if=/dev/zero of=test bs=64k count=16k conv=fdatasync
16384+0 records in
16384+0 records out
1073741824 bytes (1.1 GB) copied, 14.1243 s, 76.0 MB/s
As you can see, this time the disk I/O is a lot more stable compare to the tests I did on the 64 bit OS.
I tried, yet again, to get GeekBench 2.2 running on this VPS, and obviously, again, it failed:
Geekbench 2.2.0 : http://www.primatelabs.ca/geekbench/

Geekbench is in tryout mode

Geekbench is limited to running 32-bit benchmarks while in tryout mode.
Please purchase Geekbench to remove all limitations found in tryout mode.

If you would like to purchase Geekbench you can do so online:

        http://store.primatelabs.ca/

If you have already purchased Geekbench, enter your email address and license
key from your email receipt with the following command line:

        dist/Geekbench-2.2.0-Linux/geekbench_x86_32 -r

Run Geekbench as root to gather accurate system information.

Floating point exception
However, rolling back to GeekBench 2.1 did give me some pretty impressive results though:
System Information
  Platform:                  Linux x86 (32-bit)
  Compiler:                  GCC 4.1.2 20070925 (Red Hat 4.1.2-33)
  Operating System:          Linux 2.6.32-5-686-bigmem i686
  Model:                     Linux PC (Intel(R) Xeon(R) CPU E31270 @ 3.40GHz)
  Motherboard:               Unknown Motherboard
  Processor:                 Intel(R) Xeon(R) CPU E31270 @ 3.40GHz
  Processor ID:              GenuineIntel Family 6 Model 42 Stepping 7
  Logical Processors:        1
  Physical Processors:       1
  Processor Frequency:       3.39 GHz
  L1 Instruction Cache:      0.00 B
  L1 Data Cache:             0.00 B
  L2 Cache:                  256 KB
  L3 Cache:                  0.00 B
  Bus Frequency:             0.00 Hz
  Memory:                    121 MB
  Memory Type:               N/A
  SIMD:                      1
  BIOS:                      N/A
  Processor Model:                     Intel(R) Xeon(R) CPU E31270 @ 3.40GHz
  Processor Cores:           1

Integer
  Blowfish
    single-threaded scalar    2196 ||||||||
    multi-threaded scalar     2354 |||||||||
  Text Compress
    single-threaded scalar    2963 |||||||||||
    multi-threaded scalar     2901 |||||||||||
  Text Decompress
    single-threaded scalar    3204 ||||||||||||
    multi-threaded scalar     3227 ||||||||||||
  Image Compress
    single-threaded scalar    2320 |||||||||
    multi-threaded scalar     2304 |||||||||
  Image Decompress
    single-threaded scalar    2131 ||||||||
    multi-threaded scalar     2309 |||||||||
  Lua
    single-threaded scalar    3856 |||||||||||||||
    multi-threaded scalar     3753 |||||||||||||||

Floating Point
  Mandelbrot
    single-threaded scalar    2817 |||||||||||
    multi-threaded scalar     2874 |||||||||||
  Dot Product
    single-threaded scalar    4544 ||||||||||||||||||
    multi-threaded scalar     4805 |||||||||||||||||||
    single-threaded vector    5495 |||||||||||||||||||||
    multi-threaded vector     5992 |||||||||||||||||||||||
  LU Decomposition
    single-threaded scalar    3535 ||||||||||||||
    multi-threaded scalar     3627 ||||||||||||||
  Primality Test
    single-threaded scalar    4893 |||||||||||||||||||
    multi-threaded scalar     3920 |||||||||||||||
  Sharpen Image
    single-threaded scalar   10769 |||||||||||||||||||||||||||||||||||||||||||
    multi-threaded scalar    10391 |||||||||||||||||||||||||||||||||||||||||
  Blur Image
    single-threaded scalar    8761 |||||||||||||||||||||||||||||||||||
    multi-threaded scalar     8374 |||||||||||||||||||||||||||||||||

Memory
  Read Sequential
    single-threaded scalar    7763 |||||||||||||||||||||||||||||||
  Write Sequential
    single-threaded scalar   12008 ||||||||||||||||||||||||||||||||||||||||||||||||
  Stdlib Allocate
    single-threaded scalar    4872 |||||||||||||||||||
  Stdlib Write
    single-threaded scalar    8315 |||||||||||||||||||||||||||||||||
  Stdlib Copy
    single-threaded scalar   15246 ||||||||||||||||||||||||||||||||||||||||||||||||||||||||||||

Stream
  Stream Copy
    single-threaded scalar    6150 ||||||||||||||||||||||||
    single-threaded vector    7232 ||||||||||||||||||||||||||||
  Stream Scale
    single-threaded scalar    6645 ||||||||||||||||||||||||||
    single-threaded vector    7025 ||||||||||||||||||||||||||||
  Stream Add
    single-threaded scalar    6051 ||||||||||||||||||||||||
    single-threaded vector    6905 |||||||||||||||||||||||||||
  Stream Triad
    single-threaded scalar    6306 |||||||||||||||||||||||||
    single-threaded vector    5077 ||||||||||||||||||||

Integer Score:                2793 |||||||||||
Floating Point Score:         5771 |||||||||||||||||||||||
Memory Score:                 9640 ||||||||||||||||||||||||||||||||||||||
Stream Score:                 6423 |||||||||||||||||||||||||

Overall Geekbench Score:      5567 ||||||||||||||||||||||
And test again showed similar results:
System Information
  Platform:                  Linux x86 (32-bit)
  Compiler:                  GCC 4.1.2 20070925 (Red Hat 4.1.2-33)
  Operating System:          Linux 2.6.32-5-686-bigmem i686
  Model:                     Linux PC (Intel(R) Xeon(R) CPU E31270 @ 3.40GHz)
  Motherboard:               Unknown Motherboard
  Processor:                 Intel(R) Xeon(R) CPU E31270 @ 3.40GHz
  Processor ID:              GenuineIntel Family 6 Model 42 Stepping 7
  Logical Processors:        1
  Physical Processors:       1
  Processor Frequency:       3.39 GHz
  L1 Instruction Cache:      0.00 B
  L1 Data Cache:             0.00 B
  L2 Cache:                  256 KB
  L3 Cache:                  0.00 B
  Bus Frequency:             0.00 Hz
  Memory:                    121 MB
  Memory Type:               N/A
  SIMD:                      1
  BIOS:                      N/A
  Processor Model:                     Intel(R) Xeon(R) CPU E31270 @ 3.40GHz
  Processor Cores:           1

Integer
  Blowfish
    single-threaded scalar    2190 ||||||||
    multi-threaded scalar     2346 |||||||||
  Text Compress
    single-threaded scalar    2931 |||||||||||
    multi-threaded scalar     2901 |||||||||||
  Text Decompress
    single-threaded scalar    3210 ||||||||||||
    multi-threaded scalar     3297 |||||||||||||
  Image Compress
    single-threaded scalar    2492 |||||||||
    multi-threaded scalar     2444 |||||||||
  Image Decompress
    single-threaded scalar    2286 |||||||||
    multi-threaded scalar     2356 |||||||||
  Lua
    single-threaded scalar    4197 ||||||||||||||||
    multi-threaded scalar     4097 ||||||||||||||||

Floating Point
  Mandelbrot
    single-threaded scalar    2835 |||||||||||
    multi-threaded scalar     2880 |||||||||||
  Dot Product
    single-threaded scalar    4627 ||||||||||||||||||
    multi-threaded scalar     4938 |||||||||||||||||||
    single-threaded vector    5527 ||||||||||||||||||||||
    multi-threaded vector     6389 |||||||||||||||||||||||||
  LU Decomposition
    single-threaded scalar    3555 ||||||||||||||
    multi-threaded scalar     3627 ||||||||||||||
  Primality Test
    single-threaded scalar    4990 |||||||||||||||||||
    multi-threaded scalar     4004 ||||||||||||||||
  Sharpen Image
    single-threaded scalar   10778 |||||||||||||||||||||||||||||||||||||||||||
    multi-threaded scalar    10653 ||||||||||||||||||||||||||||||||||||||||||
  Blur Image
    single-threaded scalar    8635 ||||||||||||||||||||||||||||||||||
    multi-threaded scalar     8668 ||||||||||||||||||||||||||||||||||

Memory
  Read Sequential
    single-threaded scalar    7799 |||||||||||||||||||||||||||||||
  Write Sequential
    single-threaded scalar   12222 ||||||||||||||||||||||||||||||||||||||||||||||||
  Stdlib Allocate
    single-threaded scalar    4975 |||||||||||||||||||
  Stdlib Write
    single-threaded scalar    8608 ||||||||||||||||||||||||||||||||||
  Stdlib Copy
    single-threaded scalar   16870 |||||||||||||||||||||||||||||||||||||||||||||||||||||||||||||||||||

Stream
  Stream Copy
    single-threaded scalar    6499 |||||||||||||||||||||||||
    single-threaded vector    7845 |||||||||||||||||||||||||||||||
  Stream Scale
    single-threaded scalar    6757 |||||||||||||||||||||||||||
    single-threaded vector    7489 |||||||||||||||||||||||||||||
  Stream Add
    single-threaded scalar    6291 |||||||||||||||||||||||||
    single-threaded vector    6986 |||||||||||||||||||||||||||
  Stream Triad
    single-threaded scalar    6780 |||||||||||||||||||||||||||
    single-threaded vector    5161 ||||||||||||||||||||

Integer Score:                2895 |||||||||||
Floating Point Score:         5864 |||||||||||||||||||||||
Memory Score:                10094 ||||||||||||||||||||||||||||||||||||||||
Stream Score:                 6726 ||||||||||||||||||||||||||

Overall Geekbench Score:      5757 |||||||||||||||||||||||
The UnixBench results is also better on this VPS than on the 64 bit one:
   #    #  #    #  #  #    #          #####   ######  #    #   ####   #    #
   #    #  ##   #  #   #  #           #    #  #       ##   #  #    #  #    #
   #    #  # #  #  #    ##            #####   #####   # #  #  #       ######
   #    #  #  # #  #    ##            #    #  #       #  # #  #       #    #
   #    #  #   ##  #   #  #           #    #  #       #   ##  #    #  #    #
    ####   #    #  #  #    #          #####   ######  #    #   ####   #    #

   Version 5.1.3                      Based on the Byte Magazine Unix Benchmark

   Multi-CPU version                  Version 5 revisions by Ian Smith,
                                      Sunnyvale, CA, USA
   January 13, 2011                   johantheghost at yahoo period com


1 x Dhrystone 2 using register variables  1 2 3 4 5 6 7 8 9 10

1 x Double-Precision Whetstone  1 2 3 4 5 6 7 8 9 10

1 x Execl Throughput  1 2 3

1 x File Copy 1024 bufsize 2000 maxblocks  1 2 3

1 x File Copy 256 bufsize 500 maxblocks  1 2 3

1 x File Copy 4096 bufsize 8000 maxblocks  1 2 3

1 x Pipe Throughput  1 2 3 4 5 6 7 8 9 10

1 x Pipe-based Context Switching  1 2 3 4 5 6 7 8 9 10

1 x Process Creation  1 2 3

1 x System Call Overhead  1 2 3 4 5 6 7 8 9 10

1 x Shell Scripts (1 concurrent)  1 2 3

1 x Shell Scripts (8 concurrent)  1 2 3

========================================================================
   BYTE UNIX Benchmarks (Version 5.1.3)

   System: : GNU/Linux
   OS: GNU/Linux -- 2.6.32-5-686-bigmem -- #1 SMP Mon Oct 3 05:03:32 UTC 2011
   Machine: i686 (unknown)
   Language: en_US.utf8 (charmap="UTF-8", collate="UTF-8")
   CPU 0: Intel(R) Xeon(R) CPU E31270 @ 3.40GHz (6784.6 bogomips)
          Hyper-Threading, MMX, Physical Address Ext, SYSENTER/SYSEXIT
   05:40:40 up 1 day,  4:45,  1 user,  load average: 0.01, 0.20, 0.40; runlevel 2

------------------------------------------------------------------------
Benchmark Run: Mon Oct 10 2011 05:40:40 - 06:08:50
1 CPU in system; running 1 parallel copy of tests

Dhrystone 2 using register variables       20601074.5 lps   (10.0 s, 7 samples)
Double-Precision Whetstone                     3332.3 MWIPS (10.0 s, 7 samples)
Execl Throughput                               2730.6 lps   (30.0 s, 2 samples)
File Copy 1024 bufsize 2000 maxblocks        510215.0 KBps  (30.0 s, 2 samples)
File Copy 256 bufsize 500 maxblocks          130466.5 KBps  (30.0 s, 2 samples)
File Copy 4096 bufsize 8000 maxblocks       1538331.9 KBps  (30.0 s, 2 samples)
Pipe Throughput                              776675.0 lps   (10.0 s, 7 samples)
Pipe-based Context Switching                  91051.1 lps   (10.0 s, 7 samples)
Process Creation                               4931.7 lps   (30.0 s, 2 samples)
Shell Scripts (1 concurrent)                   5025.1 lpm   (60.0 s, 2 samples)
Shell Scripts (8 concurrent)                    661.5 lpm   (60.0 s, 2 samples)
System Call Overhead                         838003.6 lps   (10.0 s, 7 samples)

System Benchmarks Index Values               BASELINE       RESULT    INDEX
Dhrystone 2 using register variables         116700.0   20601074.5   1765.3
Double-Precision Whetstone                       55.0       3332.3    605.9
Execl Throughput                                 43.0       2730.6    635.0
File Copy 1024 bufsize 2000 maxblocks          3960.0     510215.0   1288.4
File Copy 256 bufsize 500 maxblocks            1655.0     130466.5    788.3
File Copy 4096 bufsize 8000 maxblocks          5800.0    1538331.9   2652.3
Pipe Throughput                               12440.0     776675.0    624.3
Pipe-based Context Switching                   4000.0      91051.1    227.6
Process Creation                                126.0       4931.7    391.4
Shell Scripts (1 concurrent)                     42.4       5025.1   1185.2
Shell Scripts (8 concurrent)                      6.0        661.5   1102.4
System Call Overhead                          15000.0     838003.6    558.7
                                                                   ========
System Benchmarks Index Score                                         805.2
Overall, I think the performance of the VPS is above average. The disk I/O on the SSD is definitely impressive, however the network speed, particularly upload speed, is what that may needs some improvements along the way.
Customer Service and Support
Since at the moment, there is no control panel available, and everything has to be done by human via tickets (including reinstalling of OS, which could take quite a bit of time), I was thinking SSD Nodes must be overwhelmed with tickets and therefore the response could be really slow. To my pleasant surprise, it is actually not the case. For the simplest technical questions, I have received a reply barely 3 minutes after I have submitted the ticket (ticket submitted at 7:12PM, received reply at 7:15PM, on a Sunday as well), and even my little complain to them for lack of control panel, which was replied with a very detailed explanation, was answered in 14 minutes on Friday evening. Even billing (which is typically the “slower” department) was able to get back to me in 5 minutes when I had trouble paying invoice and Matt actually sent me an email, even before I got a chance to submit my billing ticket, to ask me if I had any trouble paying the invoice, which was definitely the only one I have seen among all the VPS I have reviewed so far.
Conclusion
SSD Nodes has definitely offered us something pretty unique: a hybrid VPS with both SSD and SATA III drives, which makes it really economical, but also delivers the performance if you really need a good disk I/O. There are definitely a few areas for improvements, for example, getting a control panel up and running, getting stable network speed and higher inodes. However, with the impressive disk I/O of the SSD drives and fast customer support, SSD Nodes is definitely worth consideration if you need a VPS that partially requires high disk I/O without costing too much.
Pingback: Thank you! | | 96MB.com96MB.com
Pingback: 96MB Low End VPS Review Part XXXXI – VPSDeploy SSD | | 96MB.com96MB.com
Pingback: SSD Nodes up to 128GB RAM! Premium Network w/ 2×1-10Gbps Public/Private Interfaces » Dedicated Offer - gathering the best hosting deals for you.
Pingback: SSD Web Hosting | 8x Tier 1 & 2,000Gbps | Supercomputers at your Fingertips
Pingback: SSD Web Hosting 8x Tier 1 & 2,000Gbps Supercomputers at your Fingertips
Pingback: SSD Nodes Innovators, Meet Our Platform. High Performance Starting at $799/mo | CheapHostingOffer.com
Pingback: SSD Nodes | 50% off NEW Cloud | 512MB RAM for $4.95/mo | 7 Day Refund! | Canada | Host Offers Only
Pingback: CheapVPSDeals | HPC SSD Nodes up to 240GB RAM | 10Gbps NICs | Canada | Starting at $0.04/hr & $10/mo
Pingback: The Fastest HPC SSD Nodes | Dedicated I/O + 10Gbps NICs | Canada | Starting at $20/mo | Lost in the forest
Pingback: CheapVPSDeals | WHT Outlet: $9.99/mo for 2GB RAM + Enterprise SSDs | Supercharge Your Business Today!
Pingback: CheapVPSDeals | The Fastest HPC SSD Cloud – Dedicated Performance + 10Gbps NICs
Pingback: SSD Nodes – Dedicated High Performance and 10Gbps NICs – Limited time WHT Deal! | TheHostMag
Pingback: SSD Nodes - Dedicated High Performance and 10Gbps NICs - Limited time WHT Deal! - CheapVPSDeals
Pingback: SSD Nodes – 10Gbps NICs / Dedicated Performance – Your Business on Steroids | TheHostMag
Pingback: SSD Nodes - 10Gbps NICs / Dedicated Performance - Your Business on Steroids - CheapVPSDeals
Pingback: SSD Nodes – Your Business on Steroids – Get started for $10/mo! (Limited WHT offer) | TheHostMag
Pingback: SSD Nodes | 100x Faster than EC2 + 8x Backbone Providers | Annual = 2 Months FREE! - CheapVPSDeals
Pingback: █ SSD Nodes █ 100x Faster than EC2, 8x Tier-1 Providers █ Annual = 2 Months FREE! | CheapHostingOffer.com
Pingback: █ SSD Nodes █ IBM 8x Tier-1 ISPs █ Direct Engineer Support - CheapVPSDeals
Pingback: New Enterprise Offsite Storage | US/EU/HK Locations | Petabyte Scale | CheapHostingOffer.com
Pingback: $4/mo for 4GB RAM in Dallas and Canada! Fastest RAID 10 SSDs: 1GB/s IO & 200K IOPS. Get Started Now! - CheapVPSDeals