
96MB Low End Review Part XXIII – Alvotech
There are definitely not that many providers offering unmetered services and is within the low-end budget type of range, a few of them which claimed to do has either proven not to be the case. However, Alvotech was daring enough to offer such services at a very low price and yet still received quite a few great comments about the services they provide. Is it really as good as many people have claimed them to be? Let’s find out.
General Information and Set Up
By default, Alvotech’s website is in Deutsch, which is understandable since they are, after all, German company. They do have a toggle on their home page for those who are not that efficient with German, although I am not sure how many people will complain when they have to click on an American flag to see the English version:

Jokes aside, unlike many of the other providers who use WHMCS to manage clients and sign ups, Alvotech actually came up with their own sign up form. Once you click on Order Now, this is what you see via their HTTPS page:

Set up is not instant although you do get a confirmation email when the payment is submitted. The VPS is promised to be set up within 12 hours and in my case, it took a little more than 12 hours for the creation of the server after my payment (payment made at 10:11PM and the VPS was set up at 1:45PM next afternoon. Therefore, for those ones who are in a rush, you may have to be a little bit patient when it comes to server set up.
There was no option to specify the root password and therefore it was sent in plain text in the welcome email as well. The control panel link provided in the welcome email is in German, which, again, you can toggle it to English.
Once logged in via HTTPS interface with your client ID and password, you are presented with a rather simple control panel page:

The settings area is where you change your personal information, view your invoice and change your control panel password, but the vServer is the really interesting part.
Once you click on OverView and click on the Options for the corresponding VPS, a window that resembles the following shows:
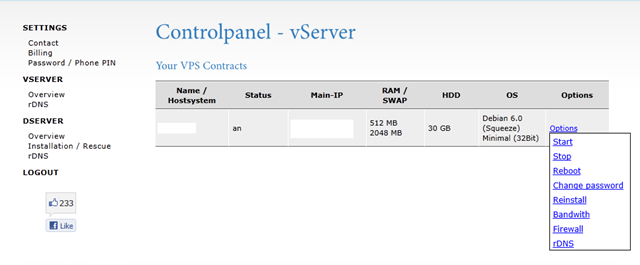
As you can see, there are quite a few options, and besides the ones that you frequently see in popular control panels such as SolusVM, there is a few unique ones:
- Bandwidth: Has detailed usage graph as well as daily and monthly bandwidth usage
- Firewall: Allows you to enable and disable specific ports on specific machines that are connecting to the VPS
- rDNS: Needless to say, this set up the rDNS for the VPS
Few OS are available when you select Reinstall options:
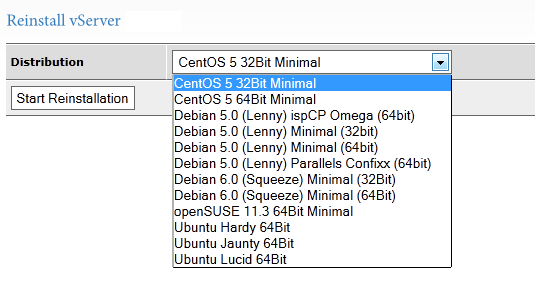
By default, “Debian Lenny Minimal 64 Bit” was installed and it was mentioned in the welcome email that customer service could do OS installation for you.
The translated control panel sometimes still shows traces of German though, for example, here is the message that I have received after changed the rDNS:
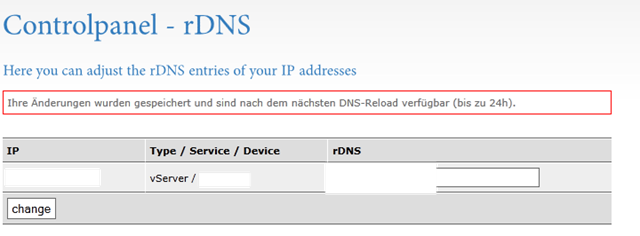
Without checking Google translate or anything (allow me to be lazy for once), I guess it roughly means you will need to wait for up to 24 hours for the rDNS settings to take effect. (For those who can read German, please correct me if I am wrong.)
Test on the VPS
The VPS that I have set up for testing is the smallest vServerL in Amsterdam, Netherlands (in TeleCity Group DC as per this post), with the following specifications:

note that the traffic is throttled once you reach 1TB per month according to this fine print:

The server is using Linux VServer virtualization technology, which is rare among the low end providers but does provide full virtualization. Correction: As per rm in the comment here, this is incorrect, it does NOT provide full visualization.
The minimal template that they have provided is a truly “minimal” one, producing numbers that I even won’t believe myself:
free -m
             total       used       free     shared    buffers     cached
Mem:           512        136        375          0          0        135
-/+ buffers/cache:          1        510
Swap:         2048          0       2048
The top output shows that I was not on drug when I saw the numbers:
top - 18:49:14 up 4 min,  1 user,  load average: 0.02, 0.02, 0.00
Tasks:   6 total,   1 running,   5 sleeping,   0 stopped,   0 zombie
Cpu(s):  0.2%us,  0.3%sy,  0.0%ni, 99.2%id,  0.3%wa,  0.0%hi,  0.0%si,  0.0%st
Mem:    524288k total,   140220k used,   384068k free,        0k buffers
Swap:  2097152k total,        0k used,  2097152k free,   138464k cached

  PID USER      PR  NI  VIRT  RES  SHR S %CPU %MEM    TIME+  COMMAND
13595 root      20   0  8300 2832 2312 S    0  0.5   0:00.09 sshd
13604 root      20   0  4532 1760 1428 S    0  0.3   0:00.00 bash
13131 root      20   0 19148 1328 1020 S    0  0.3   0:00.00 rsyslogd
15568 root      20   0  2376  980  796 R    0  0.2   0:00.00 top
13502 root      20   0  5536  948  560 S    0  0.2   0:00.00 sshd
    1 root      20   0 10364  748  616 S    0  0.1   0:02.35 init
Even with the full LNMP stack installed and loaded, the memory usage is still relatively low:
free -m
             total       used       free     shared    buffers     cached
Mem:           512        450         61          0          0        422
-/+ buffers/cache:         27        484
Swap:         2048         19       2028
And the corresponding top output:
top - 22:05:55 up 9 days,  7:21,  1 user,  load average: 0.04, 2.79, 4.59
Tasks:  31 total,   1 running,  30 sleeping,   0 stopped,   0 zombie
Cpu(s): 26.5%us,  1.7%sy,  0.0%ni, 70.9%id,  0.7%wa,  0.0%hi,  0.3%si,  0.0%st
Mem:    524288k total,   461252k used,    63036k free,        0k buffers
Swap:  2097152k total,    20020k used,  2077132k free,   432628k cached

  PID USER      PR  NI  VIRT  RES  SHR S %CPU %MEM    TIME+  COMMAND
20214 root      20   0 24220 3488  332 S    0  0.7   0:35.83 php-cgi
20215 www       20   0 24220 3472  284 S    0  0.7   0:00.00 php-cgi
20216 www       20   0 24220 3472  284 S    0  0.7   0:00.00 php-cgi
20217 www       20   0 24220 3472  284 S    0  0.7   0:00.00 php-cgi
20218 www       20   0 24220 3472  284 S    0  0.7   0:00.00 php-cgi
20219 www       20   0 24220 3464  276 S    0  0.7   0:00.00 php-cgi
 9914 root      20   0  8432 2920 2340 S    0  0.6   0:00.42 sshd
10711 root      20   0  8432 2876 2332 S    0  0.5   0:00.26 sshd
 9923 root      20   0  4560 1784 1428 S    0  0.3   0:00.05 bash
18196 www       20   0 14952 1084  552 S    0  0.2   0:10.51 nginx
 3378 root      20   0  2376  992  796 R    0  0.2   0:00.00 top
18053 mysql     20   0 35332  956  368 S    0  0.2   0:00.62 mysqld
18197 www       20   0 14888  936  584 S    0  0.2   0:17.05 nginx
18198 www       20   0 14888  844  620 S    0  0.2   0:22.98 nginx
10715 root      20   0  1972  768  632 S    0  0.1   0:00.00 sftp-server
13131 root      20   0 19148  764  588 S    0  0.1   0:00.18 rsyslogd
    1 root      20   0 10364  716  584 S    0  0.1   0:08.70 init
Close to 2G of disk space was taken after the LNMP stack was installed:
 df -h
Filesystem            Size  Used Avail Use% Mounted on
/dev/hdv1              30G  1.9G   27G   7% /
tmpfs                 2.0M     0  2.0M   0% /dev/shm
And Inode was set to pretty high value:
 df -i
Filesystem            Inodes   IUsed   IFree IUse% Mounted on
/dev/hdv1            1966080   63882 1902198    4% /
tmpfs                1024431       1 1024430    1% /dev/shm
vmstat does not seems to show, and gives an error mesaage:
 vmstat
procs -----------memory---------- ---swap-- -----io---- -system-- ----cpu----
 r  b   swpd   free   buff  cache   si   so    bi    bo   in   cs us sy id wa
Error: /proc must be mounted
  To mount /proc at boot you need an /etc/fstab line like:
      /proc   /proc   proc    defaults
  In the meantime, run "mount /proc /proc -t proc"
Although I was able to run uptime to show the node is barely used:
uptime
 19:05:43 up 9 days,  4:21,  1 user,  load average: 0.00, 0.00, 0.00
The error message on vmstat is interesting because apparently proc was mounted at boot as I was able to run both CPU info, which shows the VPS comes with 4 Xeon cores (not throttled):
 cat /proc/cpuinfo
processor       : 0
vendor_id       : GenuineIntel
cpu family      : 6
model           : 23
model name      : Intel(R) Xeon(R) CPU           X3330  @ 2.66GHz
stepping        : 10
cpu MHz         : 2666.738
cache size      : 3072 KB
physical id     : 0
siblings        : 4
core id         : 0
cpu cores       : 4
apicid          : 0
initial apicid  : 0
fpu             : yes
fpu_exception   : yes
cpuid level     : 13
wp              : yes
flags           : fpu vme de pse tsc msr pae mce cx8 apic sep mtrr pge mca cmov pat pse36 clflush dts acpi mmx fxsr sse sse2 ss ht tm pbe syscall nx lm constant_tsc arch_perfmon pebs bts rep_good aperfmperf pni dtes64 monitor ds_cpl vmx smx est tm2 ssse3 cx16 xtpr pdcm sse4_1 xsave lahf_lm dts tpr_shadow vnmi flexpriority
bogomips        : 5333.47
clflush size    : 64
cache_alignment : 64
address sizes   : 36 bits physical, 48 bits virtual
power management:

processor       : 1
vendor_id       : GenuineIntel
cpu family      : 6
model           : 23
model name      : Intel(R) Xeon(R) CPU           X3330  @ 2.66GHz
stepping        : 10
cpu MHz         : 2666.738
cache size      : 3072 KB
physical id     : 0
siblings        : 4
core id         : 1
cpu cores       : 4
apicid          : 1
initial apicid  : 1
fpu             : yes
fpu_exception   : yes
cpuid level     : 13
wp              : yes
flags           : fpu vme de pse tsc msr pae mce cx8 apic sep mtrr pge mca cmov pat pse36 clflush dts acpi mmx fxsr sse sse2 ss ht tm pbe syscall nx lm constant_tsc arch_perfmon pebs bts rep_good aperfmperf pni dtes64 monitor ds_cpl vmx smx est tm2 ssse3 cx16 xtpr pdcm sse4_1 xsave lahf_lm dts tpr_shadow vnmi flexpriority
bogomips        : 5333.68
clflush size    : 64
cache_alignment : 64
address sizes   : 36 bits physical, 48 bits virtual
power management:

processor       : 2
vendor_id       : GenuineIntel
cpu family      : 6
model           : 23
model name      : Intel(R) Xeon(R) CPU           X3330  @ 2.66GHz
stepping        : 10
cpu MHz         : 2666.738
cache size      : 3072 KB
physical id     : 0
siblings        : 4
core id         : 2
cpu cores       : 4
apicid          : 2
initial apicid  : 2
fpu             : yes
fpu_exception   : yes
cpuid level     : 13
wp              : yes
flags           : fpu vme de pse tsc msr pae mce cx8 apic sep mtrr pge mca cmov pat pse36 clflush dts acpi mmx fxsr sse sse2 ss ht tm pbe syscall nx lm constant_tsc arch_perfmon pebs bts rep_good aperfmperf pni dtes64 monitor ds_cpl vmx smx est tm2 ssse3 cx16 xtpr pdcm sse4_1 xsave lahf_lm dts tpr_shadow vnmi flexpriority
bogomips        : 5333.71
clflush size    : 64
cache_alignment : 64
address sizes   : 36 bits physical, 48 bits virtual
power management:

processor       : 3
vendor_id       : GenuineIntel
cpu family      : 6
model           : 23
model name      : Intel(R) Xeon(R) CPU           X3330  @ 2.66GHz
stepping        : 10
cpu MHz         : 2666.738
cache size      : 3072 KB
physical id     : 0
siblings        : 4
core id         : 3
cpu cores       : 4
apicid          : 3
initial apicid  : 3
fpu             : yes
fpu_exception   : yes
cpuid level     : 13
wp              : yes
flags           : fpu vme de pse tsc msr pae mce cx8 apic sep mtrr pge mca cmov pat pse36 clflush dts acpi mmx fxsr sse sse2 ss ht tm pbe syscall nx lm constant_tsc arch_perfmon pebs bts rep_good aperfmperf pni dtes64 monitor ds_cpl vmx smx est tm2 ssse3 cx16 xtpr pdcm sse4_1 xsave lahf_lm dts tpr_shadow vnmi flexpriority
bogomips        : 5333.71
clflush size    : 64
cache_alignment : 64
address sizes   : 36 bits physical, 48 bits virtual
power management:
And meminfo as well:
 cat /proc/meminfo
MemTotal:         524288 kB
MemFree:           60320 kB
Buffers:               0 kB
Cached:           430992 kB
SwapCached:        38776 kB
Active:          3967676 kB
Inactive:        2737576 kB
Active(anon):    1783240 kB
Inactive(anon):   343296 kB
Active(file):    2184436 kB
Inactive(file):  2394280 kB
Unevictable:           8 kB
Mlocked:               8 kB
SwapTotal:       2097152 kB
SwapFree:        2077132 kB
Dirty:               272 kB
Writeback:             0 kB
AnonPages:       2085652 kB
Mapped:           205692 kB
Shmem:              9240 kB
Slab:            1215108 kB
SReclaimable:    1011460 kB
SUnreclaim:       203648 kB
KernelStack:       10896 kB
PageTables:        65236 kB
NFS_Unstable:          0 kB
Bounce:                0 kB
WritebackTmp:          0 kB
CommitLimit:    11913208 kB
Committed_AS:    9034840 kB
VmallocTotal:   34359738367 kB
VmallocUsed:      290632 kB
VmallocChunk:   34359329528 kB
HugePages_Total:       0
HugePages_Free:        0
HugePages_Rsvd:        0
HugePages_Surp:        0
Hugepagesize:       2048 kB
DirectMap4k:        2760 kB
DirectMap2M:     8384512 kB
Disk I/O is in the usable range:
 dd if=/dev/zero of=test bs=64k count=16k conv=fdatasync
16384+0 records in
16384+0 records out
1073741824 bytes (1.1 GB) copied, 22.415 s, 47.9 MB/s
And testing again actually shows better I/O:
dd if=/dev/zero of=test bs=64k count=16k conv=fdatasync
16384+0 records in
16384+0 records out
1073741824 bytes (1.1 GB) copied, 20.5982 s, 52.1 MB/s
The 1Gbit port is definitely showing off its power when downloading file from Cachefly:
wget cachefly.cachefly.net/100mb.test -O /dev/null --2011-08-22 19:14:12-- http://cachefly.cachefly.net/100mb.test Resolving cachefly.cachefly.net... 205.234.175.175 Connecting to cachefly.cachefly.net|205.234.175.175|:80... connected. HTTP request sent, awaiting response... 200 OK Length: 104857600 (100M) [application/octet-stream] Saving to: “/dev/null†100%[======================================>] 104,857,600 86.2M/s in 1.2s 2011-08-22 19:14:13 (86.2 MB/s) - “/dev/nullâ€
I have tried to use aget to download the file as well, and needless to say, with 10 concurrent threads, the download was completed within a second:
aget -n 10 http://cachefly.cachefly.net/100mb.test
 Attempting to read log file aget-100mb.test.log for resuming download job...
 Couldn't find log file for this download, starting a clean job...
 Head-Request Connection established
 Downloading /100mb.test (104857600 bytes) from site cachefly.cachefly.net(205.234.175.175:80). Number of Threads: 10
..                                                 [4% completed]
.....                                              [9% completed]
.......                                            [14% completed]
..........                                         [19% completed]
............                                       [24% completed]
...............                                    [29% completed]
.................                                  [34% completed]
....................                               [39% completed]
......................                             [44% completed]
..........................................                          [49% completed]
........                          [49% completed]
...........................                        [54% completed]
..............................                     [59% completed]
................................                   [64% completed]
...................................                [69% completed]
......................................              [74% completed]
....................................              [74% completed]
........................................           [79% completed]
..........................................         [84% completed]
.............................................      [89% completed]
...............................................    [94% completed]
.................................................. [99% completed]
.................................................. [100% completed]
 Download completed, job completed in 1 seconds. (102400 Kb/sec)
Even with the 1GB file from thinkbroadband, the speed was still pretty good:
 aget -n 10 http://download.thinkbroadband.com/1GB.zip
 Attempting to read log file aget-1GB.zip.log for resuming download job...
 Couldn't find log file for this download, starting a clean job...
 Head-Request Connection established
 Downloading /1GB.zip (1073741824 bytes) from site download.thinkbroadband.com(80.249.99.148:80). Number of Threads: 10
..                                                 [4% completed]
.....                                              [9% completed]
.......                                            [14% completed]
..........                                         [19% completed]
............                                       [24% completed]
...............                                    [29% completed]
.................                                  [34% completed]
....................                               [39% completed]
......................                             [44% completed]
.........................                          [49% completed]
...........................                        [54% completed]
..............................                     [59% completed]
................................                   [64% completed]
...................................                [69% completed]
.....................................              [74% completed]
........................................           [79% completed]
..........................................         [84% completed]
.............................................      [89% completed]
...............................................    [94% completed]
.................................................. [99% completed]
.................................................. [100% completed]
 Download completed, job completed in 47 seconds. (22310 Kb/sec)
 Shutting down...
Upload speed seems pretty good too:
First, my BuyVM VPS from San Jose, CA, which is supposed to have the “worst” connection to Europe among all my 3 test VPS:
 wget 91.203.212.13/100mb.test -O /dev/null
--2011-08-22 23:16:42--  http://91.203.212.13/100mb.test
Connecting to 91.203.212.13:80... connected.
HTTP request sent, awaiting response... 200 OK
Length: 104857600 (100M) [application/octet-stream]
Saving to: `/dev/null'

100%[======================================>] 104,857,600 6.66M/s   in 18s

2011-08-22 23:17:01 (5.44 MB/s) - `/dev/null' saved [104857600/104857600]
Nix Communication’s VPS in Montreal, Canada gave an even better speed:
 wget 91.203.212.13/100mb.test -O /dev/null
--2011-08-23 10:08:11--  http://91.203.212.13/100mb.test
Connecting to 91.203.212.13:80... connected.
HTTP request sent, awaiting response... 200 OK
Length: 104857600 (100M) [application/octet-stream]
Saving to: `/dev/null'

100%[======================================>] 104,857,600 9.94M/s   in 13s

2011-08-23 10:08:24 (7.90 MB/s) - `/dev/null' saved [104857600/104857600]
Finally, and most surprisingly, my Quickweb VPS in London, UK, actually gave the lowest speed, which really made me wondering if it is based in Europe at all:
wget 91.203.212.13/100mb.test -O /dev/null
--2011-08-22 23:07:12--  http://91.203.212.13/100mb.test
Connecting to 91.203.212.13:80... connected.
HTTP request sent, awaiting response... 200 OK
Length: 104857600 (100M) [application/octet-stream]
Saving to: `/dev/null'

100%[======================================>] 104,857,600 8.52M/s   in 34s

2011-08-22 23:07:46 (2.98 MB/s) - `/dev/null' saved [104857600/104857600]
As for the benchmarks, I was pretty surprised when the UnixBench score did not go above 1000, given everything for the box seems to be pretty good:
   #    #  #    #  #  #    #          #####   ######  #    #   ####   #    #
   #    #  ##   #  #   #  #           #    #  #       ##   #  #    #  #    #
   #    #  # #  #  #    ##            #####   #####   # #  #  #       ######
   #    #  #  # #  #    ##            #    #  #       #  # #  #       #    #
   #    #  #   ##  #   #  #           #    #  #       #   ##  #    #  #    #
    ####   #    #  #  #    #          #####   ######  #    #   ####   #    #

   Version 5.1.3                      Based on the Byte Magazine Unix Benchmark

   Multi-CPU version                  Version 5 revisions by Ian Smith,
                                      Sunnyvale, CA, USA
   January 13, 2011                   johantheghost at yahoo period com

1 x Dhrystone 2 using register variables  1 2 3 4 5 6 7 8 9 10

1 x Double-Precision Whetstone  1 2 3 4 5 6 7 8 9 10

1 x Execl Throughput  1 2 3

1 x File Copy 1024 bufsize 2000 maxblocks  1 2 3

1 x File Copy 256 bufsize 500 maxblocks  1 2 3

1 x File Copy 4096 bufsize 8000 maxblocks  1 2 3

1 x Pipe Throughput  1 2 3 4 5 6 7 8 9 10

1 x Pipe-based Context Switching  1 2 3 4 5 6 7 8 9 10

1 x Process Creation  1 2 3

1 x System Call Overhead  1 2 3 4 5 6 7 8 9 10

1 x Shell Scripts (1 concurrent)  1 2 3

1 x Shell Scripts (8 concurrent)  1 2 3

4 x Dhrystone 2 using register variables  1 2 3 4 5 6 7 8 9 10

4 x Double-Precision Whetstone  1 2 3 4 5 6 7 8 9 10

4 x Execl Throughput  1 2 3

4 x File Copy 1024 bufsize 2000 maxblocks  1 2 3

4 x File Copy 256 bufsize 500 maxblocks  1 2 3

4 x File Copy 4096 bufsize 8000 maxblocks  1 2 3

4 x Pipe Throughput  1 2 3 4 5 6 7 8 9 10

4 x Pipe-based Context Switching  1 2 3 4 5 6 7 8 9 10

4 x Process Creation  1 2 3

4 x System Call Overhead  1 2 3 4 5 6 7 8 9 10

4 x Shell Scripts (1 concurrent)  1 2 3

4 x Shell Scripts (8 concurrent)  1 2 3

========================================================================
   BYTE UNIX Benchmarks (Version 5.1.3)

   System: vs1429.ams2.alvotech.de: GNU/Linux
   OS: GNU/Linux -- 2.6.36.1-vs2.3.0.36.38.build1-cti -- #5 SMP Fri Jul 29 16:54:05 EDT 2011
   Machine: x86_64 (unknown)
   Language: en_US.utf8 (charmap="UTF-8", collate="UTF-8")
   CPU 0: Intel(R) Xeon(R) CPU X3330 @ 2.66GHz (5333.5 bogomips)
          Hyper-Threading, x86-64, MMX, Physical Address Ext, SYSENTER/SYSEXIT, SYSCALL/SYSRET, Intel virtualization
   CPU 1: Intel(R) Xeon(R) CPU X3330 @ 2.66GHz (5333.7 bogomips)
          Hyper-Threading, x86-64, MMX, Physical Address Ext, SYSENTER/SYSEXIT, SYSCALL/SYSRET, Intel virtualization
   CPU 2: Intel(R) Xeon(R) CPU X3330 @ 2.66GHz (5333.7 bogomips)
          Hyper-Threading, x86-64, MMX, Physical Address Ext, SYSENTER/SYSEXIT, SYSCALL/SYSRET, Intel virtualization
   CPU 3: Intel(R) Xeon(R) CPU X3330 @ 2.66GHz (5333.7 bogomips)
          Hyper-Threading, x86-64, MMX, Physical Address Ext, SYSENTER/SYSEXIT, SYSCALL/SYSRET, Intel virtualization
   19:31:29 up 9 days,  4:47,  1 user,  load average: 0.01, 0.03, 0.00; runlevel 3

------------------------------------------------------------------------
Benchmark Run: Mon Aug 22 2011 19:31:29 - 19:59:43
4 CPUs in system; running 1 parallel copy of tests

Dhrystone 2 using register variables       10083482.9 lps   (10.0 s, 7 samples)
Double-Precision Whetstone                     1998.8 MWIPS (10.2 s, 7 samples)
Execl Throughput                               3528.0 lps   (29.8 s, 2 samples)
File Copy 1024 bufsize 2000 maxblocks        375937.0 KBps  (30.0 s, 2 samples)
File Copy 256 bufsize 500 maxblocks          118210.7 KBps  (30.0 s, 2 samples)
File Copy 4096 bufsize 8000 maxblocks        882344.0 KBps  (30.0 s, 2 samples)
Pipe Throughput                              793975.9 lps   (10.0 s, 7 samples)
Pipe-based Context Switching                 195507.5 lps   (10.0 s, 7 samples)
Process Creation                               9246.2 lps   (30.0 s, 2 samples)
Shell Scripts (1 concurrent)                   4436.1 lpm   (60.0 s, 2 samples)
Shell Scripts (8 concurrent)                    562.8 lpm   (60.1 s, 2 samples)
System Call Overhead                         650460.1 lps   (10.0 s, 7 samples)

System Benchmarks Index Values               BASELINE       RESULT    INDEX
Dhrystone 2 using register variables         116700.0   10083482.9    864.1
Double-Precision Whetstone                       55.0       1998.8    363.4
Execl Throughput                                 43.0       3528.0    820.5
File Copy 1024 bufsize 2000 maxblocks          3960.0     375937.0    949.3
File Copy 256 bufsize 500 maxblocks            1655.0     118210.7    714.3
File Copy 4096 bufsize 8000 maxblocks          5800.0     882344.0   1521.3
Pipe Throughput                               12440.0     793975.9    638.2
Pipe-based Context Switching                   4000.0     195507.5    488.8
Process Creation                                126.0       9246.2    733.8
Shell Scripts (1 concurrent)                     42.4       4436.1   1046.3
Shell Scripts (8 concurrent)                      6.0        562.8    938.1
System Call Overhead                          15000.0     650460.1    433.6
                                                                   ========
System Benchmarks Index Score                                         737.5

------------------------------------------------------------------------
Benchmark Run: Mon Aug 22 2011 19:59:43 - 20:33:51
4 CPUs in system; running 4 parallel copies of tests

Dhrystone 2 using register variables        9966870.5 lps   (10.0 s, 7 samples)
Double-Precision Whetstone                     7344.9 MWIPS (10.2 s, 7 samples)
Execl Throughput                               3543.0 lps   (29.8 s, 2 samples)
File Copy 1024 bufsize 2000 maxblocks        379596.0 KBps  (30.0 s, 2 samples)
File Copy 256 bufsize 500 maxblocks          117231.0 KBps  (30.0 s, 2 samples)
File Copy 4096 bufsize 8000 maxblocks        883001.7 KBps  (30.1 s, 2 samples)
Pipe Throughput                              790522.2 lps   (10.0 s, 7 samples)
Pipe-based Context Switching                 175325.0 lps   (10.0 s, 7 samples)
Process Creation                               8965.0 lps   (30.0 s, 2 samples)
Shell Scripts (1 concurrent)                   4329.2 lpm   (60.0 s, 2 samples)
Shell Scripts (8 concurrent)                    548.0 lpm   (60.1 s, 2 samples)
System Call Overhead                         649982.3 lps   (10.0 s, 7 samples)

System Benchmarks Index Values               BASELINE       RESULT    INDEX
Dhrystone 2 using register variables         116700.0    9966870.5    854.1
Double-Precision Whetstone                       55.0       7344.9   1335.4
Execl Throughput                                 43.0       3543.0    823.9
File Copy 1024 bufsize 2000 maxblocks          3960.0     379596.0    958.6
File Copy 256 bufsize 500 maxblocks            1655.0     117231.0    708.3
File Copy 4096 bufsize 8000 maxblocks          5800.0     883001.7   1522.4
Pipe Throughput                               12440.0     790522.2    635.5
Pipe-based Context Switching                   4000.0     175325.0    438.3
Process Creation                                126.0       8965.0    711.5
Shell Scripts (1 concurrent)                     42.4       4329.2   1021.0
Shell Scripts (8 concurrent)                      6.0        548.0    913.4
System Call Overhead                          15000.0     649982.3    433.3
                                                                   ========
System Benchmarks Index Score                                         808.3
Repeating the test again does not seems to be a lot better:
   #    #  #    #  #  #    #          #####   ######  #    #   ####   #    #
   #    #  ##   #  #   #  #           #    #  #       ##   #  #    #  #    #
   #    #  # #  #  #    ##            #####   #####   # #  #  #       ######
   #    #  #  # #  #    ##            #    #  #       #  # #  #       #    #
   #    #  #   ##  #   #  #           #    #  #       #   ##  #    #  #    #
    ####   #    #  #  #    #          #####   ######  #    #   ####   #    #

   Version 5.1.3                      Based on the Byte Magazine Unix Benchmark

   Multi-CPU version                  Version 5 revisions by Ian Smith,
                                      Sunnyvale, CA, USA
   January 13, 2011                   johantheghost at yahoo period com

1 x Dhrystone 2 using register variables  1 2 3 4 5 6 7 8 9 10

1 x Double-Precision Whetstone  1 2 3 4 5 6 7 8 9 10

1 x Execl Throughput  1 2 3

1 x File Copy 1024 bufsize 2000 maxblocks  1 2 3

1 x File Copy 256 bufsize 500 maxblocks  1 2 3

1 x File Copy 4096 bufsize 8000 maxblocks  1 2 3

1 x Pipe Throughput  1 2 3 4 5 6 7 8 9 10

1 x Pipe-based Context Switching  1 2 3 4 5 6 7 8 9 10

1 x Process Creation  1 2 3

1 x System Call Overhead  1 2 3 4 5 6 7 8 9 10

1 x Shell Scripts (1 concurrent)  1 2 3

1 x Shell Scripts (8 concurrent)  1 2 3

4 x Dhrystone 2 using register variables  1 2 3 4 5 6 7 8 9 10

4 x Double-Precision Whetstone  1 2 3 4 5 6 7 8 9 10

4 x Execl Throughput  1 2 3

4 x File Copy 1024 bufsize 2000 maxblocks  1 2 3

4 x File Copy 256 bufsize 500 maxblocks  1 2 3

4 x File Copy 4096 bufsize 8000 maxblocks  1 2 3

4 x Pipe Throughput  1 2 3 4 5 6 7 8 9 10

4 x Pipe-based Context Switching  1 2 3 4 5 6 7 8 9 10

4 x Process Creation  1 2 3

4 x System Call Overhead  1 2 3 4 5 6 7 8 9 10

4 x Shell Scripts (1 concurrent)  1 2 3

4 x Shell Scripts (8 concurrent)  1 2 3

========================================================================
   BYTE UNIX Benchmarks (Version 5.1.3)

   System: vs1429.ams2.alvotech.de: GNU/Linux
   OS: GNU/Linux -- 2.6.36.1-vs2.3.0.36.38.build1-cti -- #5 SMP Fri Jul 29 16:54:05 EDT 2011
   Machine: x86_64 (unknown)
   Language: en_US.utf8 (charmap="UTF-8", collate="UTF-8")
   CPU 0: Intel(R) Xeon(R) CPU X3330 @ 2.66GHz (5333.5 bogomips)
          Hyper-Threading, x86-64, MMX, Physical Address Ext, SYSENTER/SYSEXIT, SYSCALL/SYSRET, Intel virtualization
   CPU 1: Intel(R) Xeon(R) CPU X3330 @ 2.66GHz (5333.7 bogomips)
          Hyper-Threading, x86-64, MMX, Physical Address Ext, SYSENTER/SYSEXIT, SYSCALL/SYSRET, Intel virtualization
   CPU 2: Intel(R) Xeon(R) CPU X3330 @ 2.66GHz (5333.7 bogomips)
          Hyper-Threading, x86-64, MMX, Physical Address Ext, SYSENTER/SYSEXIT, SYSCALL/SYSRET, Intel virtualization
   CPU 3: Intel(R) Xeon(R) CPU X3330 @ 2.66GHz (5333.7 bogomips)
          Hyper-Threading, x86-64, MMX, Physical Address Ext, SYSENTER/SYSEXIT, SYSCALL/SYSRET, Intel virtualization
   20:55:05 up 9 days,  6:10,  1 user,  load average: 0.93, 0.74, 2.13; runlevel 3

------------------------------------------------------------------------
Benchmark Run: Mon Aug 22 2011 20:55:05 - 21:23:18
4 CPUs in system; running 1 parallel copy of tests

Dhrystone 2 using register variables       10074456.3 lps   (10.0 s, 7 samples)
Double-Precision Whetstone                     1892.0 MWIPS (10.2 s, 7 samples)
Execl Throughput                               3526.2 lps   (29.8 s, 2 samples)
File Copy 1024 bufsize 2000 maxblocks        377610.0 KBps  (30.0 s, 2 samples)
File Copy 256 bufsize 500 maxblocks          118985.3 KBps  (30.0 s, 2 samples)
File Copy 4096 bufsize 8000 maxblocks        895598.1 KBps  (30.1 s, 2 samples)
Pipe Throughput                              795781.7 lps   (10.0 s, 7 samples)
Pipe-based Context Switching                 196634.9 lps   (10.0 s, 7 samples)
Process Creation                               9165.0 lps   (30.0 s, 2 samples)
Shell Scripts (1 concurrent)                   4435.2 lpm   (60.0 s, 2 samples)
Shell Scripts (8 concurrent)                    561.9 lpm   (60.1 s, 2 samples)
System Call Overhead                         650272.1 lps   (10.0 s, 7 samples)

System Benchmarks Index Values               BASELINE       RESULT    INDEX
Dhrystone 2 using register variables         116700.0   10074456.3    863.3
Double-Precision Whetstone                       55.0       1892.0    344.0
Execl Throughput                                 43.0       3526.2    820.0
File Copy 1024 bufsize 2000 maxblocks          3960.0     377610.0    953.6
File Copy 256 bufsize 500 maxblocks            1655.0     118985.3    718.9
File Copy 4096 bufsize 8000 maxblocks          5800.0     895598.1   1544.1
Pipe Throughput                               12440.0     795781.7    639.7
Pipe-based Context Switching                   4000.0     196634.9    491.6
Process Creation                                126.0       9165.0    727.4
Shell Scripts (1 concurrent)                     42.4       4435.2   1046.0
Shell Scripts (8 concurrent)                      6.0        561.9    936.5
System Call Overhead                          15000.0     650272.1    433.5
                                                                   ========
System Benchmarks Index Score                                         735.5

------------------------------------------------------------------------
Benchmark Run: Mon Aug 22 2011 21:23:18 - 21:57:28
4 CPUs in system; running 4 parallel copies of tests

Dhrystone 2 using register variables        9951860.4 lps   (10.0 s, 7 samples)
Double-Precision Whetstone                     7668.4 MWIPS (10.2 s, 7 samples)
Execl Throughput                               3524.6 lps   (29.8 s, 2 samples)
File Copy 1024 bufsize 2000 maxblocks        379597.2 KBps  (30.0 s, 2 samples)
File Copy 256 bufsize 500 maxblocks          116882.1 KBps  (30.0 s, 2 samples)
File Copy 4096 bufsize 8000 maxblocks        889780.8 KBps  (30.0 s, 2 samples)
Pipe Throughput                              788264.1 lps   (10.0 s, 7 samples)
Pipe-based Context Switching                 175078.8 lps   (10.0 s, 7 samples)
Process Creation                               9087.9 lps   (30.0 s, 2 samples)
Shell Scripts (1 concurrent)                   4349.7 lpm   (60.0 s, 2 samples)
Shell Scripts (8 concurrent)                    549.4 lpm   (60.3 s, 2 samples)
System Call Overhead                         649816.7 lps   (10.0 s, 7 samples)

System Benchmarks Index Values               BASELINE       RESULT    INDEX
Dhrystone 2 using register variables         116700.0    9951860.4    852.8
Double-Precision Whetstone                       55.0       7668.4   1394.3
Execl Throughput                                 43.0       3524.6    819.7
File Copy 1024 bufsize 2000 maxblocks          3960.0     379597.2    958.6
File Copy 256 bufsize 500 maxblocks            1655.0     116882.1    706.2
File Copy 4096 bufsize 8000 maxblocks          5800.0     889780.8   1534.1
Pipe Throughput                               12440.0     788264.1    633.7
Pipe-based Context Switching                   4000.0     175078.8    437.7
Process Creation                                126.0       9087.9    721.3
Shell Scripts (1 concurrent)                     42.4       4349.7   1025.9
Shell Scripts (8 concurrent)                      6.0        549.4    915.7
System Call Overhead                          15000.0     649816.7    433.2
                                                                   ========
System Benchmarks Index Score                                         812.2
GeekBench results shows somewhat better score with above 2000 points:
System Information
  Platform:                  Linux x86 (32-bit)
  Compiler:                  GCC 4.1.2 20070925 (Red Hat 4.1.2-33)
  Operating System:          Linux 2.6.36.1-vs2.3.0.36.38.build1-cti x86_64
  Model:                     Linux PC (Intel(R) Xeon(R) CPU           X3330  @ 2                                                                                                 .66GHz)
  Motherboard:               Unknown Motherboard
  Processor:                 Intel(R) Xeon(R) CPU           X3330  @ 2.66GHz
  Processor ID:              GenuineIntel Family 6 Model 23 Stepping 10
  Logical Processors:        4
  Physical Processors:       1
  Processor Frequency:       2.67 GHz
  L1 Instruction Cache:      0.00 B
  L1 Data Cache:             0.00 B
  L2 Cache:                  3.00 MB
  L3 Cache:                  0.00 B
  Bus Frequency:             0.00 Hz
  Memory:                    512 MB
  Memory Type:               N/A
  SIMD:                      1
  BIOS:                      N/A
  Processor Model:           Intel(R) Xeon(R) CPU           X3330  @ 2.66GHz
  Processor Cores:           4

Integer
  Blowfish
    single-threaded scalar    1426 |||||
    multi-threaded scalar     1526 ||||||
  Text Compress
    single-threaded scalar    1612 ||||||
    multi-threaded scalar     1552 ||||||
  Text Decompress
    single-threaded scalar    1463 |||||
    multi-threaded scalar     1503 ||||||
  Image Compress
    single-threaded scalar    1383 |||||
    multi-threaded scalar     1360 |||||
  Image Decompress
    single-threaded scalar    1214 ||||
    multi-threaded scalar     1247 ||||
  Lua
    single-threaded scalar    2684 ||||||||||
    multi-threaded scalar     2648 ||||||||||

Floating Point
  Mandelbrot
    single-threaded scalar    1494 |||||
    multi-threaded scalar     1519 ||||||
  Dot Product
    single-threaded scalar    2736 ||||||||||
    multi-threaded scalar     2901 |||||||||||
    single-threaded vector    1967 |||||||
    multi-threaded vector     2301 |||||||||
  LU Decomposition
    single-threaded scalar    1717 ||||||
    multi-threaded scalar     1780 |||||||
  Primality Test
    single-threaded scalar    2342 |||||||||
    multi-threaded scalar     1877 |||||||
  Sharpen Image
    single-threaded scalar    4878 |||||||||||||||||||
    multi-threaded scalar     4920 |||||||||||||||||||
  Blur Image
    single-threaded scalar    3542 ||||||||||||||
    multi-threaded scalar     3563 ||||||||||||||

Memory
  Read Sequential
    single-threaded scalar    3791 |||||||||||||||
  Write Sequential
    single-threaded scalar    3800 |||||||||||||||
  Stdlib Allocate
    single-threaded scalar    1817 |||||||
  Stdlib Write
    single-threaded scalar    1894 |||||||
  Stdlib Copy
    single-threaded scalar    3590 ||||||||||||||

Stream
  Stream Copy
    single-threaded scalar    2312 |||||||||
    single-threaded vector    2458 |||||||||
  Stream Scale
    single-threaded scalar    2444 |||||||||
    single-threaded vector    2363 |||||||||
  Stream Add
    single-threaded scalar    2448 |||||||||
    single-threaded vector    2665 ||||||||||
  Stream Triad
    single-threaded scalar    2663 ||||||||||
    single-threaded vector    1938 |||||||

Integer Score:                1634 ||||||
Floating Point Score:         2681 ||||||||||
Memory Score:                 2978 |||||||||||
Stream Score:                 2411 |||||||||

Overall Geekbench Score:      2346 |||||||||
Running it later on, strangely, gave exactly the same overall score, which at least shows the performance is consistent:
System Information
  Platform:                  Linux x86 (32-bit)
  Compiler:                  GCC 4.1.2 20070925 (Red Hat 4.1.2-33)
  Operating System:          Linux 2.6.36.1-vs2.3.0.36.38.build1-cti x86_64
  Model:                     Linux PC (Intel(R) Xeon(R) CPU           X3330  @ 2.66GHz)
  Motherboard:               Unknown Motherboard
  Processor:                 Intel(R) Xeon(R) CPU           X3330  @ 2.66GHz
  Processor ID:              GenuineIntel Family 6 Model 23 Stepping 10
  Logical Processors:        4
  Physical Processors:       1
  Processor Frequency:       2.67 GHz
  L1 Instruction Cache:      0.00 B
  L1 Data Cache:             0.00 B
  L2 Cache:                  3.00 MB
  L3 Cache:                  0.00 B
  Bus Frequency:             0.00 Hz
  Memory:                    512 MB
  Memory Type:               N/A
  SIMD:                      1
  BIOS:                      N/A
  Processor Model:           Intel(R) Xeon(R) CPU           X3330  @ 2.66GHz
  Processor Cores:           4

Integer
  Blowfish
    single-threaded scalar    1424 |||||
    multi-threaded scalar     1526 ||||||
  Text Compress
    single-threaded scalar    1613 ||||||
    multi-threaded scalar     1551 ||||||
  Text Decompress
    single-threaded scalar    1461 |||||
    multi-threaded scalar     1499 |||||
  Image Compress
    single-threaded scalar    1383 |||||
    multi-threaded scalar     1359 |||||
  Image Decompress
    single-threaded scalar    1216 ||||
    multi-threaded scalar     1248 ||||
  Lua
    single-threaded scalar    2677 ||||||||||
    multi-threaded scalar     2649 ||||||||||

Floating Point
  Mandelbrot
    single-threaded scalar    1495 |||||
    multi-threaded scalar     1519 ||||||
  Dot Product
    single-threaded scalar    2735 ||||||||||
    multi-threaded scalar     2900 |||||||||||
    single-threaded vector    1968 |||||||
    multi-threaded vector     2303 |||||||||
  LU Decomposition
    single-threaded scalar    1718 ||||||
    multi-threaded scalar     1786 |||||||
  Primality Test
    single-threaded scalar    2342 |||||||||
    multi-threaded scalar     1878 |||||||
  Sharpen Image
    single-threaded scalar    4872 |||||||||||||||||||
    multi-threaded scalar     4922 |||||||||||||||||||
  Blur Image
    single-threaded scalar    3543 ||||||||||||||
    multi-threaded scalar     3562 ||||||||||||||

Memory
  Read Sequential
    single-threaded scalar    3786 |||||||||||||||
  Write Sequential
    single-threaded scalar    3808 |||||||||||||||
  Stdlib Allocate
    single-threaded scalar    1822 |||||||
  Stdlib Write
    single-threaded scalar    1890 |||||||
  Stdlib Copy
    single-threaded scalar    3609 ||||||||||||||

Stream
  Stream Copy
    single-threaded scalar    2288 |||||||||
    single-threaded vector    2444 |||||||||
  Stream Scale
    single-threaded scalar    2393 |||||||||
    single-threaded vector    2377 |||||||||
  Stream Add
    single-threaded scalar    2416 |||||||||
    single-threaded vector    2764 |||||||||||
  Stream Triad
    single-threaded scalar    2588 ||||||||||
    single-threaded vector    1931 |||||||

Integer Score:                1633 ||||||
Floating Point Score:         2681 ||||||||||
Memory Score:                 2983 |||||||||||
Stream Score:                 2400 |||||||||

Overall Geekbench Score:      2346 |||||||||
Customer Service And Support
If you have looked at the screenshots taken in the control panel above, you probably have noticed that there is nowhere for you to submit a ticket. In fact, only the following contact methods are available during the “working hours”:

Although it seems that they have an internal ticketing system since every time I have send support an email, there is always a ticket number in the reply, quite frankly speaking, I prefer to just reply emails for support questions rather than having to log into the provider’s WHMCS site every time I get a reply notification and find the ticket in question and reply it back. Unfortunately, majority of the providers using WHMCS do not offer that feature (Quickweb is one that I know does, and may be a few others), and it would be great if WHMCS could make it an default option.
Anyways, the ticket reply time varies for Alvotech, one of my ticket send in at 11:53AM was responded at 12:35PM, barely 42 minutes, and another one that I have sent in at 3:32AM was not replied at 5:24PM the next day. Having said that, considering these are all budget plans, I think the response time are definitely reasonable.
Conclusion
The network provided by Alvotech is definitely great, and unmetered bandwidth definitely make it useful for tasks that requires heavy uploading and downloading. The minimal OS template indeed use a minimal amount of resources, which, although we have 512MB of RAM to play around with even with the smallest plan, is always a good to have. Although the benchmarks scores are not that high because disk I/O is perhaps at the low end of acceptable range, I would still think it is a good VPS for tasks that require heavy usage of the Internet.
> The server is using Linux VServer virtualization technology, which is rare among the low end providers but
>does provide full virtualization.
This is incorrect, it does not.
@rm: You are correct, sorry I made a mistake there:
here is what I see on http://linux-vserver.org/Welcome_to_Linux-VServer.org
utilize available resources efficiently, as they run on the same kernel.
Right 🙂
People diss Linux-VServer (and even OpenVZ, but that’s another story), calling it “glorified chroot”, but while it has some limitations (mostly network-wise) it does allow very efficient use of node’s RAM and CPU, much more so than Xen or KVM.
@rm: that is interesting, do you know what are the advantages and disadvantages of OVZ as compered to vServer?
OpenVZ
+ can request proper tun device and use sit IPv6 tunnels and PPTP or other types of VPN
– most OVZ hosters use the ancient 2.6.18 kernel
– memory limiting model (userbeancounters) is bad and means you sometimes can’t fully utilize all of your guaranteed memory; this is solved only with the new OpenVZ vswap, but afaik just one LEB provider implemented it yet (QualityServers).
VServer
– very limited tun device, IPv6 tunnels can’t be used
– doubt that even PPTP/VPN can be used easily
– programs which need raw sockets (like mtr) can’t be used
– ifconfig eth0 shows traffic usage for the whole node (can’t use programs like vnstat)
– dunno what else. Mostly the limited access to low-level networking.
@rm: You are correct, I just ran the ifconfig on this box out of curiosity:
And modprobe does not show anything as well, so I guess you are correct with the TUN devices, wondering when would people able to put openVPN on it 🙂
Linux Vserver is just like BSD Jails or OpenVZ or Virtuozzo (the OpenVZ commercial brother) just an OS-Virtualisation. In contrast to Xen which is a classic hypervisor. However, OS-Virtualisation safes ressources. And the Vserver allowes in detail management of ressources.
Btw, you are right with your assumption concerning the German text.
@Skagerrak: Thanks, I was just guessing based on the 24, so I figured there might be a good chance I am wrong, but I guess I was just lucky on the translation part 🙂
On the detail management of resources point, is it from the node perspective or from the individual VPS user’s perspective? I have not found too much differences as an individual user, so I guess basically you mean on the node, you can pretty much tweak anything you like?