
96MB Low End VPS Review Part XVI – Tailored VPS
Jay from Tailored VPS emailed me and would like me to write a review about them. Although I do all my reviews for free (in fact, for some of the more notable names, I even paid out of my own pocket to purchase the VPS), I am always happy to see business requesting reviews since that shows at least the owners of those business cares and are serious about running a VPS business. Therefore, I happily agreed upon the condition that I pay and sign up the VPS just like an ordinary customer of theirs, so…here it goes:
General Information and Set Up
TailoredVPS has just had their domain registered in February 2011, and according to their domain whois information that I have obtained via this checker, is based in Port Coquitlam, British Columbia in Canada, although their servers seem to be based in Philadelphia in US.
As per Tailored VPS WHT advertisement, here are the specifications of the VPS:

I was curious to see how “Tailored” they are when it comes to Tailored VPS and the answer shows up as soon as I started the ordering process on a secured HTTP web page:
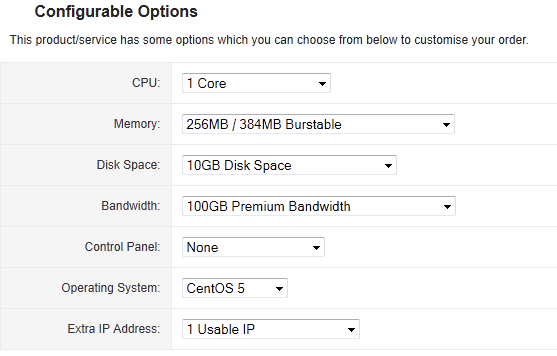
Basically, pretty much every resources on the VPS could be configured to suit your needs exactly. For example, by default, the CPU is one core, however you can add it to 4 cores maximum, memory by default is 256MB, however it could go as high as 4096MB dedicated for an extra 52 dollars per months. The only major part that can not be upgraded here is the port speed, where you have to use the 100Mbit port.
It is also interesting to note that they have a pretty strict SLA, which will give 1 day of credit for more than an hour of unexpected downtime, which is seems to be rather assuring.
Provision is instant. I paid via Paypal at 1:48PM and the VPS information email, which contained all the password in plain text, came in the same minute (a good sign since I really don’t want to be treated any differently than other customers).
After login through their secured HTTPs interface, here is what I see the information related to my VPS, note that besides the basic control and resources usage percentage bars, the Tailored VPS Control actually give the resources graphs as well, which does not really happen that frequently among the providers.
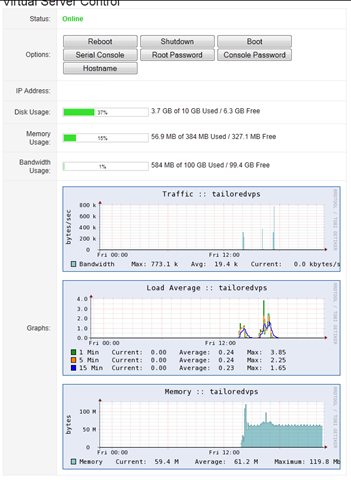
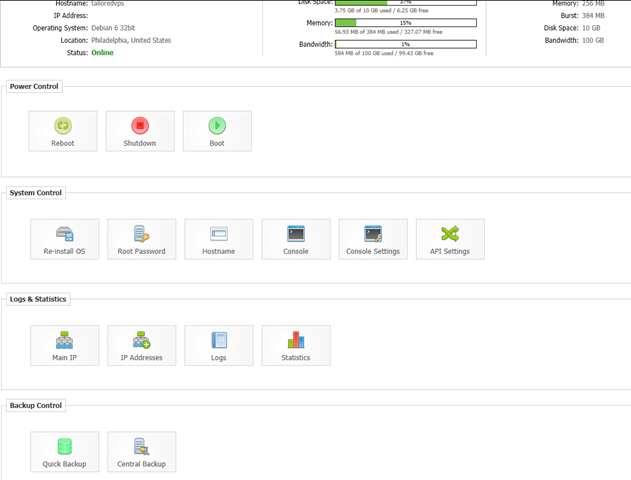
The SolusVM login is using HTTPS on a non-standard HTTPS port and after login using the assigned username. It is a standard SolusVM set up with no instant rDNS and both backup functionalities are not enabled:
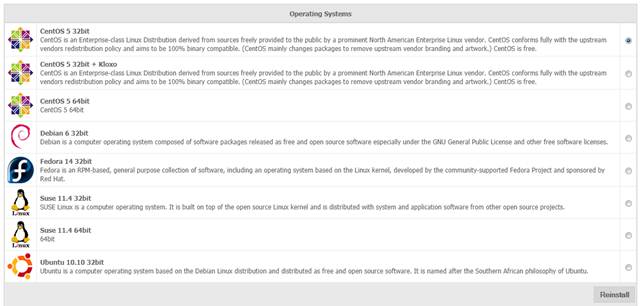
They have a pretty “standard” list of OS template as well, covering most of the major Linux distributions and is pretty up to date considering it has Debian 6, although I would say the latest major OS release in Linux world is CentOS 6, which they do not have here:
Test on the VPS
The VPS that I have received has 1 CPU core, 256 dedicated/384 burstable RAM and is located Philadelphia, US in the data centre of Telecom Colocation.
Without any application installed, the default Debian template uses about 16MB of RAM:
free -m
             total       used       free     shared    buffers     cached
Mem:           384         16        367          0          0          0
-/+ buffers/cache:         16        367
Swap:            0          0          0
And the corresponding top output shows a pretty much default setup:
top - 22:00:10 up 11 min,  1 user,  load average: 0.00, 0.00, 0.00
Tasks:  18 total,   2 running,  16 sleeping,   0 stopped,   0 zombie
Cpu(s):  0.0%us,  0.0%sy,  0.0%ni,100.0%id,  0.0%wa,  0.0%hi,  0.0%si,  0.0%st
Mem:    393216k total,    20020k used,   373196k free,        0k buffers
Swap:        0k total,        0k used,        0k free,        0k cached

  PID USER      PR  NI  VIRT  RES  SHR S %CPU %MEM    TIME+  COMMAND
 1636 root      18   0  8752 3112 2468 R  0.0  0.8   0:00.12 sshd
 1373 root      18   0  5132 2428 1180 S  0.0  0.6   0:00.00 apache2
 1661 smmsp     22   0  8216 2396 1684 S  0.0  0.6   0:00.00 sendmail-msp
 1374 www-data  25   0  5132 1836  580 S  0.0  0.5   0:00.00 apache2
 1638 root      15   0  2956 1628 1304 S  0.0  0.4   0:00.00 bash
 1566 root      15   0  9960 1536  496 S  0.0  0.4   0:00.00 sendmail-mta
 1646 smmsp     22   0  2936 1468 1000 S  0.0  0.4   0:00.01 sendmail
 1644 root      18   0  2828 1112  844 S  0.0  0.3   0:00.00 cron
 1664 root      15   0  2324 1064  872 R  0.0  0.3   0:00.00 top
 1645 smmsp     22   0  2612 1060  912 S  0.0  0.3   0:00.00 sh
 1581 root      18   0  5484  988  600 S  0.0  0.3   0:00.00 sshd
 1395 root      18   0  2284  844  660 S  0.0  0.2   0:00.00 cron
 1540 root      25   0  2388  836  668 S  0.0  0.2   0:00.00 xinetd
 1351 root      18   0  8664  788  448 S  0.0  0.2   0:00.00 saslauthd
 1363 root      18   0  1888  776  648 S  0.0  0.2   0:00.00 anacron
    1 root      18   0  2024  676  584 S  0.0  0.2   0:01.32 init
 1359 root      15   0  1732  632  504 S  0.0  0.2   0:00.00 syslogd
Once the LNMP stack is installed, memory usage goes up to 65MB, which is pretty good:
free -m
             total       used       free     shared    buffers     cached
Mem:           384         65        318          0          0          0
-/+ buffers/cache:         65        318
Swap:            0          0          0
And again, the corresponding top output:
top - 04:00:59 up  2:12,  1 user,  load average: 0.00, 0.00, 0.00
Tasks:  25 total,   2 running,  23 sleeping,   0 stopped,   0 zombie
Cpu(s):  0.0%us,  0.0%sy,  0.0%ni,100.0%id,  0.0%wa,  0.0%hi,  0.0%si,  0.0%st
Mem:    393216k total,    67064k used,   326152k free,        0k buffers
Swap:        0k total,        0k used,        0k free,        0k cached

  PID USER      PR  NI  VIRT  RES  SHR S %CPU %MEM    TIME+  COMMAND
27927 www       25   0 14492  10m  412 S  0.0  2.7   0:00.01 nginx
15744 mysql     18   0 34792 5828 3152 S  0.0  1.5   0:00.01 mysqld
27915 root      15   0 22700 4540 1380 S  0.0  1.2   0:00.01 php-cgi
27916 www       24   0 22700 4160 1000 S  0.0  1.1   0:00.00 php-cgi
27917 www       25   0 22700 4160 1000 S  0.0  1.1   0:00.00 php-cgi
27918 www       25   0 22700 4160 1000 S  0.0  1.1   0:00.00 php-cgi
27922 www       25   0 22700 4160 1000 S  0.0  1.1   0:00.00 php-cgi
27923 www       25   0 22700 4160 1000 S  0.0  1.1   0:00.00 php-cgi
28087 root      16   0  8752 3116 2472 R  0.0  0.8   0:00.12 sshd
28084 smmsp     24   0  8212 2420 1708 S  0.0  0.6   0:00.00 sendmail-msp
28089 root      15   0  2956 1612 1292 S  0.0  0.4   0:00.00 bash
 1566 root      15   0  9960 1540  500 S  0.0  0.4   0:00.00 sendmail-mta
28069 smmsp     21   0  2936 1472 1000 S  0.0  0.4   0:00.01 sendmail
15641 root      25   0  2672 1204 1000 S  0.0  0.3   0:00.01 mysqld_safe
28067 root      15   0  2828 1112  844 S  0.0  0.3   0:00.00 cron
28095 root      15   0  2324 1076  876 R  0.0  0.3   0:00.00 top
28068 smmsp     15   0  2612 1056  912 S  0.0  0.3   0:00.00 sh
vmfree shows the RAM is not oversold:
 vzfree
             Total     Used     Free
Kernel:   2048.00M    2.93M 2045.07M
Allocate:  384.00M   62.14M  321.86M (256M Guaranteed)
Commit:    256.00M   30.94M  225.06M (45.1% of Allocated)
Swap:                 0.00M          (0.0% of Committed)
df commands shows the hard drive space is not oversold:
 df -i
Filesystem            Inodes   IUsed   IFree IUse% Mounted on
/dev/simfs           5242880   69565 5173315    2% /
tmpfs                  49152       4   49148    1% /lib/init/rw
tmpfs                  49152       1   49151    1% /dev/shm
df -h
Filesystem            Size  Used Avail Use% Mounted on
/dev/simfs             10G  1.7G  8.4G  17% /
tmpfs                 192M     0  192M   0% /lib/init/rw
tmpfs                 192M     0  192M   0% /dev/shm
vmstat actually shows the idle percentage time is pretty low:
 vmstat
procs -----------memory---------- ---swap-- -----io---- -system-- ----cpu----
 r  b   swpd   free   buff  cache   si   so    bi    bo   in   cs us sy id wa
 0  0      0 329392      0      0    0    0     0   242    0  679 19  5 76  0
However, I suspect it was due to the initial set up that I ran, the usage stabilized soon after I ran uptime:
uptime
 04:02:18 up  2:13,  1 user,  load average: 0.00, 0.00, 0.00
And re-running vmstat after a while showed a much better picture:
vmstat
procs -----------memory---------- ---swap-- -----io---- -system-- ----cpu----
 r  b   swpd   free   buff  cache   si   so    bi    bo   in   cs us sy id wa
 0  0      0 328156      0      0    0    0     0    12    0   91  1  0 99  0
And the corresponding uptime seems to show the box is very lightly used:
20:05:08 up 5 days, 6:16, 1 user, load average: 0.00, 0.00, 0.00
Beancounters have pretty “standard” values considering the size of the VPS:
 cat /proc/user_beancounters
Version: 2.5
       uid  resource                     held              maxheld              barrier                limit              failcnt
      170:  kmemsize                  3057997              3635606           2147483646           2147483646                    0
            lockedpages                     0                    0               999999               999999                    0
            privvmpages                 15913                37524                98304                98304                    0
            shmpages                      642                  672                65536                65536                    0
            dummy                           0                    0                    0                    0                    0
            numproc                        22                   30               999999               999999                    0
            physpages                    7176                34834                    0           2147483647                    0
            vmguarpages                     0                    0                65536           2147483647                    0
            oomguarpages                 7176                34834                65536           2147483647                    0
            numtcpsock                      6                    8              7999992              7999992                    0
            numflock                        4                   10               999999               999999                    0
            numpty                          1                    2               500000               500000                    0
            numsiginfo                      0                    3               999999               999999                    0
            tcpsndbuf                  107352               212376            214748160            396774400                    0
            tcprcvbuf                   98304              3731504            214748160            396774400                    0
            othersockbuf                11640                30400            214748160            396774400                    0
            dgramrcvbuf                     0                 8472            214748160            396774400                    0
            numothersock                   14                   19              7999992              7999992                    0
            dcachesize                 244140               261981           2147483646           2147483646                    0
            numfile                       522                  615             23999976             23999976                    0
            dummy                           0                    0                    0                    0                    0
            dummy                           0                    0                    0                    0                    0
            dummy                           0                    0                    0                    0                    0
            numiptent                      14                   14               999999               999999                    0
Hard drive I/O was a little lagging:
dd if=/dev/zero of=test bs=64k count=16k conv=fdatasync
16384+0 records in
16384+0 records out
1073741824 bytes (1.1 GB) copied, 36.3871 s, 29.5 MB/s
And the repeated test did not show any better result:
dd if=/dev/zero of=test bs=64k count=16k conv=fdatasync
16384+0 records in
16384+0 records out
1073741824 bytes (1.1 GB) copied, 36.1456 s, 29.7 MB/s
After being told that my I/O priority was upgraded, there did not seem to be too much change to disk I/O:
 dd if=/dev/zero of=test bs=64k count=16k conv=fdatasync
16384+0 records in
16384+0 records out
1073741824 bytes (1.1 GB) copied, 39.6171 s, 27.1 MB/s
One CPU core is offered in this particular VPS, and the CPU is an Opteron 285:
 cat /proc/cpuinfo
processor       : 0
vendor_id       : AuthenticAMD
cpu family      : 15
model           : 33
model name      : Dual Core AMD Opteron(tm) Processor 285
stepping        : 2
cpu MHz         : 2589.421
cache size      : 1024 KB
physical id     : 0
siblings        : 2
core id         : 0
cpu cores       : 2
apicid          : 0
fpu             : yes
fpu_exception   : yes
cpuid level     : 1
wp              : yes
flags           : fpu vme de pse tsc msr pae mce cx8 apic sep mtrr pge mca cmov                                                                              pat pse36 clflush mmx fxsr sse sse2 ht syscall nx mmxext fxsr_opt lm 3dnowext 3d                                                                             now pni lahf_lm cmp_legacy
bogomips        : 5178.84
TLB size        : 1024 4K pages
clflush size    : 64
cache_alignment : 64
address sizes   : 40 bits physical, 48 bits virtual
power management: ts fid vid ttp
And the meminfo indicated the RAM are not oversold:
cat /proc/meminfo
MemTotal:       393216 kB
MemFree:        329204 kB
Buffers:             0 kB
Cached:              0 kB
SwapCached:          0 kB
Active:              0 kB
Inactive:            0 kB
HighTotal:           0 kB
HighFree:            0 kB
LowTotal:       393216 kB
LowFree:        329204 kB
SwapTotal:           0 kB
SwapFree:            0 kB
Dirty:           94120 kB
Writeback:           0 kB
AnonPages:           0 kB
Mapped:              0 kB
Slab:                0 kB
PageTables:          0 kB
NFS_Unstable:        0 kB
Bounce:              0 kB
CommitLimit:         0 kB
Committed_AS:        0 kB
VmallocTotal:        0 kB
VmallocUsed:         0 kB
VmallocChunk:        0 kB
HugePages_Total:     0
HugePages_Free:      0
HugePages_Rsvd:      0
Hugepagesize:     2048 kB
For a 100Mbps port, the download speed from Cachefly is just OK:
wget cachefly.cachefly.net/100mb.test
--2011-07-30 04:07:26--  http://cachefly.cachefly.net/100mb.test
Resolving cachefly.cachefly.net... 205.234.175.175
Connecting to cachefly.cachefly.net|205.234.175.175|:80... connected.
HTTP request sent, awaiting response... 200 OK
Length: 104857600 (100M) [application/octet-stream]
Saving to: `100mb.test'

100%[======================================>] 104,857,600 5.20M/s   in 19s

2011-07-30 04:07:45 (5.31 MB/s) - `100mb.test' saved [104857600/104857600]
The upload speed are comparable to the download speed:
From my BuyVM box from Fremont, CA:
wget 69.55.14.79/100mb.test
--2011-07-30 05:19:36--  http://69.55.14.79/100mb.test
Connecting to 69.55.14.79:80... connected.
HTTP request sent, awaiting response... 200 OK
Length: 104857600 (100M) [application/octet-stream]
Saving to: `100mb.test'

100%[======================================>] 104,857,600 3.70M/s   in 29s

2011-07-30 05:20:06 (3.44 MB/s) - `100mb.test' saved [104857600/104857600]
Nix Communications VPS from Montreal, Canada seems to be a little better:
wget 69.55.14.79/100mb.test
--2011-07-30 01:21:02--  http://69.55.14.79/100mb.test
Connecting to 69.55.14.79:80... connected.
HTTP request sent, awaiting response... 200 OK
Length: 104857600 (100M) [application/octet-stream]
Saving to: `100mb.test'

100%[======================================>] 104,857,600 4.86M/s   in 19s

2011-07-30 01:21:22 (5.22 MB/s) - `100mb.test' saved [104857600/104857600]
Finally, Quickweb VPS in London, UK, being the furthest from US, gave the slowest speed among all three that I have tested.
wget 69.55.14.79/100mb.test
--2011-07-29 17:22:09--  http://69.55.14.79/100mb.test
Connecting to 69.55.14.79:80... connected.
HTTP request sent, awaiting response... 200 OK
Length: 104857600 (100M) [application/octet-stream]
Saving to: `100mb.test'

100%[======================================>] 104,857,600 5.03M/s   in 38s

2011-07-29 17:22:48 (2.62 MB/s) - `100mb.test' saved [104857600/104857600]
Finally, for the Benchmarks, the VPS delivered a pretty low score, especially considering that 256MB of RAM is already in the “high” end of the low end VPS:
   #    #  #    #  #  #    #          #####   ######  #    #   ####   #    #
   #    #  ##   #  #   #  #           #    #  #       ##   #  #    #  #    #
   #    #  # #  #  #    ##            #####   #####   # #  #  #       ######
   #    #  #  # #  #    ##            #    #  #       #  # #  #       #    #
   #    #  #   ##  #   #  #           #    #  #       #   ##  #    #  #    #
    ####   #    #  #  #    #          #####   ######  #    #   ####   #    #

   Version 5.1.3                      Based on the Byte Magazine Unix Benchmark

   Multi-CPU version                  Version 5 revisions by Ian Smith,
                                      Sunnyvale, CA, USA
   January 13, 2011                   johantheghost at yahoo period com

1 x Dhrystone 2 using register variables  1 2 3 4 5 6 7 8 9 10

1 x Double-Precision Whetstone  1 2 3 4 5 6 7 8 9 10

1 x Execl Throughput  1 2 3

1 x File Copy 1024 bufsize 2000 maxblocks  1 2 3

1 x File Copy 256 bufsize 500 maxblocks  1 2 3

1 x File Copy 4096 bufsize 8000 maxblocks  1 2 3

1 x Pipe Throughput  1 2 3 4 5 6 7 8 9 10

1 x Pipe-based Context Switching  1 2 3 4 5 6 7 8 9 10

1 x Process Creation  1 2 3

1 x System Call Overhead  1 2 3 4 5 6 7 8 9 10

1 x Shell Scripts (1 concurrent)  1 2 3

1 x Shell Scripts (8 concurrent)  1 2 3

========================================================================
   BYTE UNIX Benchmarks (Version 5.1.3)

   System: tailoredvps: GNU/Linux
   OS: GNU/Linux -- 2.6.32-238.9.1.el5.028stab089.1 -- #1 SMP Thu Apr 14 14:06:01 MSD 2011
   Machine: i686 (unknown)
   Language: en_US.utf8 (charmap="ANSI_X3.4-1968", collate="ANSI_X3.4-1968")
   CPU 0: Dual Core AMD Opteron(tm) Processor 285 (5178.8 bogomips)
          Hyper-Threading, x86-64, MMX, AMD MMX, Physical Address Ext, SYSENTER/SYSEXIT, SYSCALL/SYSRET
   04:09:02 up  2:20,  1 user,  load average: 0.02, 0.08, 0.04; runlevel 2

------------------------------------------------------------------------
Benchmark Run: Sat Jul 30 2011 04:09:02 - 04:37:23
1 CPU in system; running 1 parallel copy of tests

Dhrystone 2 using register variables        9939383.2 lps   (10.0 s, 7 samples)
Double-Precision Whetstone                     2194.1 MWIPS (10.0 s, 7 samples)
Execl Throughput                               2768.9 lps   (29.4 s, 2 samples)
File Copy 1024 bufsize 2000 maxblocks        207897.1 KBps  (30.0 s, 2 samples)
File Copy 256 bufsize 500 maxblocks           75750.6 KBps  (30.0 s, 2 samples)
File Copy 4096 bufsize 8000 maxblocks        453733.8 KBps  (30.0 s, 2 samples)
Pipe Throughput                              565675.0 lps   (10.0 s, 7 samples)
Pipe-based Context Switching                 159217.7 lps   (10.0 s, 7 samples)
Process Creation                               6938.2 lps   (30.0 s, 2 samples)
Shell Scripts (1 concurrent)                   2668.5 lpm   (60.0 s, 2 samples)
Shell Scripts (8 concurrent)                    359.7 lpm   (60.1 s, 2 samples)
System Call Overhead                         759592.8 lps   (10.0 s, 7 samples)

System Benchmarks Index Values               BASELINE       RESULT    INDEX
Dhrystone 2 using register variables         116700.0    9939383.2    851.7
Double-Precision Whetstone                       55.0       2194.1    398.9
Execl Throughput                                 43.0       2768.9    643.9
File Copy 1024 bufsize 2000 maxblocks          3960.0     207897.1    525.0
File Copy 256 bufsize 500 maxblocks            1655.0      75750.6    457.7
File Copy 4096 bufsize 8000 maxblocks          5800.0     453733.8    782.3
Pipe Throughput                               12440.0     565675.0    454.7
Pipe-based Context Switching                   4000.0     159217.7    398.0
Process Creation                                126.0       6938.2    550.6
Shell Scripts (1 concurrent)                     42.4       2668.5    629.4
Shell Scripts (8 concurrent)                      6.0        359.7    599.4
System Call Overhead                          15000.0     759592.8    506.4
                                                                   ========
System Benchmarks Index Score                                         551.0
And running the tests again does not seem to show a lot better results:
   #    #  #    #  #  #    #          #####   ######  #    #   ####   #    #
   #    #  ##   #  #   #  #           #    #  #       ##   #  #    #  #    #
   #    #  # #  #  #    ##            #####   #####   # #  #  #       ######
   #    #  #  # #  #    ##            #    #  #       #  # #  #       #    #
   #    #  #   ##  #   #  #           #    #  #       #   ##  #    #  #    #
    ####   #    #  #  #    #          #####   ######  #    #   ####   #    #

   Version 5.1.3                      Based on the Byte Magazine Unix Benchmark

   Multi-CPU version                  Version 5 revisions by Ian Smith,
                                      Sunnyvale, CA, USA
   January 13, 2011                   johantheghost at yahoo period com

1 x Dhrystone 2 using register variables  1 2 3 4 5 6 7 8 9 10

1 x Double-Precision Whetstone  1 2 3 4 5 6 7 8 9 10

1 x Execl Throughput  1 2 3

1 x File Copy 1024 bufsize 2000 maxblocks  1 2 3

1 x File Copy 256 bufsize 500 maxblocks  1 2 3

1 x File Copy 4096 bufsize 8000 maxblocks  1 2 3

1 x Pipe Throughput  1 2 3 4 5 6 7 8 9 10

1 x Pipe-based Context Switching  1 2 3 4 5 6 7 8 9 10

1 x Process Creation  1 2 3

1 x System Call Overhead  1 2 3 4 5 6 7 8 9 10

1 x Shell Scripts (1 concurrent)  1 2 3

1 x Shell Scripts (8 concurrent)  1 2 3

========================================================================
   BYTE UNIX Benchmarks (Version 5.1.3)

   System: tailoredvps: GNU/Linux
   OS: GNU/Linux -- 2.6.32-238.9.1.el5.028stab089.1 -- #1 SMP Thu Apr 14 14:06:01 MSD 2011
   Machine: i686 (unknown)
   Language: en_US.utf8 (charmap="ANSI_X3.4-1968", collate="ANSI_X3.4-1968")
   CPU 0: Dual Core AMD Opteron(tm) Processor 285 (5178.8 bogomips)
          Hyper-Threading, x86-64, MMX, AMD MMX, Physical Address Ext, SYSENTER/SYSEXIT, SYSCALL/SYSRET
   04:40:27 up  2:51,  1 user,  load average: 0.21, 1.71, 1.40; runlevel 2

------------------------------------------------------------------------
Benchmark Run: Sat Jul 30 2011 04:40:27 - 05:08:41
1 CPU in system; running 1 parallel copy of tests

Dhrystone 2 using register variables        9743976.8 lps   (10.0 s, 7 samples)
Double-Precision Whetstone                     2194.4 MWIPS (10.0 s, 7 samples)
Execl Throughput                               2641.0 lps   (29.7 s, 2 samples)
File Copy 1024 bufsize 2000 maxblocks        224038.8 KBps  (30.0 s, 2 samples)
File Copy 256 bufsize 500 maxblocks           74032.5 KBps  (30.0 s, 2 samples)
File Copy 4096 bufsize 8000 maxblocks        438154.3 KBps  (30.0 s, 2 samples)
Pipe Throughput                              570675.0 lps   (10.0 s, 7 samples)
Pipe-based Context Switching                 161256.9 lps   (10.0 s, 7 samples)
Process Creation                               7054.4 lps   (30.0 s, 2 samples)
Shell Scripts (1 concurrent)                   2675.2 lpm   (60.0 s, 2 samples)
Shell Scripts (8 concurrent)                    369.8 lpm   (60.1 s, 2 samples)
System Call Overhead                         742809.1 lps   (10.0 s, 7 samples)

System Benchmarks Index Values               BASELINE       RESULT    INDEX
Dhrystone 2 using register variables         116700.0    9743976.8    835.0
Double-Precision Whetstone                       55.0       2194.4    399.0
Execl Throughput                                 43.0       2641.0    614.2
File Copy 1024 bufsize 2000 maxblocks          3960.0     224038.8    565.8
File Copy 256 bufsize 500 maxblocks            1655.0      74032.5    447.3
File Copy 4096 bufsize 8000 maxblocks          5800.0     438154.3    755.4
Pipe Throughput                               12440.0     570675.0    458.7
Pipe-based Context Switching                   4000.0     161256.9    403.1
Process Creation                                126.0       7054.4    559.9
Shell Scripts (1 concurrent)                     42.4       2675.2    630.9
Shell Scripts (8 concurrent)                      6.0        369.8    616.4
System Call Overhead                          15000.0     742809.1    495.2
                                                                   ========
System Benchmarks Index Score                                         550.8
Although sometimes GeekBench score and UnixBench score do deviate greatly, this time the GeekBench score did not show any better results than UnixBench:
System Information
  Platform:                  Linux x86 (32-bit)
  Compiler:                  GCC 4.1.2 20070925 (Red Hat 4.1.2-33)
  Operating System:          Linux 2.6.32-238.9.1.el5.028stab089.1 i686
  Model:                     Linux PC (AMD Opteron 285)
  Motherboard:               Unknown Motherboard
  Processor:                 AMD Opteron 285
  Processor ID:              AuthenticAMD Family 15 Model 33 Stepping 2
  Logical Processors:        1
  Physical Processors:       1
  Processor Frequency:       2.59 GHz
  L1 Instruction Cache:      64.0 KB
  L1 Data Cache:             64.0 KB
  L2 Cache:                  1.00 MB
  L3 Cache:                  0.00 B
  Bus Frequency:             0.00 Hz
  Memory:                    15.4 GB
  Memory Type:               N/A
  SIMD:                      1
  BIOS:                      N/A
  Processor Model:           AMD Opteron 285
  Processor Cores:           1

Integer
  Blowfish
    single-threaded scalar    1809 |||||||
    multi-threaded scalar     1940 |||||||
  Text Compress
    single-threaded scalar    1719 ||||||
    multi-threaded scalar     1705 ||||||
  Text Decompress
    single-threaded scalar    1670 ||||||
    multi-threaded scalar     1708 ||||||
  Image Compress
    single-threaded scalar    1448 |||||
    multi-threaded scalar     1417 |||||
  Image Decompress
    single-threaded scalar    1124 ||||
    multi-threaded scalar     1152 ||||
  Lua
    single-threaded scalar    2000 ||||||||
    multi-threaded scalar     1959 |||||||

Floating Point
  Mandelbrot
    single-threaded scalar    1805 |||||||
    multi-threaded scalar     1843 |||||||
  Dot Product
    single-threaded scalar    2634 ||||||||||
    multi-threaded scalar     2780 |||||||||||
    single-threaded vector    2800 |||||||||||
    multi-threaded vector     3168 ||||||||||||
  LU Decomposition
    single-threaded scalar    1791 |||||||
    multi-threaded scalar     1814 |||||||
  Primality Test
    single-threaded scalar    2227 ||||||||
    multi-threaded scalar     1759 |||||||
  Sharpen Image
    single-threaded scalar    5821 |||||||||||||||||||||||
    multi-threaded scalar     5839 |||||||||||||||||||||||
  Blur Image
    single-threaded scalar    7606 ||||||||||||||||||||||||||||||
    multi-threaded scalar     7645 ||||||||||||||||||||||||||||||

Memory
  Read Sequential
    single-threaded scalar    1523 ||||||
  Write Sequential
    single-threaded scalar    1693 ||||||
  Stdlib Allocate
    single-threaded scalar    2693 ||||||||||
  Stdlib Write
    single-threaded scalar     582 ||
  Stdlib Copy
    single-threaded scalar    1017 ||||

Stream
  Stream Copy
    single-threaded scalar    1133 ||||
    single-threaded vector    1220 ||||
  Stream Scale
    single-threaded scalar    1171 ||||
    single-threaded vector    1182 ||||
  Stream Add
    single-threaded scalar    1130 ||||
    single-threaded vector    1265 |||||
  Stream Triad
    single-threaded scalar    1228 ||||
    single-threaded vector     935 |||

Integer Score:                1637 ||||||
Floating Point Score:         3538 ||||||||||||||
Memory Score:                 1501 ||||||
Stream Score:                 1158 ||||

Overall Geekbench Score:      2227 ||||||||
And finally, GeekBench for the second time:
System Information
  Platform:                  Linux x86 (32-bit)
  Compiler:                  GCC 4.1.2 20070925 (Red Hat 4.1.2-33)
  Operating System:          Linux 2.6.32-238.9.1.el5.028stab089.1 i686
  Model:                     Linux PC (AMD Opteron 285)
  Motherboard:               Unknown Motherboard
  Processor:                 AMD Opteron 285
  Processor ID:              AuthenticAMD Family 15 Model 33 Stepping 2
  Logical Processors:        1
  Physical Processors:       1
  Processor Frequency:       2.59 GHz
  L1 Instruction Cache:      64.0 KB
  L1 Data Cache:             64.0 KB
  L2 Cache:                  1.00 MB
  L3 Cache:                  0.00 B
  Bus Frequency:             0.00 Hz
  Memory:                    15.4 GB
  Memory Type:               N/A
  SIMD:                      1
  BIOS:                      N/A
  Processor Model:           AMD Opteron 285
  Processor Cores:           1

Integer
  Blowfish
    single-threaded scalar    1817 |||||||
    multi-threaded scalar     1958 |||||||
  Text Compress
    single-threaded scalar    1756 |||||||
    multi-threaded scalar     1695 ||||||
  Text Decompress
    single-threaded scalar    1671 ||||||
    multi-threaded scalar     1713 ||||||
  Image Compress
    single-threaded scalar    1449 |||||
    multi-threaded scalar     1422 |||||
  Image Decompress
    single-threaded scalar    1130 ||||
    multi-threaded scalar     1147 ||||
  Lua
    single-threaded scalar    1998 |||||||
    multi-threaded scalar     2004 ||||||||

Floating Point
  Mandelbrot
    single-threaded scalar    1824 |||||||
    multi-threaded scalar     1855 |||||||
  Dot Product
    single-threaded scalar    2650 ||||||||||
    multi-threaded scalar     2808 |||||||||||
    single-threaded vector    2717 ||||||||||
    multi-threaded vector     3147 ||||||||||||
  LU Decomposition
    single-threaded scalar    1777 |||||||
    multi-threaded scalar     1800 |||||||
  Primality Test
    single-threaded scalar    2252 |||||||||
    multi-threaded scalar     1785 |||||||
  Sharpen Image
    single-threaded scalar    5790 |||||||||||||||||||||||
    multi-threaded scalar     5832 |||||||||||||||||||||||
  Blur Image
    single-threaded scalar    7596 ||||||||||||||||||||||||||||||
    multi-threaded scalar     7646 ||||||||||||||||||||||||||||||

Memory
  Read Sequential
    single-threaded scalar    1588 ||||||
  Write Sequential
    single-threaded scalar    1693 ||||||
  Stdlib Allocate
    single-threaded scalar    2687 ||||||||||
  Stdlib Write
    single-threaded scalar     592 ||
  Stdlib Copy
    single-threaded scalar    1038 ||||

Stream
  Stream Copy
    single-threaded scalar    1138 ||||
    single-threaded vector    1229 ||||
  Stream Scale
    single-threaded scalar    1196 ||||
    single-threaded vector    1187 ||||
  Stream Add
    single-threaded scalar    1132 ||||
    single-threaded vector    1273 |||||
  Stream Triad
    single-threaded scalar    1239 ||||
    single-threaded vector     949 |||

Integer Score:                1646 ||||||
Floating Point Score:         3534 ||||||||||||||
Memory Score:                 1519 ||||||
Stream Score:                 1167 ||||

Overall Geekbench Score:      2233 ||||||||
In conclusion, although the CPU is not capped and RAM does not show any signs of overselling, the low disk I/O speed basically affected greatly the performance of the VPS, resulting in relatively low benchmark scores.
Customer Service and Support
TailoredVPS advertise 24x7x365 support on their website, like many others:

However, Jay seems to be the only one I have ever been in touch with regarding my tickets. Although the initial response regarding the issue I have raised (low disk I/O speed) was answered in a little more than an hour (ticket opened at 10:40PM, response received at 11:40PM) with the solution, with is pretty good especially considering it was a Saturday. The follow-up request, after seeing no improvement with the disk I/O speed although my I/O priority was adjusted, was not answered until almost a day later (response sent at 13:50 and was not answered until 11:35) saying that they will need higher level admin to work on the issue. Since then, I have not heard anything nor there was any improvement in the disk I/O nor the disk I/O has shown any improvements at the time I put in the cancellation request 4 days later.
Conclusion
Although there is no evidence suggesting the VPS is heavily oversold in memory, the fact that disk I/O is pretty low makes it unfortunately having a relatively benchmark scores. Although the fact that it has one Opteron core with 2.6GHz make it a possible consideration for some computational work. However, support could be slow at times, making it perhaps better for QA/testing purposes than for actual production.
I would like to note that we have recently upgraded all of our nodes which will result in significantly faster I/O compared to our older nodes. These new nodes utilize 3ware Raid cards.
@Tailored VPS: Glad to hear! I will probably show up once a while in your WHMCS and grab a VPS just to see the performance!