
96MB Low End VPS Review Part 71–BlueVM
BlueVM is another contender for the low end VPS community which has often offered some really attractive deals from time to time. The last 96MB review on them, however, turned out not to be that ideal, and there were a few questions about if my expectation on them were a bit too high. It has been a year since my last review for them, and I am curious if they have made any changes to their services after their site has changed to a very “blue-ish” appearance. Let’s take a look.
Basic Information and Set Up
As per the offer on LowEndTalk, here is what you get for 1 USD per month, which is pretty amazing price for a 256MB dedicated RAM + 256MB Swap VPS:

As you can see, the price is really cheap for the resources given, particularly the amount of guaranteed RAM and swap space given.
BlueVM has recently redesigned their website to make the main theme to be…blue. Once you click on the order link, this is what you are being taken to:
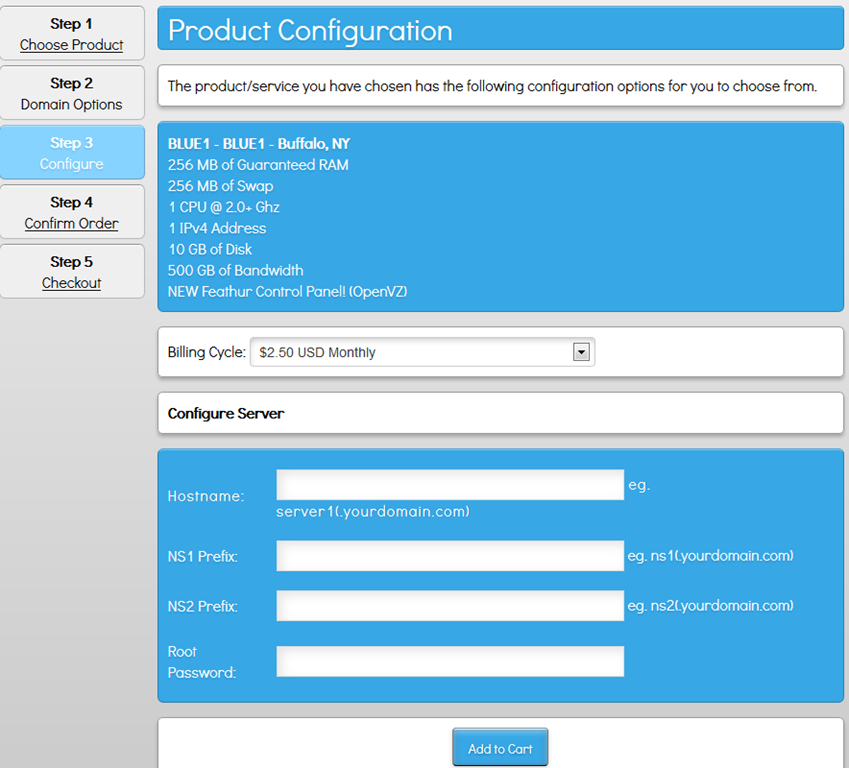
There are a few configuration options given, namely the billing cycle and hostname, NS prefix and the root password.
You can prepay the VPS with different billing cycles, from monthly to annually. However note that there won’t be any discount on the payment until you choose to pay at least semi-annually:

The rest are pretty straight forward. For the root password, many VPS providers have recently adopted a simple PHP trick to generate random password rather than having users type in the password during sign up. However, personally I prefer to have my own password (even though it might be very insecure if the client enters very simple passwords), however it is strictly a matter of personal preference and I don’t think we should either way it would impact the user experience too much.
Creation of VPS was instant and unlike the usual SolusVM email where you get all of the details for you to log into the VPS in one email, the email I have received from BlueVM was more like a notification that the VPS has been created:

You can see the details of the VPS in their WHMCS system:
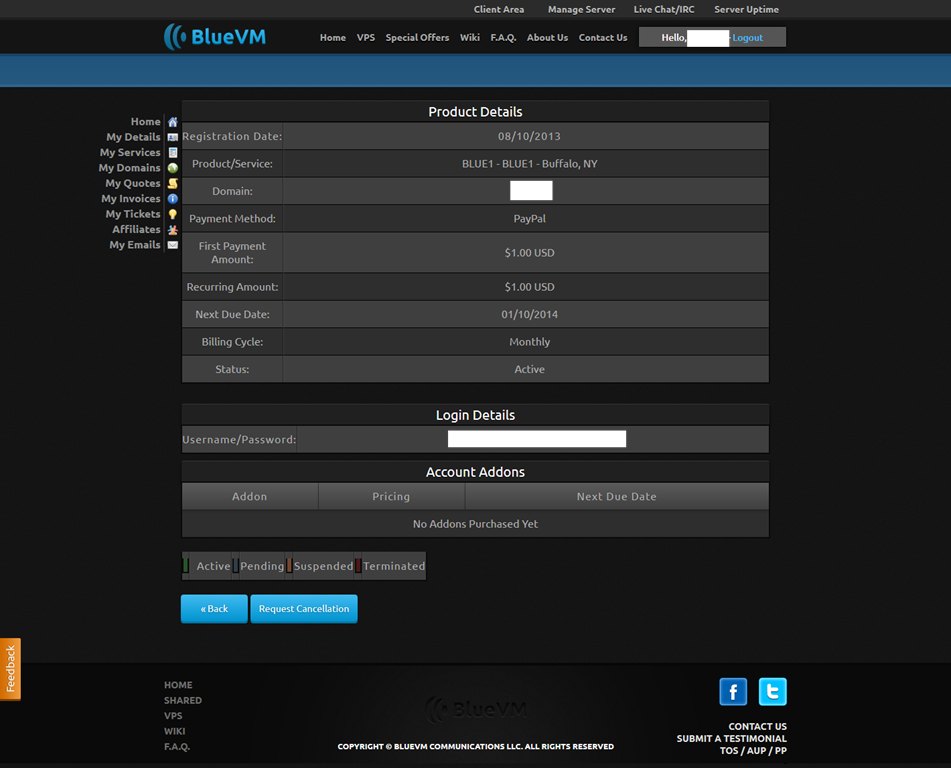
As you can see, there is almost no control functionality in the VPS, and BlueVM uses WHMCS strictly as a billing system.
All the VPS control functionalities are done via their in-house control panel, which is named Feathur (I was under the impression that it has something to do with the feather, however they were just having difficulties registering for any domain name that is related to feather). Unlike SolusVM control panel, where you get a difficult-to-remember SolusVM user name, you can actually log in to the Feathur panel using your email address, also via secured HTTPS page. This has also made managing multiple VPS a lot easier, since there were situations before I receive a new SolusVM login ID every time I buy a new VPS in SolusVM, and I have to manually submit a ticket every time to merge the VPS manually, which is a hassle.
Once logged in, you can see all of the VPS you have and if they are online, I believe the check is actually done on real-time:
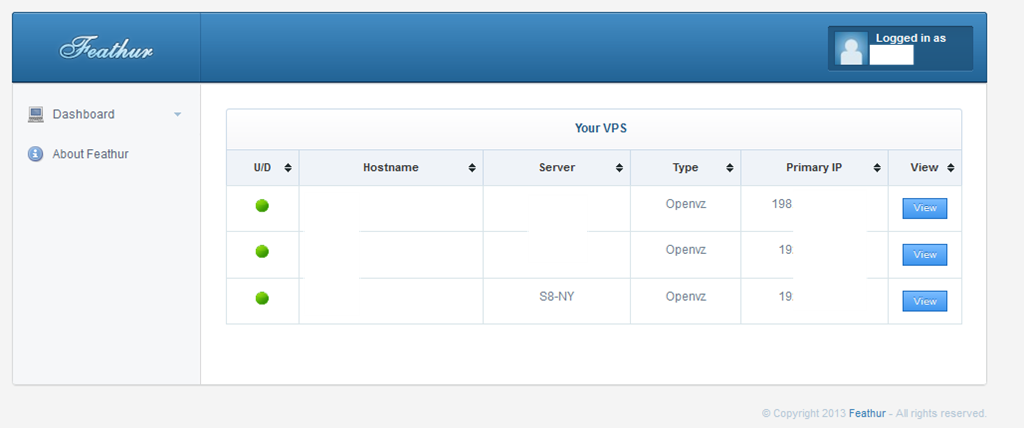
Click on View and you are presented with the detailed information about the VPS:
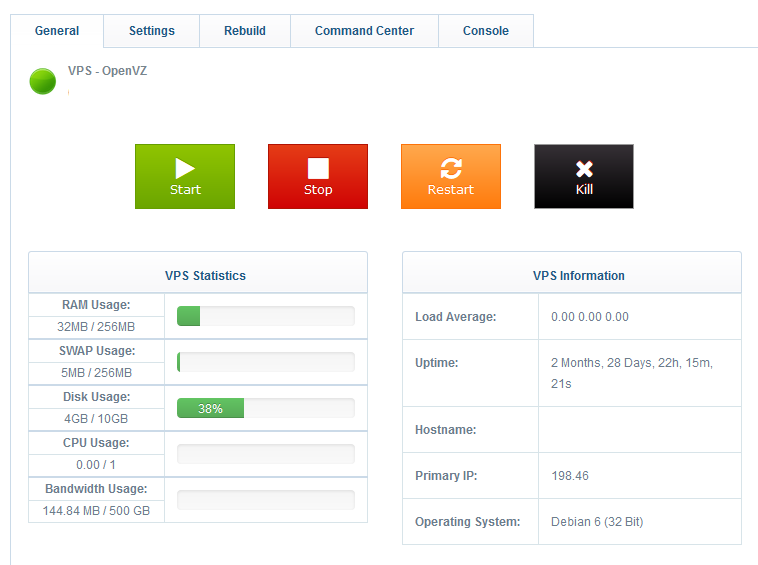
As you can see, the information presented here is a lot more detail than the output you will be able to see from SolusVM. It does not only give you the the usage but also load and uptime as well. As such, this page takes slightly longer to load, presumably because the master is querying the information from the VPS.
There are also functionalities to Start, Stop, Restart and Kill the VPS. Even though I am not sure if killing the VPS means I can destroy it and recreate another one immediately (like the “cloud” provision feature that many providers are advertising on), if that is the case it would be pretty awesome.
On the Settings tab, you will be able to reset the password, change the primary IP and hostname, set rDNS and enable some of the modules that are needed for VPN:
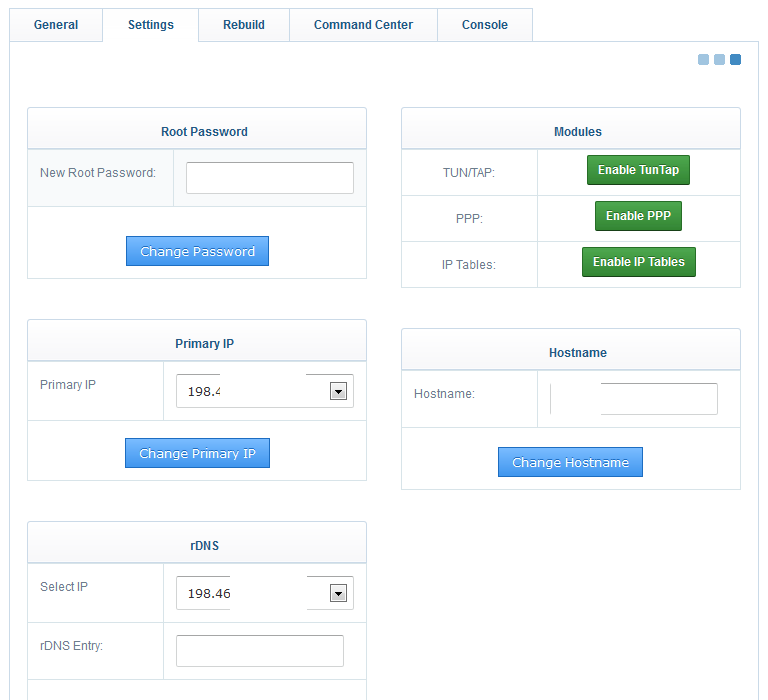
I believe the rDNS is being queried on the real time basis as well, even though I am not sure if the update will happened instantly.
In the Rebuild tab, you can select an OS template to rebuild your VPS:
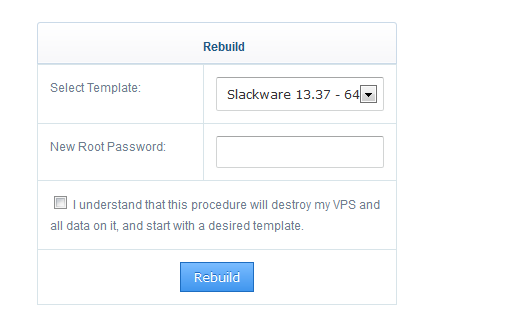
There are actually quite a few option that you could use, however most of them are just the “vanilla” templates covering the basic of OS templates:
Ubuntu 12.04 (32 Bit)
Debian 7 (64 Bit) - Minimal
CentOS 5.9 (64 bit)
CentOS 6 (32 Bit)
CentOS 5.9 (32 Bit)
CentOS 6 (64 Bit)
Debian 6 (32 Bit)
Debian 6 (64 Bit)
Fedora 18 (32 Bit)
Fedora 18 (64 Bit)
Ubuntu 10.04 (32 Bit)
Ubuntu 10.04 (64 Bit)
Ubuntu 11.10 (32 Bit)
Ubuntu 11.10 (64 Bit)
Ubuntu 12.10 (32 Bit)
Ubuntu 12.10 (64 Bit)
Debian 7 (32 Bit) - Minimal
Ubuntu 12.04 (64 Bit)
Ubuntu 13.04 32 bit
Ubuntu 13.04 64 Bit
OpenSUSE 12.3 - 32 Bit - Experemental
Slackware 13.37 - 64 Bit - Minimal
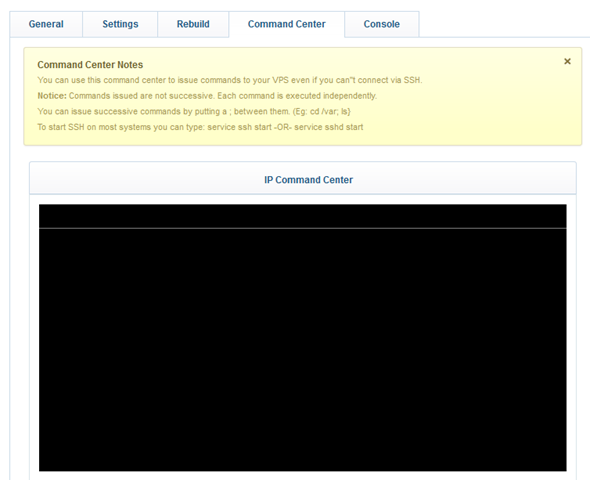
The next tab is the Command Centre, where you can run some basic Linux command to the VPS even if you can’t access the VPS via SSH, this is an useful feature if in case you accidentally shut down the SSH (which I have done before) or messed the IP configurations (which I have also done before).
The last tab is the Console tab which basically gives you the ability to have a Java SSH client running:
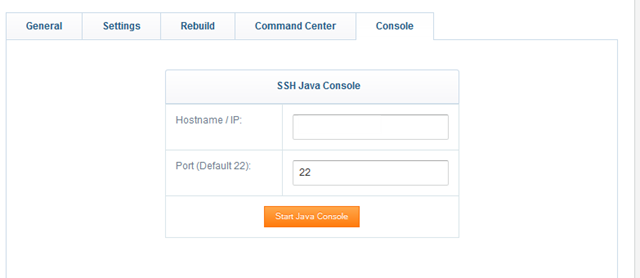
This is kind of a overlap with the command centre but I guess it might be useful when one is at some place where there is no full-fledged SSH client available (for example, in public library or at work where you can’t download executable files), but is in need in downloading
Test on the VPS
As mentioned above, the VPS comes with 256MB of RAM and 256MB of vSwap space, 10GB of hard drive, and I have installed Debian 7 for testing purposes. The VPS is located at Colocrossing’s DC in Buffalo, NY.
When the OS was loaded into the system, about 7MB of RAM was used:
 free -m
             total       used       free     shared    buffers     cached
Mem:           256         19        236          0          0         12
-/+ buffers/cache:          7        248
Swap:          256          0        256
Top showing the processes running:
top - 22:14:43 up 41 min,  1 user,  load average: 0.00, 0.00, 0.00
Tasks:  15 total,   1 running,  14 sleeping,   0 stopped,   0 zombie
Cpu(s):  0.0%us,  0.0%sy,  0.0%ni,100.0%id,  0.0%wa,  0.0%hi,  0.0%si,  0.0%st
Mem:    262144k total,    20368k used,   241776k free,        0k buffers
Swap:   262144k total,        0k used,   262144k free,    12996k cached

  PID USER      PR  NI  VIRT  RES  SHR S %CPU %MEM    TIME+  COMMAND
 2343 root      20   0  8544 3008 2464 S  0.0  1.1   0:00.07 sshd
  466 root      20   0  5136 2416 1168 S  0.0  0.9   0:00.06 apache2
  469 www-data  20   0  5136 1836  580 S  0.0  0.7   0:00.00 apache2
 2353 root      20   0  2960 1616 1288 S  0.0  0.6   0:00.00 bash
  552 root      20   0 10004 1560  520 S  0.0  0.6   0:00.06 sendmail-mta
 2666 root      20   0  2328 1076  884 R  0.0  0.4   0:00.00 top
  506 root      20   0  5488  976  588 S  0.0  0.4   0:00.01 sshd
  537 root      20   0  2288  868  680 S  0.0  0.3   0:00.00 cron
  514 root      20   0  2392  848  680 S  0.0  0.3   0:00.00 xinetd
  449 root      20   0  8668  784  452 S  0.0  0.3   0:00.00 saslauthd
    1 root      20   0  2028  704  608 S  0.0  0.3   0:00.02 init
  426 root      20   0  1736  612  504 S  0.0  0.2   0:00.01 syslogd
  451 root      20   0  8668  380   48 S  0.0  0.1   0:00.00 saslauthd
    2 root      20   0     0    0    0 S  0.0  0.0   0:00.00 kthreadd/300
    3 root      20   0     0    0    0 S  0.0  0.0   0:00.00 khelper/300
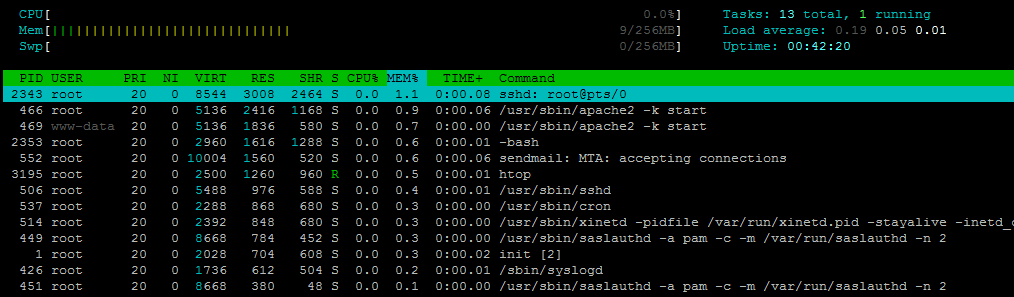
And htop output:
About 400MB of hard drive space was used:
df -h
Filesystem            Size  Used Avail Use% Mounted on
/dev/simfs             10G  405M  9.7G   4% /
tmpfs                 128M     0  128M   0% /lib/init/rw
tmpfs                 128M     0  128M   0% /dev/shm
The iNode values are pretty standard as well:
 df -i
Filesystem            Inodes   IUsed   IFree IUse% Mounted on
/dev/simfs            200000   25725  174275   13% /
tmpfs                  32768       4   32764    1% /lib/init/rw
tmpfs                  32768       1   32767    1% /dev/shm
When the full LNMP stack was loaded, the RAM usage, surprisingly, didn’t go up a lot:
free -m
             total       used       free     shared    buffers     cached
Mem:           256         24        231          0          0         17
-/+ buffers/cache:          6        249
Swap:          256         13        242
Top showing the processes running:
top - 07:55:55 up 22:22,  1 user,  load average: 0.00, 0.00, 0.00
Tasks:  20 total,   1 running,  19 sleeping,   0 stopped,   0 zombie
Cpu(s):  0.0%us,  0.0%sy,  0.0%ni,100.0%id,  0.0%wa,  0.0%hi,  0.0%si,  0.0%st
Mem:    262144k total,    25628k used,   236516k free,        0k buffers
Swap:   262144k total,    13916k used,   248228k free,    18272k cached

  PID USER      PR  NI  VIRT  RES  SHR S %CPU %MEM    TIME+  COMMAND
26568 root      20   0  8980 3012 2468 S  0.0  1.1   0:02.46 sshd
25864 www       20   0 15684 2364  672 S  0.0  0.9   0:00.01 nginx
26578 root      20   0  3044 1480 1300 S  0.0  0.6   0:00.03 bash
10528 root      20   0 17412 1232 1012 S  0.0  0.5   0:00.27 smbd
 7006 root      20   0  2412 1112  908 R  0.0  0.4   0:00.00 top
10526 root      20   0  9588  884  780 S  0.0  0.3   0:00.71 nmbd
11238 root      20   0  2344  776  708 S  0.0  0.3   0:00.15 cron
 4504 root      20   0 10052  660  484 S  0.0  0.3   0:02.49 sendmail-mta
    1 root      20   0  2068  596  576 S  0.0  0.2   0:00.82 init
20733 mysql     20   0 34444  588  340 S  0.0  0.2   0:00.01 mysqld
10501 root      20   0  2436  576  572 S  0.0  0.2   0:00.00 xinetd
20629 root      20   0  2756  540  520 S  0.0  0.2   0:00.01 mysqld_safe
  426 root      20   0  1736  480  356 S  0.0  0.2   0:00.55 syslogd
  506 root      20   0  5488  452  300 S  0.0  0.2   0:01.12 sshd
25861 root      20   0  5420  248  228 S  0.0  0.1   0:00.00 nginx
10539 root      20   0 17460  184  172 S  0.0  0.1   0:00.00 smbd
  449 root      20   0  8668  180  116 S  0.0  0.1   0:00.00 saslauth
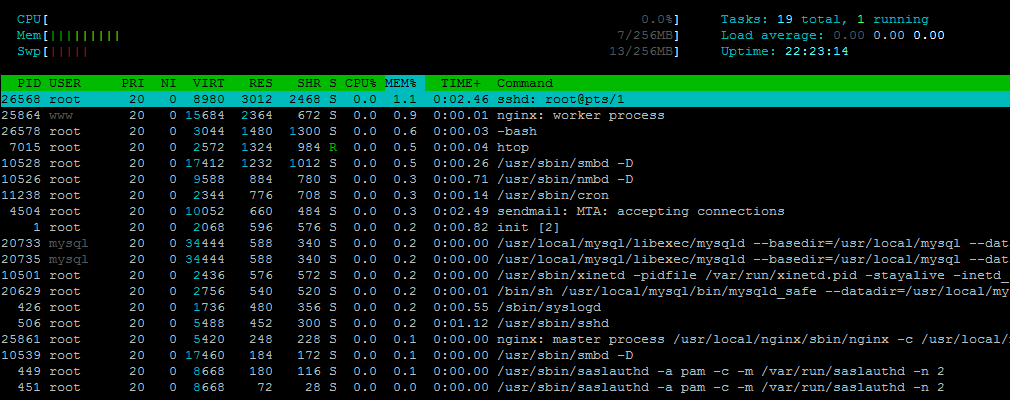
And htop output:
About 1.8GB of hard drive space were used:
df -h
Filesystem            Size  Used Avail Use% Mounted on
/dev/simfs             10G  1.8G  8.3G  18% /
tmpfs                 128M     0  128M   0% /lib/init/rw
tmpfs                 128M     0  128M   0% /dev/shm
And inodes value is actually pretty high at 35% for some reason:
 df -i
Filesystem            Inodes   IUsed   IFree IUse% Mounted on
/dev/simfs            200000   69189  130811   35% /
tmpfs                  32768       4   32764    1% /lib/init/rw
tmpfs                  32768       1   32767    1% /dev/shm
Uptime shows the VPS is pretty stable:
uptime
 21:28:30 up 9 days, 23:20,  1 user,  load average: 0.00, 0.00, 0.00
As I was writing this post, I decided to run the uptime command again and this time the results shows the uptime is about three months:
uptime
 02:16:37 up 91 days,  5:50,  1 user,  load average: 0.01, 0.06, 0.03
Vmstat shows no iowait, which is good:
vmstat
procs -----------memory---------- ---swap-- -----io---- -system-- ----cpu----
 r  b   swpd   free   buff  cache   si   so    bi    bo   in   cs us sy id wa
 0  0      0 240268      0  14232    0    0     0     0    0    2  0  0 100  0
Beancounters shows there is no failure count, which is good:
cat /proc/user_beancounters
Version: 2.5
       uid  resource                     held              maxheld              barrier                limit              failcnt
      300:  kmemsize                  3724094             53923840  9223372036854775807  9223372036854775807                    0
            lockedpages                     0                    0  9223372036854775807  9223372036854775807                    0
            privvmpages                 12538                50567  9223372036854775807  9223372036854775807                    0
            shmpages                      641                 1313  9223372036854775807  9223372036854775807                    0
            dummy                           0                    0  9223372036854775807  9223372036854775807                    0
            numproc                        21                   69  9223372036854775807  9223372036854775807                    0
            physpages                   65266                66839                    0                65536                    0
            vmguarpages                     0                    0  9223372036854775807  9223372036854775807                    0
            oomguarpages                 4575                27528  9223372036854775807  9223372036854775807                    0
            numtcpsock                     11                   17  9223372036854775807  9223372036854775807                    0
            numflock                       18                   25  9223372036854775807  9223372036854775807                    0
            numpty                          1                    5  9223372036854775807  9223372036854775807                    0
            numsiginfo                      0                   24  9223372036854775807  9223372036854775807                    0
            tcpsndbuf                  211592               416512  9223372036854775807  9223372036854775807                    0
            tcprcvbuf                  180224              3799352  9223372036854775807  9223372036854775807                    0
            othersockbuf                32368                50568  9223372036854775807  9223372036854775807                    0
            dgramrcvbuf                     0                25760  9223372036854775807  9223372036854775807                    0
            numothersock                   45                   53  9223372036854775807  9223372036854775807                    0
            dcachesize                1693426             49812896  9223372036854775807  9223372036854775807                    0
            numfile                       406                  670  9223372036854775807  9223372036854775807                    0
            dummy                           0                    0  9223372036854775807  9223372036854775807                    0
            dummy                           0                    0  9223372036854775807  9223372036854775807                    0
            dummy                           0                    0  9223372036854775807  9223372036854775807                    0
            numiptent                      24                   24  9223372036854775807  9223372036854775807                    0
CPUinfo shows there is a single core of E3-1240v2 assigned to the VPS, which is a relatively “new-ish” processor used by VPS hosts (even though more and more providers seem to use 1240v3 these days):
cat /proc/cpuinfo
processor       : 0
vendor_id       : GenuineIntel
cpu family      : 6
model           : 58
model name      : Intel(R) Xeon(R) CPU E3-1240 V2 @ 3.40GHz
stepping        : 9
cpu MHz         : 3400.140
cache size      : 8192 KB
fpu             : yes
fpu_exception   : yes
cpuid level     : 13
wp              : yes
flags           : fpu de tsc msr pae cx8 sep cmov pat clflush mmx fxsr sse sse2 ss ht syscall nx lm rep_good aperfmperf unfair_spinlock pni pclmulqdq ssse3 cx16 sse4_1 sse4_2 x2apic popcnt tsc_deadline_timer aes avx f16c rdrand hypervisor lahf_lm ida arat epb xsaveopt pln pts dts fsgsbase erms
bogomips        : 6800.28
clflush size    : 64
cache_alignment : 64
address sizes   : 36 bits physical, 48 bits virtual
power management:
Meminfo output:
cat /proc/meminfo
MemTotal:         262144 kB
MemFree:          225564 kB
Cached:            27372 kB
Active:            15856 kB
Inactive:          15904 kB
Active(anon):        772 kB
Inactive(anon):     3616 kB
Active(file):      15084 kB
Inactive(file):    12288 kB
Unevictable:           0 kB
Mlocked:               0 kB
SwapTotal:        262144 kB
SwapFree:         248228 kB
Dirty:                 0 kB
Writeback:             0 kB
AnonPages:          4388 kB
Shmem:              2564 kB
Slab:               4808 kB
SReclaimable:       2824 kB
SUnreclaim:         1984 kB
VZfree, as usual, is not showing any accurate results, but I have included here anyways for those who are curious:
vzfree
             Total     Used     Free
Kernel:   8796093022208.00M    3.57M 8796093022204.43M
Allocate: 36028797018963968.00M   48.98M 36028797018963920.00M (36028797018963967M Guaranteed)
Commit:   36028797018963968.00M   21.45M 36028797018963948.00M (36.5% of Allocated)
Swap:              -236.26M          (-1321.7% of Committed)
And time sync:
time sync

real    0m0.012s
user    0m0.000s
sys     0m0.001s
Disk I/O speed is not the best I have seen, but pretty reasonable:
dd if=/dev/zero of=test bs=64k count=16k conv=fdatasync
16384+0 records in
16384+0 records out
1073741824 bytes (1.1 GB) copied, 9.97335 s, 108 MB/s
Testing again shows similar results:
dd if=/dev/zero of=test bs=64k count=16k conv=fdatasync
16384+0 records in
16384+0 records out
1073741824 bytes (1.1 GB) copied, 7.90647 s, 136 MB/s
The new version of ioping is using nanoseconds as the time measurement, which I really like since it is a lot more useful than the boring 1ms output we saw in the older version of ioping:
ioping -c 10 .
4.0 kb from . (simfs /vz/private/300): request=1 time=1.9 ms
4.0 kb from . (simfs /vz/private/300): request=2 time=186 us
4.0 kb from . (simfs /vz/private/300): request=3 time=207 us
4.0 kb from . (simfs /vz/private/300): request=4 time=171 us
4.0 kb from . (simfs /vz/private/300): request=5 time=186 us
4.0 kb from . (simfs /vz/private/300): request=6 time=302 us
4.0 kb from . (simfs /vz/private/300): request=7 time=287 us
4.0 kb from . (simfs /vz/private/300): request=8 time=183 us
4.0 kb from . (simfs /vz/private/300): request=9 time=441 us
4.0 kb from . (simfs /vz/private/300): request=10 time=247 us

--- . (simfs /vz/private/300) ioping statistics ---
10 requests completed in 9.0 s, 2.4 k iops, 9.5 mb/s
min/avg/max/mdev = 171 us / 409 us / 1.9 ms / 498 us
As you can see, other than the first round trip, in general the round trip time is pretty good.
Testing for the second time, unfortunately, showed slighly worse results:
 ioping -c 10 .
4.0 kb from . (simfs /vz/private/300): request=1 time=134 us
4.0 kb from . (simfs /vz/private/300): request=2 time=1.0 ms
4.0 kb from . (simfs /vz/private/300): request=3 time=561 us
4.0 kb from . (simfs /vz/private/300): request=4 time=177 us
4.0 kb from . (simfs /vz/private/300): request=5 time=2.3 ms
4.0 kb from . (simfs /vz/private/300): request=6 time=236 us
4.0 kb from . (simfs /vz/private/300): request=7 time=271 us
4.0 kb from . (simfs /vz/private/300): request=8 time=234 us
4.0 kb from . (simfs /vz/private/300): request=9 time=512 us
4.0 kb from . (simfs /vz/private/300): request=10 time=207 us

--- . (simfs /vz/private/300) ioping statistics ---
10 requests completed in 9.0 s, 1.8 k iops, 6.9 mb/s
min/avg/max/mdev = 134 us / 566 us / 2.3 ms / 637 us
One thing that we all should know is the disks on a physical node is shared among the users on the node, therefore sometimes it could be just one of the neighnours on the same node that is running a relatively I/O-heavy operation.
Download from Cachefly is actually pretty good:
wget cachefly.cachefly.net/100mb.test -O /dev/null
--2013-08-22 08:04:31--  http://cachefly.cachefly.net/100mb.test
Resolving cachefly.cachefly.net (cachefly.cachefly.net)... 205.234.175.175
Connecting to cachefly.cachefly.net (cachefly.cachefly.net)|205.234.175.175|:80... connected.
HTTP request sent, awaiting response... 200 OK
Length: 104857600 (100M) [application/octet-stream]
Saving to: `/dev/null'

100%[======================================>] 104,857,600 26.9M/s   in 3.8s

2013-08-22 08:04:35 (26.2 MB/s) - `/dev/null' saved [104857600/104857600]
Testing again showed even better results:
wget cachefly.cachefly.net/100mb.test -O /dev/null
--2013-08-22 08:55:21--  http://cachefly.cachefly.net/100mb.test
Resolving cachefly.cachefly.net (cachefly.cachefly.net)... 205.234.175.175
Connecting to cachefly.cachefly.net (cachefly.cachefly.net)|205.234.175.175|:80... connected.
HTTP request sent, awaiting response... 200 OK
Length: 104857600 (100M) [application/octet-stream]
Saving to: `/dev/null'

100%[======================================>] 104,857,600 52.9M/s   in 1.9s

2013-08-22 08:55:23 (52.9 MB/s) - `/dev/null' saved [104857600/104857600]
Encouraged by such, I was tempted to find out if the port is actually a GBit port or a 100Mbit port, so I went on to use aget to try some 1GB download files:
First was the test file from ThinkBoradband in London, UK:
aget -n 10 http://ipv4.download.thinkbroadband.com/1GB.zipAttempting to read log file aget-1GB.zip.log for resuming download job... Couldn't find log file for this download, starting a clean job... Head-Request Connection established Downloading /1GB.zip (1073741824 bytes) from site ipv4.download.thinkbroadband.com(80.249.99.148:80). Number of Threads: 10 .. [4% completed] ..... [9% completed] ....... [14% completed] .......... [19% completed] ............. ........... [24% completed] [24% completed] ............... ............... ............... [29% completed] [29% completed] [29% completed] ................. ................. ................. [34% completed] [34% completed] [34% completed] .................... .................... .................... [39% completed] [39% completed] [39% completed] ...................... ...................... ...................... ...................... ...................... [44% completed] [44% completed] [44% completed] [44% completed] [44% completed] ......................... ......................... [49% completed] [49% completed] ........................... ........................... [54% completed] [54% completed] ............................... ............................. .............................. [59% completed] [59% completed] [59% completed] ................................ ................................. ............................... [64% completed] [64% completed] [64% completed] .................................... ................................... .................................. [69% completed] [69% completed] [69% completed] ..................................... ..................................... [74% completed] [74% completed] ........................................ [79% completed] .......................................... [84% completed] ............................................. ............................................. [89% completed] [89% completed] ................................................ .............................................. [94% completed] [94% completed] .................................................. [99% completed] .................................................. [100% completed] Download completed, job completed in 24 seconds. (43690 Kb/sec) Shutting down...
As you can see, the download speed was about 40MB/s, which is pretty impressive.
Testing again showed slightly slower but still very impressive speed:
aget -n 10 http://ipv4.download.thinkbroadband.com/1GB.zip && rm -rf 1GB.zipAttempting to read log file aget-1GB.zip.log for resuming download job... Couldn't find log file for this download, starting a clean job... Head-Request Connection established Downloading /1GB.zip (1073741824 bytes) from site ipv4.download.thinkbroadband.com(80.249.99.148:80). Number of Threads: 10 .. [4% completed] ..... [9% completed] ....... [14% completed] .......... [19% completed] ............ [24% completed] ............... ............... [29% completed] [29% completed] ................. ................. [34% completed] [34% completed] .................... .................... .................... .................... .................... .................... [39% completed] [39% completed] [39% completed] [39% completed] [39% completed] [39% completed] ...................... ...................... ...................... ...................... [44% completed] [44% completed] [44% completed] [44% completed] ......................... ......................... ......................... .......................... ........................ [49% completed] [49% completed] [49% completed] [49% completed] [49% completed] ........................... ............................ .......................... [54% completed] [54% completed] [54% completed] .............................. .............................. .............................. .............................. [59% completed] [59% completed] [59% completed] [59% completed] ................................ ................................ ................................ [64% completed] [64% completed] [64% completed] ................................... ................................... ................................... ................................... [69% completed] [69% completed] [69% completed] [69% completed] ..................................... ..................................... [74% completed] [74% completed] ........................................ ........................................ [79% completed] [79% completed] ........................................... .......................................... ........................................... ......................................... ......................................... .......................................... .......................................... .......................................... .......................................... [84% completed] [84% completed] [84% completed] [84% completed] [84% completed] [84% completed] [84% completed] [84% completed] [84% completed] ............................................. ............................................. .............................................. ............................................. ............................................. ............................................ ............................................. [89% completed] [89% completed] [89% completed] [89% completed] [89% completed] [89% completed] [89% completed] ............................................... ............................................... [94% completed] [94% completed] .................................................. .................................................. [99% completed] [99% completed] .................................................. [100% completed] Download completed, job completed in 43 seconds. (24385 Kb/sec) Shutting down...
Even though the download speed is only half of what is seen the first time, I would still consider it as a good speed.
For the second test, we use the DimeNOC test file, which is located in Orlando, Florida:
aget -n 10 http://72.29.70.131/1gbfile.tgz && rm -rf 1gbfile.tgzAttempting to read log file aget-1gbfile.tgz.log for resuming download job... Couldn't find log file for this download, starting a clean job... Head-Request Connection established Downloading /1gbfile.tgz (1023410176 bytes) from site 72.29.70.131(72.29.70.131:80). Number of Threads: 10 .. [4% completed] ..... [9% completed] ....... ....... ....... ....... ....... ....... ....... [14% completed] [14% completed] [14% completed] [14% completed] [14% completed] [14% completed] [14% completed] .......... .......... .......... .......... [19% completed] [19% completed] [19% completed] [19% completed] ............ ............ [24% completed] [24% completed] ............... ............... ............... ............... ............... ............... [29% completed] [29% completed] [29% completed] [29% completed] [29% completed] [29% completed] ................. ................. ................. [34% completed] [34% completed] [34% completed] .................... .................... [39% completed] [39% completed] ....................... ..................... ...................... [44% completed] [44% completed] [44% completed] ......................... ......................... [49% completed] [49% completed] ........................... [54% completed] .............................. .............................. .............................. .............................. [59% completed] [59% completed] [59% completed] [59% completed] ................................. ................................ ............................... ................................ [64% completed] [64% completed] [64% completed] [64% completed] ................................... [69% completed] ..................................... ..................................... [74% completed] [74% completed] ........................................ ......................................... ........................................ ........................................ ....................................... [79% completed] [79% completed] [79% completed] [79% completed] [79% completed] .......................................... .......................................... ........................................... .......................................... ........................................... ......................................... ......................................... .......................................... .......................................... .......................................... [84% completed] [84% completed] [84% completed] [84% completed] [84% completed] [84% completed] [84% completed] [84% completed] [84% completed] [84% completed] ............................................. .............................................. ............................................ ............................................. .............................................. ............................................. ............................................ [89% completed] [89% completed] [89% completed] [89% completed] [89% completed] [89% completed] [89% completed] ............................................... [94% completed] .................................................. [99% completed] .................................................. [100% completed] Download completed, job completed in 16 seconds. (62464 Kb/sec) Shutting down...
The download speed has reached close to 60MB/s, which is pretty good.
Testing again showed worse but reasonable speed:
aget -n 10 http://72.29.70.131/1gbfile.tgz && rm -rf 1gbfile.tgzAttempting to read log file aget-1gbfile.tgz.log for resuming download job... Couldn't find log file for this download, starting a clean job... Head-Request Connection established Downloading /1gbfile.tgz (1023410176 bytes) from site 72.29.70.131(72.29.70.131:80). Number of Threads: 10 .. [4% completed] ..... [9% completed] ....... [14% completed] .......... [19% completed] ............ [24% completed] ............... ............... ............... ............... ............... [29% completed] [29% completed] [29% completed] [29% completed] [29% completed] .................. ................. ................. ................. ................. ................ ................. [34% completed] [34% completed] [34% completed] [34% completed] [34% completed] [34% completed] [34% completed] .................... ..................... .................... ................... .................... [39% completed] [39% completed] [39% completed] [39% completed] [39% completed] ...................... ...................... [44% completed] [44% completed] ......................... ......................... ......................... [49% completed] [49% completed] [49% completed] ............................ ........................... ........................... ........................... .......................... ........................... [54% completed] [54% completed] [54% completed] [54% completed] [54% completed] [54% completed] .............................. [59% completed] ................................ ................................ [64% completed] [64% completed] ................................... ................................... ................................... [69% completed] [69% completed] [69% completed] ...................................... ..................................... .................................... ..................................... ..................................... ..................................... ..................................... ..................................... [74% completed] [74% completed] [74% completed] [74% completed] [74% completed] [74% completed] [74% completed] [74% completed] ........................................ ........................................ [79% completed] [79% completed] .......................................... .......................................... [84% completed] [84% completed] ............................................. ............................................. ............................................. [89% completed] [89% completed] [89% completed] ............................................... ............................................... [94% completed] [94% completed] .................................................. [99% completed] .................................................. [100% completed] Download completed, job completed in 39 seconds. (25626 Kb/sec) Shutting down...
As you can see, the download speed fluctuates a lot, which seems to indicate to me that the port is 1Gbit port but is a 1GB burstable port shared among many physical servers.
Once the download tests are done, the next step is to see the upload speed, and as usual, I have three different VPS used for uploading. The first one is a Quickweb VPS located in Chicago, IL:
wget 198.46.142.102/100mb.test -O /dev/null
--2013-08-22 01:19:57--  http://198.46.142.102/100mb.test
Connecting to 198.46.142.102:80... connected.
HTTP request sent, awaiting response... 200 OK
Length: 104857600 (100M) [application/octet-stream]
Saving to: `/dev/null'

100%[======================================>] 104,857,600 7.32M/s   in 14s

2013-08-22 01:20:11 (7.32 MB/s) - `/dev/null' saved [104857600/104857600]
As you can see, the physical proximity has indeed give the VPS a pretty decent upload speed.
Second test VPS I used was a Quickweb Chicago VPS located in Phoenix, Arizona, as my previous testing VPS with ChicagoVPS doesn’t seem to give very good speed anywhere.
wget 198.46.142.102/100mb.test -O /dev/null
--2013-08-21 21:55:18--  http://198.46.142.102/100mb.test
Connecting to 198.46.142.102:80... connected.
HTTP request sent, awaiting response... 200 OK
Length: 104857600 (100M) [application/octet-stream]
Saving to: `/dev/null'

100%[======================================>] 104,857,600 5.42M/s   in 56s

2013-08-21 21:56:14 (1.80 MB/s) - `/dev/null' saved [104857600/104857600]
As you can see, on the West Coast, unfortunately the upload speed isn’t that great.
The final test on the network speed is the upload test, as usual, three different locations representing the East, West North America and the Europe:
The first test is from a VPS from Quickweb in Chicago, IL:
wget 198.46.xxx.xxx/100mb.test -O /dev/null
--2013-08-22 01:19:57--  http://198.46.xxx.xxx/100mb.test
Connecting to 198.46.xxx.xxx:80... connected.
HTTP request sent, awaiting response... 200 OK
Length: 104857600 (100M) [application/octet-stream]
Saving to: `/dev/null'

100%[======================================>] 104,857,600 7.32M/s   in 14s

2013-08-22 01:20:11 (7.32 MB/s) - `/dev/null' saved [104857600/104857600]
Second test is with a VPS located again with Quickweb but in their Phoenix DC, closer to the west end of continental US:
--2013-08-21 21:55:18--  http://198.46.xxx.xxx/100mb.test
Connecting to 198.46.xxx.xxx:80... connected.
HTTP request sent, awaiting response... 200 OK
Length: 104857600 (100M) [application/octet-stream]
Saving to: `/dev/null'

100%[======================================>] 104,857,600 5.42M/s   in 56s

2013-08-21 21:56:14 (1.80 MB/s) - `/dev/null' saved [104857600/104857600]
Finally, the test VPS with Prometeus located in Milan, Italy:
wget 198.46.xxx.xxx/100mb.test -O /dev/null
--2013-08-22 09:27:39--  http://198.46.xxx.xxx/100mb.test
Connecting to 198.46.xxx.xxx:80... connected.
HTTP request sent, awaiting response... 200 OK
Length: 104857600 (100M) [application/octet-stream]
Saving to: `/dev/null'

100%[======================================>] 104,857,600 11.4M/s   in 15s

2013-08-22 09:27:54 (6.57 MB/s) - `/dev/null' saved [104857600/104857600]
As you can see, the east coast has the best speed followed by Europe and the west coast.
Varios bencharks are done to the VPS as well, first is Unixbench test:
   #    #  #    #  #  #    #          #####   ######  #    #   ####   #    #
   #    #  ##   #  #   #  #           #    #  #       ##   #  #    #  #    #
   #    #  # #  #  #    ##            #####   #####   # #  #  #       ######
   #    #  #  # #  #    ##            #    #  #       #  # #  #       #    #
   #    #  #   ##  #   #  #           #    #  #       #   ##  #    #  #    #
    ####   #    #  #  #    #          #####   ######  #    #   ####   #    #

   Version 5.1.3                      Based on the Byte Magazine Unix Benchmark

   Multi-CPU version                  Version 5 revisions by Ian Smith,
                                      Sunnyvale, CA, USA
   January 13, 2011                   johantheghost at yahoo period com


1 x Dhrystone 2 using register variables  1 2 3 4 5 6 7 8 9 10

1 x Double-Precision Whetstone  1 2 3 4 5 6 7 8 9 10

1 x Execl Throughput  1 2 3

1 x File Copy 1024 bufsize 2000 maxblocks  1 2 3

1 x File Copy 256 bufsize 500 maxblocks  1 2 3

1 x File Copy 4096 bufsize 8000 maxblocks  1 2 3

1 x Pipe Throughput  1 2 3 4 5 6 7 8 9 10

1 x Pipe-based Context Switching  1 2 3 4 5 6 7 8 9 10

1 x Process Creation  1 2 3

1 x System Call Overhead  1 2 3 4 5 6 7 8 9 10

1 x Shell Scripts (1 concurrent)  1 2 3

1 x Shell Scripts (8 concurrent)  1 2 3

========================================================================
   BYTE UNIX Benchmarks (Version 5.1.3)

   System: xxxxxx: GNU/Linux
   OS: GNU/Linux -- 2.6.32-042stab079.5 -- #1 SMP Fri Aug 2 17:16:15 MSK 2013
   Machine: i686 (unknown)
   Language: en_US.utf8 (charmap="ANSI_X3.4-1968", collate="ANSI_X3.4-1968")
   CPU 0: Intel(R) Xeon(R) CPU E3-1240 V2 @ 3.40GHz (6800.3 bogomips)
          Hyper-Threading, x86-64, MMX, Physical Address Ext, SYSENTER/SYSEXIT, SYSCALL/SYSRET
   11:12:02 up  1:38,  2 users,  load average: 0.07, 0.02, 0.21; runlevel 2

------------------------------------------------------------------------
Benchmark Run: Wed Aug 21 2013 11:12:02 - 11:40:12
1 CPU in system; running 1 parallel copy of tests

Dhrystone 2 using register variables       19858972.4 lps   (10.0 s, 7 samples)
Double-Precision Whetstone                     3562.2 MWIPS (10.1 s, 7 samples)
Execl Throughput                               1753.4 lps   (30.0 s, 2 samples)
File Copy 1024 bufsize 2000 maxblocks        197753.5 KBps  (30.0 s, 2 samples)
File Copy 256 bufsize 500 maxblocks           53668.9 KBps  (30.0 s, 2 samples)
File Copy 4096 bufsize 8000 maxblocks        664584.7 KBps  (30.0 s, 2 samples)
Pipe Throughput                              344132.1 lps   (10.0 s, 7 samples)
Pipe-based Context Switching                  57249.7 lps   (10.0 s, 7 samples)
Process Creation                               3602.7 lps   (30.0 s, 2 samples)
Shell Scripts (1 concurrent)                   2567.0 lpm   (60.0 s, 2 samples)
Shell Scripts (8 concurrent)                    344.7 lpm   (60.1 s, 2 samples)
System Call Overhead                         284513.9 lps   (10.0 s, 7 samples)

System Benchmarks Index Values               BASELINE       RESULT    INDEX
Dhrystone 2 using register variables         116700.0   19858972.4   1701.7
Double-Precision Whetstone                       55.0       3562.2    647.7
Execl Throughput                                 43.0       1753.4    407.8
File Copy 1024 bufsize 2000 maxblocks          3960.0     197753.5    499.4
File Copy 256 bufsize 500 maxblocks            1655.0      53668.9    324.3
File Copy 4096 bufsize 8000 maxblocks          5800.0     664584.7   1145.8
Pipe Throughput                               12440.0     344132.1    276.6
Pipe-based Context Switching                   4000.0      57249.7    143.1
Process Creation                                126.0       3602.7    285.9
Shell Scripts (1 concurrent)                     42.4       2567.0    605.4
Shell Scripts (8 concurrent)                      6.0        344.7    574.5
System Call Overhead                          15000.0     284513.9    189.7
                                                                   ========
System Benchmarks Index Score                                         446.2
Testing again showed very similar results:
   #    #  #    #  #  #    #          #####   ######  #    #   ####   #    #
   #    #  ##   #  #   #  #           #    #  #       ##   #  #    #  #    #
   #    #  # #  #  #    ##            #####   #####   # #  #  #       ######
   #    #  #  # #  #    ##            #    #  #       #  # #  #       #    #
   #    #  #   ##  #   #  #           #    #  #       #   ##  #    #  #    #
    ####   #    #  #  #    #          #####   ######  #    #   ####   #    #

   Version 5.1.3                      Based on the Byte Magazine Unix Benchmark

   Multi-CPU version                  Version 5 revisions by Ian Smith,
                                      Sunnyvale, CA, USA
   January 13, 2011                   johantheghost at yahoo period com


1 x Dhrystone 2 using register variables  1 2 3 4 5 6 7 8 9 10

1 x Double-Precision Whetstone  1 2 3 4 5 6 7 8 9 10

1 x Execl Throughput  1 2 3

1 x File Copy 1024 bufsize 2000 maxblocks  1 2 3

1 x File Copy 256 bufsize 500 maxblocks  1 2 3

1 x File Copy 4096 bufsize 8000 maxblocks  1 2 3

1 x Pipe Throughput  1 2 3 4 5 6 7 8 9 10

1 x Pipe-based Context Switching  1 2 3 4 5 6 7 8 9 10

1 x Process Creation  1 2 3

1 x System Call Overhead  1 2 3 4 5 6 7 8 9 10

1 x Shell Scripts (1 concurrent)  1 2 3

1 x Shell Scripts (8 concurrent)  1 2 3

========================================================================
   BYTE UNIX Benchmarks (Version 5.1.3)

   System: xxxxxx: GNU/Linux
   OS: GNU/Linux -- 2.6.32-042stab079.5 -- #1 SMP Fri Aug 2 17:16:15 MSK 2013
   Machine: i686 (unknown)
   Language: en_US.utf8 (charmap="ANSI_X3.4-1968", collate="ANSI_X3.4-1968")
   CPU 0: Intel(R) Xeon(R) CPU E3-1240 V2 @ 3.40GHz (6800.3 bogomips)
          Hyper-Threading, x86-64, MMX, Physical Address Ext, SYSENTER/SYSEXIT, SYSCALL/SYSRET
   19:07:27 up  9:34,  1 user,  load average: 0.08, 0.03, 0.01; runlevel 2

------------------------------------------------------------------------
Benchmark Run: Wed Aug 21 2013 19:07:28 - 19:35:39
1 CPU in system; running 1 parallel copy of tests

Dhrystone 2 using register variables       18993090.1 lps   (10.0 s, 7 samples)
Double-Precision Whetstone                     3563.0 MWIPS (10.0 s, 7 samples)
Execl Throughput                               1649.8 lps   (30.0 s, 2 samples)
File Copy 1024 bufsize 2000 maxblocks        192269.0 KBps  (30.0 s, 2 samples)
File Copy 256 bufsize 500 maxblocks           50346.0 KBps  (30.0 s, 2 samples)
File Copy 4096 bufsize 8000 maxblocks        622180.2 KBps  (30.0 s, 2 samples)
Pipe Throughput                              334773.4 lps   (10.0 s, 7 samples)
Pipe-based Context Switching                  54253.2 lps   (10.0 s, 7 samples)
Process Creation                               3360.3 lps   (30.0 s, 2 samples)
Shell Scripts (1 concurrent)                   2417.3 lpm   (60.0 s, 2 samples)
Shell Scripts (8 concurrent)                    330.9 lpm   (60.1 s, 2 samples)
System Call Overhead                         278595.1 lps   (10.0 s, 7 samples)

System Benchmarks Index Values               BASELINE       RESULT    INDEX
Dhrystone 2 using register variables         116700.0   18993090.1   1627.5
Double-Precision Whetstone                       55.0       3563.0    647.8
Execl Throughput                                 43.0       1649.8    383.7
File Copy 1024 bufsize 2000 maxblocks          3960.0     192269.0    485.5
File Copy 256 bufsize 500 maxblocks            1655.0      50346.0    304.2
File Copy 4096 bufsize 8000 maxblocks          5800.0     622180.2   1072.7
Pipe Throughput                               12440.0     334773.4    269.1
Pipe-based Context Switching                   4000.0      54253.2    135.6
Process Creation                                126.0       3360.3    266.7
Shell Scripts (1 concurrent)                     42.4       2417.3    570.1
Shell Scripts (8 concurrent)                      6.0        330.9    551.5
System Call Overhead                          15000.0     278595.1    185.7
                                                                   ========
System Benchmarks Index Score                                         426.7
The Unixbench test is not really showing any crazy score. However with a single core VPS this is not far off the line as what we would expect, even though E3-1240 v2 is a pretty reccent CPU model.
<
The next set of tests are the Geekbench tests:
System Information
  Platform:                  Linux x86 (32-bit)
  Compiler:                  GCC 4.1.2 20070925 (Red Hat 4.1.2-33)
  Operating System:          Linux 2.6.32-042stab079.5 i686
  Model:                     Linux PC (Intel(R) Xeon(R) CPU E3-1240 V2 @ 3.40GHz)
  Motherboard:               Unknown Motherboard
  Processor:                 Intel(R) Xeon(R) CPU E3-1240 V2 @ 3.40GHz
  Processor ID:              GenuineIntel Family 6 Model 58 Stepping 9
  Logical Processors:        1
  Physical Processors:       1
  Processor Frequency:       3.40 GHz
  L1 Instruction Cache:      0.00 B
  L1 Data Cache:             0.00 B
  L2 Cache:                  256 KB
  L3 Cache:                  0.00 B
  Bus Frequency:             0.00 Hz
  Memory:                    256 MB
  Memory Type:               N/A
  SIMD:                      1
  BIOS:                      N/A
  Processor Model:                 Intel(R) Xeon(R) CPU E3-1240 V2 @ 3.40GHz
  Processor Cores:           1

Integer
  Blowfish
    single-threaded scalar    2429 |||||||||
    multi-threaded scalar     2501 ||||||||||
  Text Compress
    single-threaded scalar    2741 ||||||||||
    multi-threaded scalar     2647 ||||||||||
  Text Decompress
    single-threaded scalar    3116 ||||||||||||
    multi-threaded scalar     3132 ||||||||||||
  Image Compress
    single-threaded scalar    2514 ||||||||||
    multi-threaded scalar     2450 |||||||||
  Image Decompress
    single-threaded scalar    2164 ||||||||
    multi-threaded scalar     2203 ||||||||
  Lua
    single-threaded scalar    4134 ||||||||||||||||
    multi-threaded scalar     3958 |||||||||||||||

Floating Point
  Mandelbrot
    single-threaded scalar    2917 |||||||||||
    multi-threaded scalar     3000 ||||||||||||
  Dot Product
    single-threaded scalar    4785 |||||||||||||||||||
    multi-threaded scalar     4929 |||||||||||||||||||
    single-threaded vector    6951 |||||||||||||||||||||||||||
    multi-threaded vector     7648 ||||||||||||||||||||||||||||||
  LU Decomposition
    single-threaded scalar    3569 ||||||||||||||
    multi-threaded scalar     3585 ||||||||||||||
  Primality Test
    single-threaded scalar    4713 ||||||||||||||||||
    multi-threaded scalar     3895 |||||||||||||||
  Sharpen Image
    single-threaded scalar   10532 ||||||||||||||||||||||||||||||||||||||||||
    multi-threaded scalar    10358 |||||||||||||||||||||||||||||||||||||||||
  Blur Image
    single-threaded scalar    7684 ||||||||||||||||||||||||||||||
    multi-threaded scalar     8057 ||||||||||||||||||||||||||||||||

Memory
  Read Sequential
    single-threaded scalar    7955 |||||||||||||||||||||||||||||||
  Write Sequential
    single-threaded scalar    9583 ||||||||||||||||||||||||||||||||||||||
  Stdlib Allocate
    single-threaded scalar    4267 |||||||||||||||||
  Stdlib Write
    single-threaded scalar    6733 ||||||||||||||||||||||||||
  Stdlib Copy
    single-threaded scalar   15139 ||||||||||||||||||||||||||||||||||||||||||||||||||||||||||||

Stream
  Stream Copy
    single-threaded scalar    6965 |||||||||||||||||||||||||||
    single-threaded vector    6830 |||||||||||||||||||||||||||
  Stream Scale
    single-threaded scalar    6842 |||||||||||||||||||||||||||
    single-threaded vector    6983 |||||||||||||||||||||||||||
  Stream Add
    single-threaded scalar    6069 ||||||||||||||||||||||||
    single-threaded vector    6980 |||||||||||||||||||||||||||
  Stream Triad
    single-threaded scalar    6746 ||||||||||||||||||||||||||
    single-threaded vector    4930 |||||||||||||||||||

Integer Score:                2832 |||||||||||
Floating Point Score:         5901 |||||||||||||||||||||||
Memory Score:                 8735 ||||||||||||||||||||||||||||||||||
Stream Score:                 6543 ||||||||||||||||||||||||||

Overall Geekbench Score:      5457 |||||||||||||||||||||
As you can see, the Geekbench tests shows much more decent score compare to the Unixbench test.
Testing again showed pretty much the same results:
System Information
  Platform:                  Linux x86 (32-bit)
  Compiler:                  GCC 4.1.2 20070925 (Red Hat 4.1.2-33)
  Operating System:          Linux 2.6.32-042stab084.26 i686
  Model:                     Linux PC (Intel(R) Xeon(R) CPU E3-1240 V2 @ 3.40GHz)
  Motherboard:               Unknown Motherboard
  Processor:                 Intel(R) Xeon(R) CPU E3-1240 V2 @ 3.40GHz
  Processor ID:              GenuineIntel Family 6 Model 58 Stepping 9
  Logical Processors:        1
  Physical Processors:       1
  Processor Frequency:       3.40 GHz
  L1 Instruction Cache:      0.00 B
  L1 Data Cache:             0.00 B
  L2 Cache:                  256 KB
  L3 Cache:                  0.00 B
  Bus Frequency:             0.00 Hz
  Memory:                    256 MB
  Memory Type:               N/A
  SIMD:                      1
  BIOS:                      N/A
  Processor Model:                 Intel(R) Xeon(R) CPU E3-1240 V2 @ 3.40GHz
  Processor Cores:           1

Integer
  Blowfish
    single-threaded scalar    2427 |||||||||
    multi-threaded scalar     2504 ||||||||||
  Text Compress
    single-threaded scalar    2673 ||||||||||
    multi-threaded scalar     2594 ||||||||||
  Text Decompress
    single-threaded scalar    3264 |||||||||||||
    multi-threaded scalar     3347 |||||||||||||
  Image Compress
    single-threaded scalar    2059 ||||||||
    multi-threaded scalar     1983 |||||||
  Image Decompress
    single-threaded scalar    1721 ||||||
    multi-threaded scalar     1757 |||||||
  Lua
    single-threaded scalar    4210 ||||||||||||||||
    multi-threaded scalar     4044 ||||||||||||||||

Floating Point
  Mandelbrot
    single-threaded scalar    2891 |||||||||||
    multi-threaded scalar     2901 |||||||||||
  Dot Product
    single-threaded scalar    4090 ||||||||||||||||
    multi-threaded scalar     4817 |||||||||||||||||||
    single-threaded vector    7327 |||||||||||||||||||||||||||||
    multi-threaded vector     8375 |||||||||||||||||||||||||||||||||
  LU Decomposition
    single-threaded scalar    2446 |||||||||
    multi-threaded scalar     3546 ||||||||||||||
  Primality Test
    single-threaded scalar    5039 ||||||||||||||||||||
    multi-threaded scalar     4051 ||||||||||||||||
  Sharpen Image
    single-threaded scalar   11125 ||||||||||||||||||||||||||||||||||||||||||||
    multi-threaded scalar    11417 |||||||||||||||||||||||||||||||||||||||||||||
  Blur Image
    single-threaded scalar    8974 |||||||||||||||||||||||||||||||||||
    multi-threaded scalar     8794 |||||||||||||||||||||||||||||||||||

Memory
  Read Sequential
    single-threaded scalar    8664 ||||||||||||||||||||||||||||||||||
  Write Sequential
    single-threaded scalar   11079 ||||||||||||||||||||||||||||||||||||||||||||
  Stdlib Allocate
    single-threaded scalar    4990 |||||||||||||||||||
  Stdlib Write
    single-threaded scalar    6686 ||||||||||||||||||||||||||
  Stdlib Copy
    single-threaded scalar   14360 |||||||||||||||||||||||||||||||||||||||||||||||||||||||||

Stream
  Stream Copy
    single-threaded scalar    7323 |||||||||||||||||||||||||||||
    single-threaded vector    9383 |||||||||||||||||||||||||||||||||||||
  Stream Scale
    single-threaded scalar    7872 |||||||||||||||||||||||||||||||
    single-threaded vector    7252 |||||||||||||||||||||||||||||
  Stream Add
    single-threaded scalar    5981 |||||||||||||||||||||||
    single-threaded vector    7262 |||||||||||||||||||||||||||||
  Stream Triad
    single-threaded scalar    7051 ||||||||||||||||||||||||||||
    single-threaded vector    5748 ||||||||||||||||||||||

Integer Score:                2715 ||||||||||
Floating Point Score:         6128 ||||||||||||||||||||||||
Memory Score:                 9155 ||||||||||||||||||||||||||||||||||||
Stream Score:                 7234 ||||||||||||||||||||||||||||

Overall Geekbench Score:      5649 ||||||||||||||||||||||
More recently I have decided to include the FreeVPS.us benchmark in the tests and here are the results:
CPU model :  Intel(R) Xeon(R) CPU E3-1240 V2 @ 3.40GHz
Number of cores : 1
CPU frequency :  3400.140 MHz
Total amount of ram : 256 MB
Total amount of swap : 256 MB
System uptime :   22:58,
Download speed from CacheFly: 39.9MB/s
Download speed from Coloat, Atlanta GA: 39.0MB/s
Download speed from Softlayer, Dallas, TX: 12.8MB/s
Download speed from Linode, Tokyo, JP: 6.40MB/s
Download speed from i3d.net, NL: 10.6MB/s
Download speed from Leaseweb, Haarlem, NL: 13.4MB/s
Download speed from Softlayer, Singapore: 5.05MB/s
Download speed from Softlayer, Seattle, WA: 14.9MB/s
Download speed from Softlayer, San Jose, CA: 14.6MB/s
Download speed from Softlayer, Washington, DC: 42.7MB/s
I/O speed :  87.8 MB/s
Testing again showed similar results:
wget freevps.us/downloads/bench.sh -O - -o /dev/null|bash
CPU model :  Intel(R) Xeon(R) CPU E3-1240 V2 @ 3.40GHz
Number of cores : 1
CPU frequency :  3400.140 MHz
Total amount of ram : 256 MB
Total amount of swap : 256 MB
System uptime :   23:14,
Download speed from CacheFly: 40.6MB/s
Download speed from Coloat, Atlanta GA: 37.8MB/s
Download speed from Softlayer, Dallas, TX: 27.8MB/s
Download speed from Linode, Tokyo, JP: 5.82MB/s
Download speed from i3d.net, NL: 11.4MB/s
Download speed from Leaseweb, Haarlem, NL: 13.8MB/s
Download speed from Softlayer, Singapore: 3.72MB/s
Download speed from Softlayer, Seattle, WA: 14.1MB/s
Download speed from Softlayer, San Jose, CA: 16.3MB/s
Download speed from Softlayer, Washington, DC: 22.3MB/s
I/O speed :  93.2 MB/s
Overall, the download speed on the east coast is the best and on the west coast and Europe is pretty good, the download speed to Asia is perhaps not the best, however is reasonable.
All in all, I would say none of the benchmarks really gave me the “wow” factor. However in general the performance is not bad either.
Customer Service and Support
The last time I wrote a review on BlueVM, the ticket reply was not exactly too short. Has this improved a bit since the last review?
Below is a screenshot of a ticket exchange that I have had with the provider on a fairly straightforward question. The initial ticket was submitted on a Saturday as 12:14 and the reply was received on Sunday at 7am. I responded the ticket the next day at 8pm and the issue was resolved roughly about 18 hours later.

As usual the ticket response is not the fastest I have seen, however given that this issue is not the most urgent one and it was during a weekend, I would say the speed is not impressive but definitely reasonable.
Conclusions
Overall when I started to write this review I was expecting similar level of everything as I have received previously – whether it is the VPS itself or service, and this seems to be exactly what I have received. It is an ultra-low cost VPS with a reasonable performance and reasonable ticket response time.
However what really makes it stand out is the beautiful user interface it has and the fact that Justin has decided to release the project as an open-sourced one and has a free version has definitely earned himself as well as BlueVM a lot of credit/free advertising. Granted this review should be purely based off the VPS itself rather than things that are done with the BlueVM as a company, however what he has done is definitely a true reflection of the “low end” spirit, which is, people who are more knowledgeable with the VPS share their knowledge with people who might come in knowing less (or even people who are more familiar with a certain aspect sharing their knowledge with people who know less in that particular aspect) and everyone ended up learning more in the process, this is what was initially drawn me into the low end VPS community and I am sure it is the reason why a lot of people are devoting their valuable time and effort in helping others in various online places as well.
Their domain is highjacked now.
@Anuraag – Indeed, I am not sure what to comment about this. I am sure there are many people who are not happy with the service that they have received from BlueVM and some choose to resolve that to DDOS attacks/domain hijacking, I am not sure if either way would get problem resolved or making them changing their existing practice. As such, there is really little upside (other than letting out the anger) to do so.
BlueVM indeed have very amazing prices. Too bad most review shows poor support
I am one of the poor souls that tried BlueVM and did not have much success… This was in March of 2015. More downtime than up. Feathur was down, Cloudflare errors on their website and more. I would amend this review.
I wish you revive and write more reviews on vps