
96MB Low End VPS Review Part 69–Prometeus Biz Xen 5
There are a few providers in the low end VPS community which are constantly ranked among the top providers, such as BuyVM, Ramnode and Prometeus. Unlike other providers, who seem to focus exclusively on the low end VPS market, Prometeus is also caters to the more serious business clientele by offering what they call the “Biz” plans. Those plans are most likely slightly more expensive than the regular plans, but should have less number of VPS to share the physical server and has more restrictions in terms of what can be run on the server to ensure the best service experience for everyone. However, is it really as good as what have claimed to be? Let’s take a look.
Basic Information and Set Up
Thanks to LowEndBox, I was able to take advantage of the special offer from Prometeus on their Biz Xen plans, which is normally outside of the “low end” VPS range:

As you can see, the disk space offered is quite small compare to the “typical” 512MB RAM VPS offers, however this is because they do not oversell the hard drive space.
The promo code also works on all other Biz Xen plans, so if you need something more than 512MB of RAM, you can get it with a nice discount as well although it would be out of the LEB (7USD per month) range even with the annual discount.
The sign up process is pretty standard and I was able to get the VPS the moment my Paypal invoice payment confirmation email arrives. The root password assigned was random and the SolusVM username is assigned by the system.
Their WHMCS system is using the secured HTTPS protocol and once logged in, the service is shown under My Services:
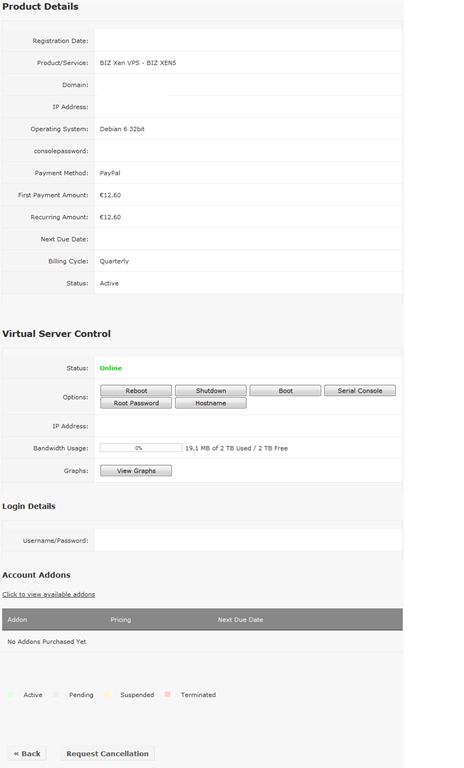
As you can see, there are several buttons available that you could use to control the VPS, and they all seems to work:


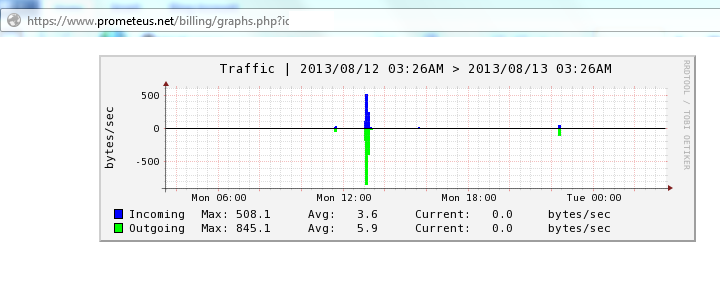
Clicking on the View Graph button only brought up the traffic graph:
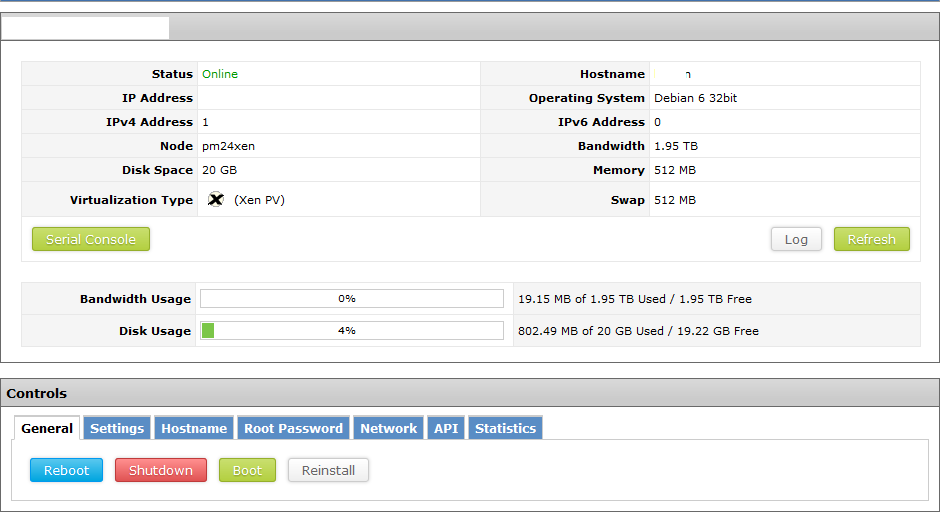
The SolusVM interface of Promteus is also on HTTPS protocol, and once logged in, a pretty standard SolusVM interface was shown:
There are quite a few OS installation options, which not only includes the base OS but a few of them with the desktop pre-installed as well, however there is no turnkey template available:

Instant rDNS is available since Prometeus own the IP block:

And even though they do not provide backup space within the SolusVM control panel, Prometeus does offer 25GB of offsite backup space for free with every single Xen 1-5 plan. The account is DirectAdmin based but there is not much to configure there:

As you can see, you are only allow to have one FTP account, and you are allowed to have 25GB of space and 100GB of bandwidth. You can, however, add your own domains and subdomains there although I am not sure if hosting a website is allowed in this case since the space is meant for use with backups.
Test on the VPS
Unlike other major providers who are mostly offering multiple locations, Prometeus is focused in one location: CDLan datacenter in Millan, Italy (which is one of the largest campus/internet exchange in Italy as per LowEndBox). The VPS comes with 512MB of RAM and 512MB of swap space, 20GB of hard drive space and I have installed Debian 6 32bit for testing purposes.
When the OS was first loaded, about 15MB of RAM was used, which is slightly larger than the standard OpenVZ RAM usage:
 free -m
             total       used       free     shared    buffers     cached
Mem:           500         64        436          0          3         45
-/+ buffers/cache:         15        485
Swap:          511          0        511
Top shows some standard processes are running:
top - 00:44:56 up 13:26,  2 users,  load average: 0.00, 0.00, 0.00
Tasks:  56 total,   1 running,  55 sleeping,   0 stopped,   0 zombie
Cpu(s):  0.0%us,  0.0%sy,  0.0%ni,100.0%id,  0.0%wa,  0.0%hi,  0.0%si,  0.0%st
Mem:    512948k total,    65848k used,   447100k free,     3508k buffers
Swap:   524280k total,        0k used,   524280k free,    46660k cached

  PID USER      PR  NI  VIRT  RES  SHR S %CPU %MEM    TIME+  COMMAND
 1173 root      20   0  8268 2880 2360 S    0  0.6   0:00.07 sshd
 1140 root      20   0  8268 2868 2352 S    0  0.6   0:00.03 sshd
 1143 root      20   0  3952 2660 1352 S    0  0.5   0:00.17 bash
 1176 root      20   0  3952 2652 1348 S    0  0.5   0:00.16 bash
  557 root      20   0 27324 1428 1032 S    0  0.3   0:00.02 rsyslogd
 1194 root      20   0  2344 1128  904 R    0  0.2   0:00.00 top
  848 root      20   0  5504  976  584 S    0  0.2   0:00.02 sshd
  861 Debian-e  20   0  6528  932  616 S    0  0.2   0:00.02 exim4
  615 root      20   0  2304  868  680 S    0  0.2   0:00.06 cron
  150 root      16  -4  2268  744  404 S    0  0.1   0:00.03 udevd
    1 root      20   0  2044  720  624 S    0  0.1   0:00.70 init
  197 root      18  -2  2264  668  332 S    0  0.1   0:00.00 udevd
  198 root      18  -2  2264  668  332 S    0  0.1   0:00.00 udevd
  880 root      20   0  1716  572  492 S    0  0.1   0:00.00 getty
  881 root      20   0  1716  572  492 S    0  0.1   0:00.00 getty
  883 root      20   0  1716  572  492 S    0  0.1   0:00.00 getty
  885 root      20   0  1716  568  492 S    0  0.1   0:00.00 getty
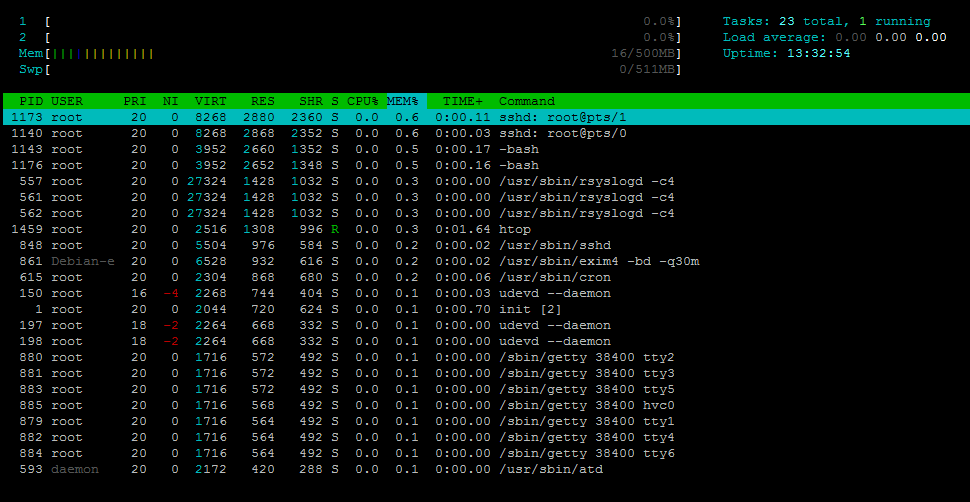
And htop output:
About 803MB of hard drive space was used:
 df -h
Filesystem            Size  Used Avail Use% Mounted on
/dev/xvda1             20G  803M   18G   5% /
tmpfs                 251M     0  251M   0% /lib/init/rw
udev                  241M   24K  241M   1% /dev
tmpfs                 251M  4.0K  251M   1% /dev/shm
And 1% of INodes are used:
 df -i
Filesystem            Inodes   IUsed   IFree IUse% Mounted on
/dev/xvda1           2621440   24955 2596485    1% /
tmpfs                  64118       4   64114    1% /lib/init/rw
udev                   61455     390   61065    1% /dev
tmpfs                  64118       3   64115    1% /dev/shm
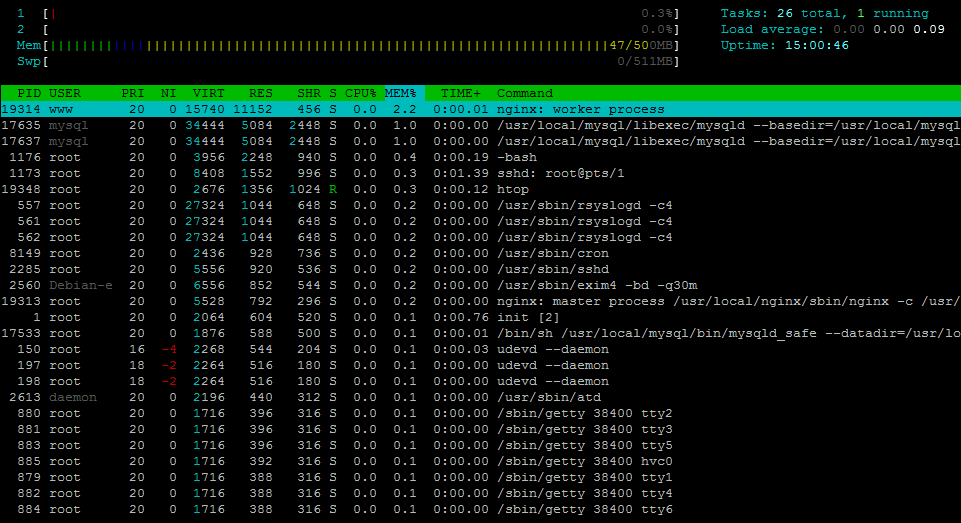
When the full LNMP stack was loaded, 47MB of RAM was used:
 free -m
             total       used       free     shared    buffers     cached
Mem:           500        471         29          0         20        403
-/+ buffers/cache:         47        453
Swap:          511          0        511
Top showing the LNMP stack:
top - 09:55:53 up 14:37,  1 user,  load average: 0.04, 0.42, 0.55
Tasks:  58 total,   1 running,  57 sleeping,   0 stopped,   0 zombie
Cpu(s):  0.0%us,  0.0%sy,  0.0%ni,100.0%id,  0.0%wa,  0.0%hi,  0.0%si,  0.0%st
Mem:    512948k total,   483356k used,    29592k free,    21396k buffers
Swap:   524280k total,        0k used,   524280k free,   412988k cached

  PID USER      PR  NI  VIRT  RES  SHR S %CPU %MEM    TIME+  COMMAND
19314 www       20   0 15740  10m  456 S    0  2.2   0:00.01 nginx
17635 mysql     20   0 34444 5084 2448 S    0  1.0   0:00.02 mysqld
 1176 root      20   0  3956 2248  940 S    0  0.4   0:00.19 bash
 1173 root      20   0  8408 1552  996 S    0  0.3   0:01.38 sshd
19342 root      20   0  2504 1200  956 R    0  0.2   0:00.01 top
  557 root      20   0 27324 1044  648 S    0  0.2   0:00.02 rsyslogd
 2285 root      20   0  5556  920  536 S    0  0.2   0:00.00 sshd
 8149 root      20   0  2436  920  728 S    0  0.2   0:00.00 cron
 2560 Debian-e  20   0  6556  852  544 S    0  0.2   0:00.00 exim4
19313 root      20   0  5528  792  296 S    0  0.2   0:00.00 nginx
    1 root      20   0  2064  604  520 S    0  0.1   0:00.74 init
17533 root      20   0  1876  588  500 S    0  0.1   0:00.01 mysqld_safe
  150 root      16  -4  2268  544  204 S    0  0.1   0:00.03 udevd
  197 root      18  -2  2264  516  180 S    0  0.1   0:00.00 udevd
  198 root      18  -2  2264  516  180 S    0  0.1   0:00.00 udevd
 2613 daemon    20   0  2196  440  312 S    0  0.1   0:00.00 atd
  880 root      20   0  1716  396  316 S    0  0.1   0:00.00 getty
  881 root      20   0  1716  396  316 S    0  0.1   0:00.00 getty
  883 root      20   0  1716  396  316 S    0  0.1   0:00.00 getty
  885 root      20   0  1716  392  316 S    0  0.1   0:00.00 getty
  879 root      20   0  1716  388  316 S    0  0.1   0:00.00 getty
  882 root      20   0  1716  388  316 S    0  0.1   0:00.00 getty
  884 root      20   0  1716  388  316 S    0  0.1   0:00.00 getty
And htop output:
2.2GB of hard drive space was used:
 df -h
Filesystem            Size  Used Avail Use% Mounted on
/dev/xvda1             20G  2.2G   17G  12% /
tmpfs                 251M     0  251M   0% /lib/init/rw
udev                  241M   24K  241M   1% /dev
tmpfs                 251M  4.0K  251M   1% /dev/shm
And 4% of INodes were used:
 df -i
Filesystem            Inodes   IUsed   IFree IUse% Mounted on
/dev/xvda1           2621440   80278 2541162    4% /
tmpfs                  64118       4   64114    1% /lib/init/rw
udev                   61455     390   61065    1% /dev
tmpfs                  64118       3   64115    1% /dev/shm
Uptime shows the VPS is mostly idle:
 uptime
 00:52:50 up 13:34,  2 users,  load average: 0.00, 0.00, 0.00
VMStats shows there is no iowait:
vmstat
procs -----------memory---------- ---swap-- -----io---- -system-- ----cpu----
 r  b   swpd   free   buff  cache   si   so    bi    bo   in   cs us sy id wa
 0  0      0 434868   4580  57132    0    0     0     0    5    1  0  0 100  0
There are two CPU cores assigned to this VPS, and the CPU is E5-2620 with no throttle of the CPU:
cat /proc/cpuinfo
processor       : 0
vendor_id       : GenuineIntel
cpu family      : 6
model           : 45
model name      : Intel(R) Xeon(R) CPU E5-2620 0 @ 2.00GHz
stepping        : 7
cpu MHz         : 1999.999
cache size      : 15360 KB
fdiv_bug        : no
hlt_bug         : no
f00f_bug        : no
coma_bug        : no
fpu             : yes
fpu_exception   : yes
cpuid level     : 13
wp              : yes
flags           : fpu de tsc msr pae cx8 sep cmov pat clflush mmx fxsr sse sse2 ss ht nx constant_tsc nonstop_tsc pni pclmulqdq ssse3 sse4_1 sse4_2 x2apic popcnt aes avx hypervisor
bogomips        : 3999.99
clflush size    : 64
cache_alignment : 64
address sizes   : 46 bits physical, 48 bits virtual
power management:

processor       : 1
vendor_id       : GenuineIntel
cpu family      : 6
model           : 45
model name      : Intel(R) Xeon(R) CPU E5-2620 0 @ 2.00GHz
stepping        : 7
cpu MHz         : 1999.999
cache size      : 15360 KB
fdiv_bug        : no
hlt_bug         : no
f00f_bug        : no
coma_bug        : no
fpu             : yes
fpu_exception   : yes
cpuid level     : 13
wp              : yes
flags           : fpu de tsc msr pae cx8 sep cmov pat clflush mmx fxsr sse sse2 ss ht nx constant_tsc nonstop_tsc pni pclmulqdq ssse3 sse4_1 sse4_2 x2apic popcnt aes avx hypervisor
bogomips        : 3999.99
clflush size    : 64
cache_alignment : 64
address sizes   : 46 bits physical, 48 bits virtual
power management:
Meminfo output:
 cat /proc/meminfo
MemTotal:         512948 kB
MemFree:            8420 kB
Buffers:           20092 kB
Cached:           447280 kB
SwapCached:            0 kB
Active:            49668 kB
Inactive:         435744 kB
Active(anon):       6200 kB
Inactive(anon):    11876 kB
Active(file):      43468 kB
Inactive(file):   423868 kB
Unevictable:           0 kB
Mlocked:               0 kB
HighTotal:             0 kB
HighFree:              0 kB
LowTotal:         512948 kB
LowFree:            8420 kB
SwapTotal:        524280 kB
SwapFree:         524280 kB
Dirty:                 0 kB
Writeback:             0 kB
AnonPages:         18012 kB
Mapped:             5876 kB
Shmem:                36 kB
Slab:              15328 kB
SReclaimable:      12728 kB
SUnreclaim:         2600 kB
KernelStack:         488 kB
PageTables:          496 kB
NFS_Unstable:          0 kB
Bounce:                0 kB
WritebackTmp:          0 kB
CommitLimit:      780752 kB
Committed_AS:      76260 kB
VmallocTotal:     335864 kB
VmallocUsed:         844 kB
VmallocChunk:     334864 kB
HardwareCorrupted:     0 kB
HugePages_Total:       0
HugePages_Free:        0
HugePages_Rsvd:        0
HugePages_Surp:        0
Hugepagesize:       2048 kB
DirectMap4k:      524288 kB
DirectMap2M:           0 kB
And time sync:
 time sync

real    0m0.041s
user    0m0.004s
sys     0m0.004s
For the network test, I was initially using the wget tests, however the download speed looks more like a Gbit port to me:
 wget cachefly.cachefly.net/100mb.test -O /dev/null
--2013-07-18 10:20:26--  http://cachefly.cachefly.net/100mb.test
Resolving cachefly.cachefly.net (cachefly.cachefly.net)... 158.58.172.129
Connecting to cachefly.cachefly.net (cachefly.cachefly.net)|158.58.172.129|:80... connected.
HTTP request sent, awaiting response... 200 OK
Length: 104857600 (100M) [application/octet-stream]
Saving to: `/dev/null'

100%[=======================================================================================================================================>] 104,857,600 73.6M/s   in 1.4s

2013-07-18 10:20:28 (73.6 MB/s) - `/dev/null' saved [104857600/104857600]
Testing again (exactly a month later, as I am writing this post!), shows slower speed, however is definitely higher than what I would normally see on a 100mbit port:
wget cachefly.cachefly.net/100mb.test -O /dev/null
--2013-08-18 22:57:47--  http://cachefly.cachefly.net/100mb.test
Resolving cachefly.cachefly.net (cachefly.cachefly.net)... 158.58.172.129
Connecting to cachefly.cachefly.net (cachefly.cachefly.net)|158.58.172.129|:80... connected.
HTTP request sent, awaiting response... 200 OK
Length: 104857600 (100M) [application/octet-stream]
Saving to: `/dev/null'

100%[======================================>] 104,857,600 28.3M/s   in 3.5s

2013-08-18 22:57:51 (28.3 MB/s) - `/dev/null' saved [104857600/104857600]
As such, I’ve decided to use the aget to test download a 1GB file to see how the full port speed is like:
The first test is to download the ThinkBroadband test file, which is located in Epsom, UK (in the previous posts I’ve always described them as in London, UK. However Epsom is about 45 minutes drive from London, UK, so they are actually not that far apart in the view of the Internet.
aget -n 10 http://ipv4.download.thinkbroadband.com/1GB.zip
 Attempting to read log file aget-1GB.zip.log for resuming download job...
 Couldn't find log file for this download, starting a clean job...
 Head-Request Connection established
 Downloading /1GB.zip (1073741824 bytes) from site ipv4.download.thinkbroadband.com(80.249.99.148:80). Number of Threads: 10
..                                                 [4% completed]
..                                                 [4% completed]
.....                                              [9% completed]
.......                                            [14% completed]
..........                                         [19% completed]
............                                       [24% completed]
...............                                    [29% completed]
.................                                  [34% completed]
....................                               [39% completed]
......................                             [44% completed]
.........................                          [49% completed]
...........................                        [54% completed]
..............................                     [59% completed]
................................                   [64% completed]
...................................                [69% completed]
.....................................              [74% completed]
........................................           [79% completed]
..........................................         [84% completed]
.............................................      [89% completed]
...............................................    [94% completed]
.................................................. [99% completed]
.................................................. [100% completed]
 Download completed, job completed in 51 seconds. (20560 Kb/sec)
 Shutting down...
Testing again shows very consistent results:
aget -n 10 http://ipv4.download.thinkbroadband.com/1GB.zip
 Attempting to read log file aget-1GB.zip.log for resuming download job...
 Couldn't find log file for this download, starting a clean job...
 Head-Request Connection established
 Downloading /1GB.zip (1073741824 bytes) from site ipv4.download.thinkbroadband.com(80.249.99.148:80). Number of Threads: 10
..                                                 ..                                                 [4% completed]
[4% completed]
.....                                              [9% completed]
.......                                            [14% completed]
..........                                         [19% completed]
............                                       [24% completed]
...............                                    [29% completed]
.................                                  [34% completed]
....................                               [39% completed]
......................                             [44% completed]
.........................                          [49% completed]
...........................                        [54% completed]
..............................                     [59% completed]
................................                   [64% completed]
...................................                [69% completed]
.....................................              [74% completed]
........................................           [79% completed]
..........................................         [84% completed]
.............................................      [89% completed]
...............................................    [94% completed]
.................................................. [99% completed]
.................................................. [100% completed]
 Download completed, job completed in 41 seconds. (25575 Kb/sec)
 Shutting down...
As you can see, the download speed is pretty consistent.
I have also used the Hostdime’s test file located in Orlando, Florida:
aget -n 10 http://72.29.70.131/1gbfile.tgz
 Attempting to read log file aget-1gbfile.tgz.log for resuming download job...
 Couldn't find log file for this download, starting a clean job...
 Head-Request Connection established
 Downloading /1gbfile.tgz (1023410176 bytes) from site 72.29.70.131(72.29.70.131:80). Number of Threads: 10
..                                                 [4% completed]
.....                                              [9% completed]
.......                                            [14% completed]
..........                                         [19% completed]
............                                       [24% completed]
...............                                    [29% completed]
.................                                  [34% completed]
....................                               [39% completed]
......................                             [44% completed]
.........................                          [49% completed]
...........................                        [54% completed]
..............................                     [59% completed]
................................                   [64% completed]
...................................                [69% completed]
.....................................              [74% completed]
........................................           [79% completed]
..........................................         [84% completed]
.............................................      [89% completed]
...............................................    [94% completed]
.................................................. [99% completed]
.................................................. [100% completed]
 Download completed, job completed in 49 seconds. (20396 Kb/sec)
 Shutting down...
Testing again shows fairly consistent results:
aget -n 10 http://72.29.70.131/1gbfile.tgz
 Attempting to read log file aget-1gbfile.tgz.log for resuming download job...
 Couldn't find log file for this download, starting a clean job...
 Head-Request Connection established
 Downloading /1gbfile.tgz (1023410176 bytes) from site 72.29.70.131(72.29.70.131:80). Number of Threads: 10
..                                                 [4% completed]
.....                                              .....                                              [9% completed]
[9% completed]
.......                                            [14% completed]
..........                                         [19% completed]
............                                       [24% completed]
...............                                    [29% completed]
.................                                  [34% completed]
....................                               [39% completed]
....................                               [39% completed]
....................                               [39% completed]
......................                             [44% completed]
.........................                          [49% completed]
...........................                        [54% completed]
..............................                     [59% completed]
................................                   [64% completed]
...................................                [69% completed]
.....................................              [74% completed]
........................................           [79% completed]
..........................................         [84% completed]
.............................................      [89% completed]
...............................................    [94% completed]
.................................................. [99% completed]
.................................................. [100% completed]
 Download completed, job completed in 52 seconds. (19219 Kb/sec)
 Shutting down...
As you can see, through both tests, the port speed is fairly consistent at 20MB/s. Even though the speed itself is not the most amazing that I’ve seen (however still fairly impressive), the consistency is definitely something great.
For the upload tests, I’ve had a bit of panic there as I do not recall myself having other VPS in Europe other than the one from Prometeus itself, which is obviously not good if I am testing the upload speed using a VPS within the same network. Fortunately, Anthony Smith from Inception Hosting has offered me a VPS to play around a long time ago, which was really helpful in this case.
The first test is on my VPS with Quickweb in Chicago, IL:
 wget 194.14.xxx.xxx/100mb.test -O /dev/null
--2013-08-18 16:36:16--  http://194.14.xxx.xxx/100mb.test
Connecting to 194.14.xxx.xxx:80... connected.
HTTP request sent, awaiting response... 200 OK
Length: 104857600 (100M) [application/octet-stream]
Saving to: `/dev/null'

100%[======================================>] 104,857,600  977K/s   in 1m 45s

2013-08-18 16:38:01 (973 KB/s) - `/dev/null' saved [104857600/104857600]
As you can see, the upload speed is slightly less than 1MB/s, which is not bad but is certainly not the best speed I’ve seen.
Second test is done on my test VPS with ChicagoVPS in Los Angeles, California, which is on the west coast:
wget 194.14.xxx.xxx/100mb.test -O /dev/null
--2013-08-18 12:54:41--  http://194.14.xxx.xxx/100mb.test
Connecting to 194.14.xxx.xxx:80... connected.
HTTP request sent, awaiting response... 200 OK
Length: 104857600 (100M) [application/octet-stream]
Saving to: `/dev/null'

100%[======================================>] 104,857,600  362K/s   in 4m 42s

2013-08-18 12:59:23 (364 KB/s) - `/dev/null' saved [104857600/104857600]
As you can see, the test speed is significantly worse than along the east coast, and is at 364KB/s.
Finally, the test VPS with Inception Hosting in Amsterdam, Netherlands. As both VPS (the uploading and downloading) have 1GBit port, and also because both are located within the same continent, the speed is significantly better when compare against the other upload tests.
wget 194.14.xxx.xxx/100mb.test -O /dev/null
--2013-08-18 17:10:58--  http://194.14.xxx.xxx/100mb.test
Connecting to 194.14.xxx.xxx:80... connected.
HTTP request sent, awaiting response... 200 OK
Length: 104857600 (100M) [application/octet-stream]
Saving to: `/dev/null'

100%[======================================>] 104,857,600 6.25M/s   in 16s

2013-08-18 17:11:14 (6.16 MB/s) - `/dev/null' saved [104857600/104857600]
DD tests shows very consistent disk I/O speed:
 dd if=/dev/zero of=test bs=64k count=16k conv=fdatasync
16384+0 records in
16384+0 records out
1073741824 bytes (1.1 GB) copied, 7.15632 s, 150 MB/s
Testing again showed almost exact identical speed:
 dd if=/dev/zero of=test bs=64k count=16k conv=fdatasync
16384+0 records in
16384+0 records out
1073741824 bytes (1.1 GB) copied, 7.15632 s, 150 MB/s
The new version of ioping shows the speed in microseconds (a thousandth of a millisecond), which will give us a better picture than just using the milliseconds:
ioping -c 10 .
4.0 kb from . (ext3 /dev/xvda1): request=1 time=186 us
4.0 kb from . (ext3 /dev/xvda1): request=2 time=358 us
4.0 kb from . (ext3 /dev/xvda1): request=3 time=415 us
4.0 kb from . (ext3 /dev/xvda1): request=4 time=326 us
4.0 kb from . (ext3 /dev/xvda1): request=5 time=315 us
4.0 kb from . (ext3 /dev/xvda1): request=6 time=334 us
4.0 kb from . (ext3 /dev/xvda1): request=7 time=313 us
4.0 kb from . (ext3 /dev/xvda1): request=8 time=656 us
4.0 kb from . (ext3 /dev/xvda1): request=9 time=327 us
4.0 kb from . (ext3 /dev/xvda1): request=10 time=394 us

--- . (ext3 /dev/xvda1) ioping statistics ---
10 requests completed in 9.0 s, 2.8 k iops, 10.8 mb/s
min/avg/max/mdev = 186 us / 362 us / 656 us / 113 us
As you can see, the roundtrip time for the ioping varies slightly between 0.2ms to 0.6ms, and that is fairly fast by any standard.
 ioping -c 10 .
4.0 kb from . (ext3 /dev/xvda1): request=1 time=267 us
4.0 kb from . (ext3 /dev/xvda1): request=2 time=396 us
4.0 kb from . (ext3 /dev/xvda1): request=3 time=300 us
4.0 kb from . (ext3 /dev/xvda1): request=4 time=308 us
4.0 kb from . (ext3 /dev/xvda1): request=5 time=234 us
4.0 kb from . (ext3 /dev/xvda1): request=6 time=263 us
4.0 kb from . (ext3 /dev/xvda1): request=7 time=739 us
4.0 kb from . (ext3 /dev/xvda1): request=8 time=262 us
4.0 kb from . (ext3 /dev/xvda1): request=9 time=294 us
4.0 kb from . (ext3 /dev/xvda1): request=10 time=249 us

--- . (ext3 /dev/xvda1) ioping statistics ---
10 requests completed in 9.0 s, 3.0 k iops, 11.8 mb/s
min/avg/max/mdev = 234 us / 331 us / 739 us / 142 us
The results for the second tests is fairly similar to that of the first, indicating the results are fairly consistent.
For the benchmarks, I was a little surprised with the Unixbench score:
   #    #  #    #  #  #    #          #####   ######  #    #   ####   #    #
   #    #  ##   #  #   #  #           #    #  #       ##   #  #    #  #    #
   #    #  # #  #  #    ##            #####   #####   # #  #  #       ######
   #    #  #  # #  #    ##            #    #  #       #  # #  #       #    #
   #    #  #   ##  #   #  #           #    #  #       #   ##  #    #  #    #
    ####   #    #  #  #    #          #####   ######  #    #   ####   #    #

   Version 5.1.3                      Based on the Byte Magazine Unix Benchmark

   Multi-CPU version                  Version 5 revisions by Ian Smith,
                                      Sunnyvale, CA, USA
   January 13, 2011                   johantheghost at yahoo period com

1 x Dhrystone 2 using register variables  1 2 3 4 5 6 7 8 9 10

1 x Double-Precision Whetstone  1 2 3 4 5 6 7 8 9 10

1 x Execl Throughput  1 2 3

1 x File Copy 1024 bufsize 2000 maxblocks  1 2 3

1 x File Copy 256 bufsize 500 maxblocks  1 2 3

1 x File Copy 4096 bufsize 8000 maxblocks  1 2 3

1 x Pipe Throughput  1 2 3 4 5 6 7 8 9 10

1 x Pipe-based Context Switching  1 2 3 4 5 6 7 8 9 10

1 x Process Creation  1 2 3

1 x System Call Overhead  1 2 3 4 5 6 7 8 9 10

1 x Shell Scripts (1 concurrent)  1 2 3

1 x Shell Scripts (8 concurrent)  1 2 3

2 x Dhrystone 2 using register variables  1 2 3 4 5 6 7 8 9 10

2 x Double-Precision Whetstone  1 2 3 4 5 6 7 8 9 10

2 x Execl Throughput  1 2 3

2 x File Copy 1024 bufsize 2000 maxblocks  1 2 3

2 x File Copy 256 bufsize 500 maxblocks  1 2 3

2 x File Copy 4096 bufsize 8000 maxblocks  1 2 3

2 x Pipe Throughput  1 2 3 4 5 6 7 8 9 10

2 x Pipe-based Context Switching  1 2 3 4 5 6 7 8 9 10

2 x Process Creation  1 2 3

2 x System Call Overhead  1 2 3 4 5 6 7 8 9 10

2 x Shell Scripts (1 concurrent)  1 2 3

2 x Shell Scripts (8 concurrent)  1 2 3

========================================================================
   BYTE UNIX Benchmarks (Version 5.1.3)

   System: xxxxx: GNU/Linux
   OS: GNU/Linux -- 2.6.32-5-686-bigmem -- #1 SMP Sun May 6 04:39:05 UTC 2012
   Machine: i686 (unknown)
   Language: en_US.utf8 (charmap="UTF-8", collate="UTF-8")
   CPU 0: Intel(R) Xeon(R) CPU E5-2620 0 @ 2.00GHz (4000.0 bogomips)
          Hyper-Threading, MMX, Physical Address Ext, SYSENTER/SYSEXIT
   CPU 1: Intel(R) Xeon(R) CPU E5-2620 0 @ 2.00GHz (4000.0 bogomips)
          Hyper-Threading, MMX, Physical Address Ext, SYSENTER/SYSEXIT
   11:58:04 up 16:39,  1 user,  load average: 14.13, 7.88, 4.06; runlevel 2

------------------------------------------------------------------------
Benchmark Run: Thu Jul 18 2013 11:58:04 - 12:26:01
2 CPUs in system; running 1 parallel copy of tests

Dhrystone 2 using register variables       14774065.8 lps   (10.0 s, 7 samples)
Double-Precision Whetstone                     2062.2 MWIPS (10.2 s, 7 samples)
Execl Throughput                               1209.8 lps   (30.0 s, 2 samples)
File Copy 1024 bufsize 2000 maxblocks        254842.9 KBps  (30.0 s, 2 samples)
File Copy 256 bufsize 500 maxblocks           68113.5 KBps  (30.0 s, 2 samples)
File Copy 4096 bufsize 8000 maxblocks        722578.3 KBps  (30.0 s, 2 samples)
Pipe Throughput                              424943.1 lps   (10.0 s, 7 samples)
Pipe-based Context Switching                  53169.2 lps   (10.0 s, 7 samples)
Process Creation                               2291.4 lps   (30.0 s, 2 samples)
Shell Scripts (1 concurrent)                   2965.2 lpm   (60.0 s, 2 samples)
Shell Scripts (8 concurrent)                    558.9 lpm   (60.1 s, 2 samples)
System Call Overhead                         468667.9 lps   (10.0 s, 7 samples)

System Benchmarks Index Values               BASELINE       RESULT    INDEX
Dhrystone 2 using register variables         116700.0   14774065.8   1266.0
Double-Precision Whetstone                       55.0       2062.2    374.9
Execl Throughput                                 43.0       1209.8    281.4
File Copy 1024 bufsize 2000 maxblocks          3960.0     254842.9    643.5
File Copy 256 bufsize 500 maxblocks            1655.0      68113.5    411.6
File Copy 4096 bufsize 8000 maxblocks          5800.0     722578.3   1245.8
Pipe Throughput                               12440.0     424943.1    341.6
Pipe-based Context Switching                   4000.0      53169.2    132.9
Process Creation                                126.0       2291.4    181.9
Shell Scripts (1 concurrent)                     42.4       2965.2    699.3
Shell Scripts (8 concurrent)                      6.0        558.9    931.5
System Call Overhead                          15000.0     468667.9    312.4
                                                                   ========
System Benchmarks Index Score                                         452.7

------------------------------------------------------------------------
Benchmark Run: Thu Jul 18 2013 12:26:01 - 12:54:00
2 CPUs in system; running 2 parallel copies of tests

Dhrystone 2 using register variables       29390055.4 lps   (10.0 s, 7 samples)
Double-Precision Whetstone                     4118.3 MWIPS (10.2 s, 7 samples)
Execl Throughput                               2430.5 lps   (29.9 s, 2 samples)
File Copy 1024 bufsize 2000 maxblocks        303148.8 KBps  (30.0 s, 2 samples)
File Copy 256 bufsize 500 maxblocks           83926.2 KBps  (30.0 s, 2 samples)
File Copy 4096 bufsize 8000 maxblocks        962925.3 KBps  (30.0 s, 2 samples)
Pipe Throughput                              851513.1 lps   (10.0 s, 7 samples)
Pipe-based Context Switching                 107030.0 lps   (10.0 s, 7 samples)
Process Creation                               4551.7 lps   (30.0 s, 2 samples)
Shell Scripts (1 concurrent)                   4535.1 lpm   (60.0 s, 2 samples)
Shell Scripts (8 concurrent)                    593.9 lpm   (60.1 s, 2 samples)
System Call Overhead                         861449.0 lps   (10.0 s, 7 samples)

System Benchmarks Index Values               BASELINE       RESULT    INDEX
Dhrystone 2 using register variables         116700.0   29390055.4   2518.4
Double-Precision Whetstone                       55.0       4118.3    748.8
Execl Throughput                                 43.0       2430.5    565.2
File Copy 1024 bufsize 2000 maxblocks          3960.0     303148.8    765.5
File Copy 256 bufsize 500 maxblocks            1655.0      83926.2    507.1
File Copy 4096 bufsize 8000 maxblocks          5800.0     962925.3   1660.2
Pipe Throughput                               12440.0     851513.1    684.5
Pipe-based Context Switching                   4000.0     107030.0    267.6
Process Creation                                126.0       4551.7    361.2
Shell Scripts (1 concurrent)                     42.4       4535.1   1069.6
Shell Scripts (8 concurrent)                      6.0        593.9    989.9
System Call Overhead                          15000.0     861449.0    574.3
                                                                   ========
System Benchmarks Index Score                                         741.5
Testing again gives similar results:
========================================================================
   BYTE UNIX Benchmarks (Version 5.1.3)

   System: xxxxxx: GNU/Linux
   OS: GNU/Linux -- 2.6.32-5-686-bigmem -- #1 SMP Sun May 6 04:39:05 UTC 2012
   Machine: i686 (unknown)
   Language: en_US.utf8 (charmap="UTF-8", collate="UTF-8")
   CPU 0: Intel(R) Xeon(R) CPU E5-2620 0 @ 2.00GHz (4000.0 bogomips)
          Hyper-Threading, MMX, Physical Address Ext, SYSENTER/SYSEXIT
   CPU 1: Intel(R) Xeon(R) CPU E5-2620 0 @ 2.00GHz (4000.0 bogomips)
          Hyper-Threading, MMX, Physical Address Ext, SYSENTER/SYSEXIT
   11:02:09 up 15:43,  1 user,  load average: 0.08, 0.02, 0.01; runlevel 2

------------------------------------------------------------------------
Benchmark Run: Thu Jul 18 2013 11:02:09 - 11:30:06
2 CPUs in system; running 1 parallel copy of tests

Dhrystone 2 using register variables       15662318.1 lps   (10.0 s, 7 samples)
Double-Precision Whetstone                     2079.8 MWIPS (10.3 s, 7 samples)
Execl Throughput                               1291.9 lps   (30.0 s, 2 samples)
File Copy 1024 bufsize 2000 maxblocks        271230.5 KBps  (30.0 s, 2 samples)
File Copy 256 bufsize 500 maxblocks           71523.4 KBps  (30.0 s, 2 samples)
File Copy 4096 bufsize 8000 maxblocks        778123.4 KBps  (30.0 s, 2 samples)
Pipe Throughput                              439153.7 lps   (10.0 s, 7 samples)
Pipe-based Context Switching                  55155.4 lps   (10.0 s, 7 samples)
Process Creation                               2399.4 lps   (30.0 s, 2 samples)
Shell Scripts (1 concurrent)                   3095.1 lpm   (60.0 s, 2 samples)
Shell Scripts (8 concurrent)                    586.1 lpm   (60.1 s, 2 samples)
System Call Overhead                         478474.2 lps   (10.0 s, 7 samples)

System Benchmarks Index Values               BASELINE       RESULT    INDEX
Dhrystone 2 using register variables         116700.0   15662318.1   1342.1
Double-Precision Whetstone                       55.0       2079.8    378.1
Execl Throughput                                 43.0       1291.9    300.4
File Copy 1024 bufsize 2000 maxblocks          3960.0     271230.5    684.9
File Copy 256 bufsize 500 maxblocks            1655.0      71523.4    432.2
File Copy 4096 bufsize 8000 maxblocks          5800.0     778123.4   1341.6
Pipe Throughput                               12440.0     439153.7    353.0
Pipe-based Context Switching                   4000.0      55155.4    137.9
Process Creation                                126.0       2399.4    190.4
Shell Scripts (1 concurrent)                     42.4       3095.1    730.0
Shell Scripts (8 concurrent)                      6.0        586.1    976.9
System Call Overhead                          15000.0     478474.2    319.0
                                                                   ========
System Benchmarks Index Score                                         473.7

------------------------------------------------------------------------
Benchmark Run: Thu Jul 18 2013 11:30:06 - 11:58:04
2 CPUs in system; running 2 parallel copies of tests

Dhrystone 2 using register variables       30996169.2 lps   (10.0 s, 7 samples)
Double-Precision Whetstone                     4164.5 MWIPS (10.2 s, 7 samples)
Execl Throughput                               2514.3 lps   (29.9 s, 2 samples)
File Copy 1024 bufsize 2000 maxblocks        311047.6 KBps  (30.0 s, 2 samples)
File Copy 256 bufsize 500 maxblocks           85164.8 KBps  (30.0 s, 2 samples)
File Copy 4096 bufsize 8000 maxblocks       1000258.3 KBps  (30.0 s, 2 samples)
Pipe Throughput                              871429.2 lps   (10.0 s, 7 samples)
Pipe-based Context Switching                 106924.7 lps   (10.0 s, 7 samples)
Process Creation                               4411.3 lps   (30.0 s, 2 samples)
Shell Scripts (1 concurrent)                   4338.0 lpm   (60.0 s, 2 samples)
Shell Scripts (8 concurrent)                    555.6 lpm   (60.1 s, 2 samples)
System Call Overhead                         844979.2 lps   (10.0 s, 7 samples)

System Benchmarks Index Values               BASELINE       RESULT    INDEX
Dhrystone 2 using register variables         116700.0   30996169.2   2656.1
Double-Precision Whetstone                       55.0       4164.5    757.2
Execl Throughput                                 43.0       2514.3    584.7
File Copy 1024 bufsize 2000 maxblocks          3960.0     311047.6    785.5
File Copy 256 bufsize 500 maxblocks            1655.0      85164.8    514.6
File Copy 4096 bufsize 8000 maxblocks          5800.0    1000258.3   1724.6
Pipe Throughput                               12440.0     871429.2    700.5
Pipe-based Context Switching                   4000.0     106924.7    267.3
Process Creation                                126.0       4411.3    350.1
Shell Scripts (1 concurrent)                     42.4       4338.0   1023.1
Shell Scripts (8 concurrent)                      6.0        555.6    926.1
System Call Overhead                          15000.0     844979.2    563.3
                                                                   ========
System Benchmarks Index Score                                         743.8
As you can see, the benchmark score is not exactly high. In fact, it is probably one of the less impressive ones, particularly considering that there are two CPU cores assigned to this VPS.
For the Geekbench, the scores are a little better:
System Information
  Platform:                  Linux x86 (32-bit)
  Compiler:                  GCC 4.1.2 20070925 (Red Hat 4.1.2-33)
  Operating System:          Linux 2.6.32-5-686-bigmem i686
  Model:                     Linux PC (Intel(R) Xeon(R) CPU E5-2620 0 @ 2.00GHz)
  Motherboard:               Unknown Motherboard
  Processor:                 Intel(R) Xeon(R) CPU E5-2620 0 @ 2.00GHz
  Processor ID:              GenuineIntel Family 6 Model 45 Stepping 7
  Logical Processors:        2
  Physical Processors:       1
  Processor Frequency:       2.00 GHz
  L1 Instruction Cache:      0.00 B
  L1 Data Cache:             0.00 B
  L2 Cache:                  256 KB
  L3 Cache:                  0.00 B
  Bus Frequency:             0.00 Hz
  Memory:                    501 MB
  Memory Type:               N/A
  SIMD:                      1
  BIOS:                      N/A
  Processor Model:                  Intel(R) Xeon(R) CPU E5-2620 0 @ 2.00GHz
  Processor Cores:           2

Integer
  Blowfish
    single-threaded scalar    1287 |||||
    multi-threaded scalar     2576 ||||||||||
  Text Compress
    single-threaded scalar    1686 ||||||
    multi-threaded scalar     3039 ||||||||||||
  Text Decompress
    single-threaded scalar    1858 |||||||
    multi-threaded scalar     3551 ||||||||||||||
  Image Compress
    single-threaded scalar    1440 |||||
    multi-threaded scalar     2397 |||||||||
  Image Decompress
    single-threaded scalar    1367 |||||
    multi-threaded scalar     2034 ||||||||
  Lua
    single-threaded scalar    2402 |||||||||
    multi-threaded scalar     4653 ||||||||||||||||||

Floating Point
  Mandelbrot
    single-threaded scalar    1658 ||||||
    multi-threaded scalar     3057 ||||||||||||
  Dot Product
    single-threaded scalar    2733 ||||||||||
    multi-threaded scalar     5246 ||||||||||||||||||||
    single-threaded vector    3193 ||||||||||||
    multi-threaded vector     5998 |||||||||||||||||||||||
  LU Decomposition
    single-threaded scalar    2029 ||||||||
    multi-threaded scalar     2025 ||||||||
  Primality Test
    single-threaded scalar    2858 |||||||||||
    multi-threaded scalar     4305 |||||||||||||||||
  Sharpen Image
    single-threaded scalar    6282 |||||||||||||||||||||||||
    multi-threaded scalar    10207 ||||||||||||||||||||||||||||||||||||||||
  Blur Image
    single-threaded scalar    5080 ||||||||||||||||||||
    multi-threaded scalar     9474 |||||||||||||||||||||||||||||||||||||

Memory
  Read Sequential
    single-threaded scalar    4406 |||||||||||||||||
  Write Sequential
    single-threaded scalar    7728 ||||||||||||||||||||||||||||||
  Stdlib Allocate
    single-threaded scalar    2892 |||||||||||
  Stdlib Write
    single-threaded scalar    1968 |||||||
  Stdlib Copy
    single-threaded scalar    4208 ||||||||||||||||

Stream
  Stream Copy
    single-threaded scalar    4548 ||||||||||||||||||
    single-threaded vector    7240 ||||||||||||||||||||||||||||
  Stream Scale
    single-threaded scalar    5042 ||||||||||||||||||||
    single-threaded vector    7498 |||||||||||||||||||||||||||||
  Stream Add
    single-threaded scalar    5768 |||||||||||||||||||||||
    single-threaded vector    8543 ||||||||||||||||||||||||||||||||||
  Stream Triad
    single-threaded scalar    6283 |||||||||||||||||||||||||
    single-threaded vector    6711 ||||||||||||||||||||||||||

Integer Score:                2357 |||||||||
Floating Point Score:         4581 ||||||||||||||||||
Memory Score:                 4240 ||||||||||||||||
Stream Score:                 6454 |||||||||||||||||||||||||

Overall Geekbench Score:      3921 |||||||||||||||
Testing again and the results is almost the same:
System Information
  Platform:                  Linux x86 (32-bit)
  Compiler:                  GCC 4.1.2 20070925 (Red Hat 4.1.2-33)
  Operating System:          Linux 2.6.32-5-686-bigmem i686
  Model:                     Linux PC (Intel(R) Xeon(R) CPU E5-2620 0 @ 2.00GHz)
  Motherboard:               Unknown Motherboard
  Processor:                 Intel(R) Xeon(R) CPU E5-2620 0 @ 2.00GHz
  Processor ID:              GenuineIntel Family 6 Model 45 Stepping 7
  Logical Processors:        2
  Physical Processors:       1
  Processor Frequency:       2.00 GHz
  L1 Instruction Cache:      0.00 B
  L1 Data Cache:             0.00 B
  L2 Cache:                  256 KB
  L3 Cache:                  0.00 B
  Bus Frequency:             0.00 Hz
  Memory:                    501 MB
  Memory Type:               N/A
  SIMD:                      1
  BIOS:                      N/A
  Processor Model:                  Intel(R) Xeon(R) CPU E5-2620 0 @ 2.00GHz
  Processor Cores:           2

Integer
  Blowfish
    single-threaded scalar    1276 |||||
    multi-threaded scalar     2544 ||||||||||
  Text Compress
    single-threaded scalar    1652 ||||||
    multi-threaded scalar     3125 ||||||||||||
  Text Decompress
    single-threaded scalar    1822 |||||||
    multi-threaded scalar     3526 ||||||||||||||
  Image Compress
    single-threaded scalar    1464 |||||
    multi-threaded scalar     2342 |||||||||
  Image Decompress
    single-threaded scalar    1370 |||||
    multi-threaded scalar     2172 ||||||||
  Lua
    single-threaded scalar    2419 |||||||||
    multi-threaded scalar     4647 ||||||||||||||||||

Floating Point
  Mandelbrot
    single-threaded scalar    1659 ||||||
    multi-threaded scalar     3135 ||||||||||||
  Dot Product
    single-threaded scalar    2731 ||||||||||
    multi-threaded scalar     5257 |||||||||||||||||||||
    single-threaded vector    3196 ||||||||||||
    multi-threaded vector     6159 ||||||||||||||||||||||||
  LU Decomposition
    single-threaded scalar    2086 ||||||||
    multi-threaded scalar     2124 ||||||||
  Primality Test
    single-threaded scalar    2881 |||||||||||
    multi-threaded scalar     4514 ||||||||||||||||||
  Sharpen Image
    single-threaded scalar    6357 |||||||||||||||||||||||||
    multi-threaded scalar     9406 |||||||||||||||||||||||||||||||||||||
  Blur Image
    single-threaded scalar    5081 ||||||||||||||||||||
    multi-threaded scalar     9536 ||||||||||||||||||||||||||||||||||||||

Memory
  Read Sequential
    single-threaded scalar    4569 ||||||||||||||||||
  Write Sequential
    single-threaded scalar    7335 |||||||||||||||||||||||||||||
  Stdlib Allocate
    single-threaded scalar    2752 |||||||||||
  Stdlib Write
    single-threaded scalar    1787 |||||||
  Stdlib Copy
    single-threaded scalar    4226 ||||||||||||||||

Stream
  Stream Copy
    single-threaded scalar    4866 |||||||||||||||||||
    single-threaded vector    9314 |||||||||||||||||||||||||||||||||||||
  Stream Scale
    single-threaded scalar    5137 ||||||||||||||||||||
    single-threaded vector    6623 ||||||||||||||||||||||||||
  Stream Add
    single-threaded scalar    6089 ||||||||||||||||||||||||
    single-threaded vector    6806 |||||||||||||||||||||||||||
  Stream Triad
    single-threaded scalar    6632 ||||||||||||||||||||||||||
    single-threaded vector    6217 ||||||||||||||||||||||||

Integer Score:                2363 |||||||||
Floating Point Score:         4580 ||||||||||||||||||
Memory Score:                 4133 ||||||||||||||||
Stream Score:                 6460 |||||||||||||||||||||||||

Overall Geekbench Score:      3902 |||||||||||||||
I think the key strength of this VPS here is not how fast things are performing but rather how stable things are. As we can see, the network speed, disk I/O and even benchmarks are fairly stable, which means even though you won’t be expecting the fastest VPS that you can get at this price, you can be assured that the VPS itself is not going to show some crazy good and bad performance from time to time.
Customer Service and Support
Due to the stability of the VPS itself, I literally had to come up with questions for the sake of testing their support. In the end, my somewhat silly question that I sent in at 03:36am (Milan time?) was responded at 10:09am the next morning. It is definitely not bad considering that it is not something urgent and it was pretty much taken care of at the relatively early part of the next business day.
Conclusion
I was kind of curious how Prometeus managed to surprise us with the business plans, given the fact that their budget plan is already very stable. However, Uncle Sal has managed to impress us with the stability of the BizXen VPS. Granted the VPS is not the fastest we have seen and definitely did not come with jaw-dropping performance. However the VPS itself is very stable with consistent performance in disk I/O as well as network. As such, for those who are going after stability, the BizXen plan could definitely be a great choice. However, you might not be able to get the a reply within a few minutes if it is non-urgent in nature, but with the stable performance of the VPS, even I had a tough time to come up with questions to test their customer support.