
96MB Low End VPS Review Part 65–VPS Blast
Recently, there seems to be more and more providers offering either pure SSD-based VPS or SSD-cached + HDD based hybrid VPS. Although normally comes with very limited hard drive space, SSD-based VPS are promised to have amazing disk I/O speed and is suitable for I/O intensive applications such as databases. However, are those magical SSDs really as good as they have promised? Is the sacrifice in storage space really going to bring you the fast and stable disk I/O? Let’s take a look with VPSBlast.
Basic Information and Sign Up
As per their advertisement on WebhostingTalk, here is the resources you would be getting for 2.50USD per month:
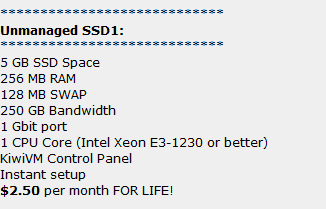
Note that this plan is not offered directly on their homepage and if you order directly on their homepage, the smallest plan is 512MB of RAM and 10GB of SSD space for 10 USD per month:

Slightly below the slider bar, they have a pretty good introduction about what they offer:

Provision was instant and I received my new VPS information email the minute when I received my Paypal payment confirmation.

Note that their VPS information email is a little different than other providers, partly because instead of using SolusVM, they actually use KiwiVM control panel, which is a properitoty panel that they have developed in-house from scratch as per the comment made by Dan. I always give providers some extra points for developing their own control panels, since it shows the providers actually knows what they are doing and also indicates a certain level of commitment they have for the business since normally the R&D cost for control panels is quite high.
Once logged into their billing panel and click on Manage Server, you would be able to see a link that will lead you to the KiwiVM control panel:
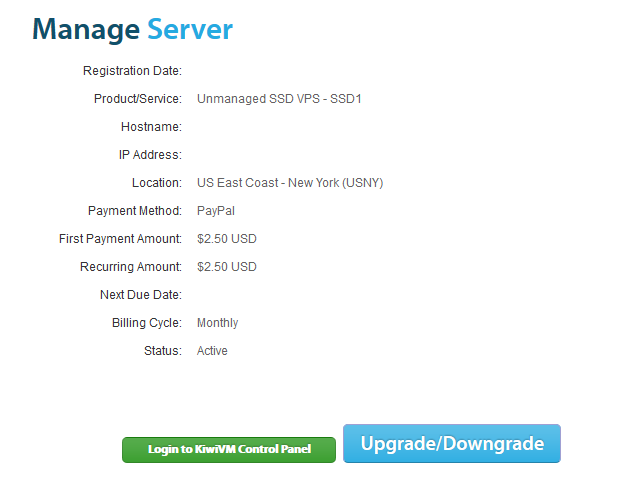
You can also go to the Kiwi panel login page, which will ask you to login using your server’s IP address and password. Note that because of IP address is used as the user name rather than the actual user account, you will have to login separately for each VPS, instead of having every server under your name/email to be on one page. Furthermore, I am not sure what would be the password used to log into the server as it was never displayed anywhere, so I would assume the best way to login is just through the billing interface.
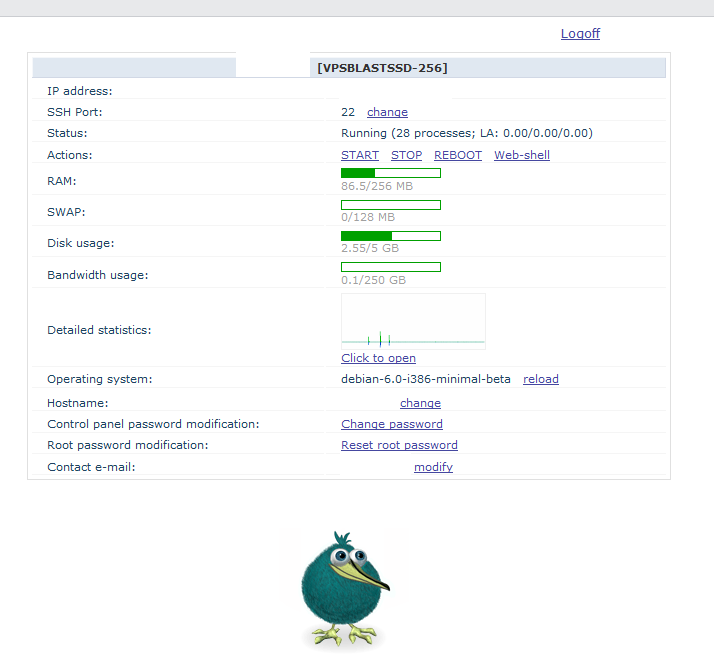
The main control panel for KiwiVM is actually very simplistic and clean, with everything on a single page, which is something I really like:
You can change the SSH port if necessary:
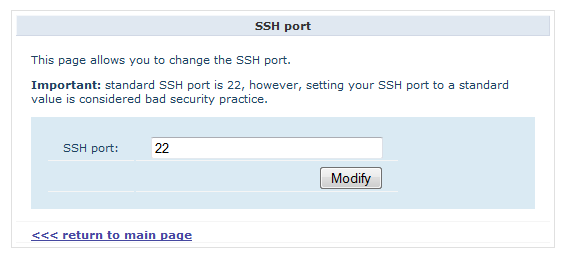
Note that if you have changed your SSH port within the VPS, the record won’t be updated in the control panel.
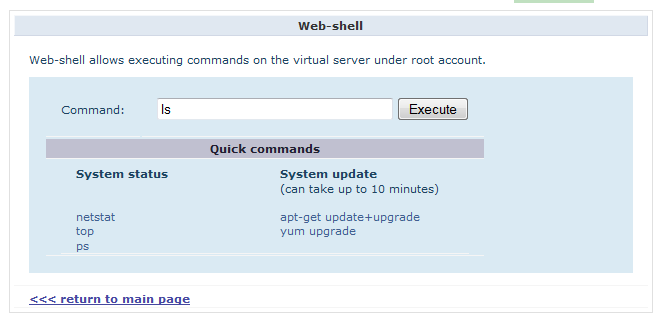
Basic actions can be performed on the control panel, including start, stop, reboot and it has a web console as well. However, the web console is a little different from the console in SolsuVM, which is essentially a Java-based SSH client. Instead, the web-shell in KiwiVM is a web-based page that allows you to run a single command at a time.
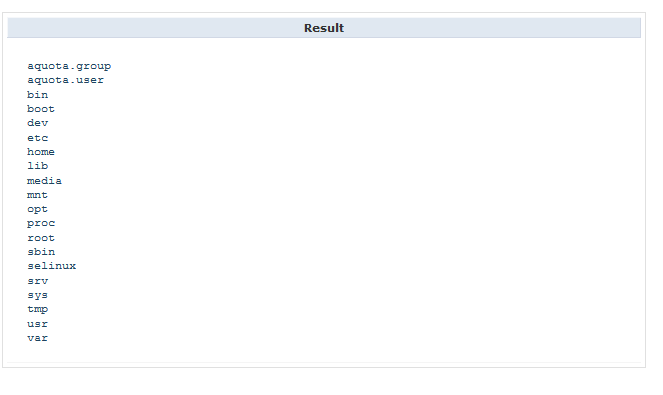
Once the command is run, you can see the output below:
You can click on the detailed statistics to see the detailed usage of your VPS resources:
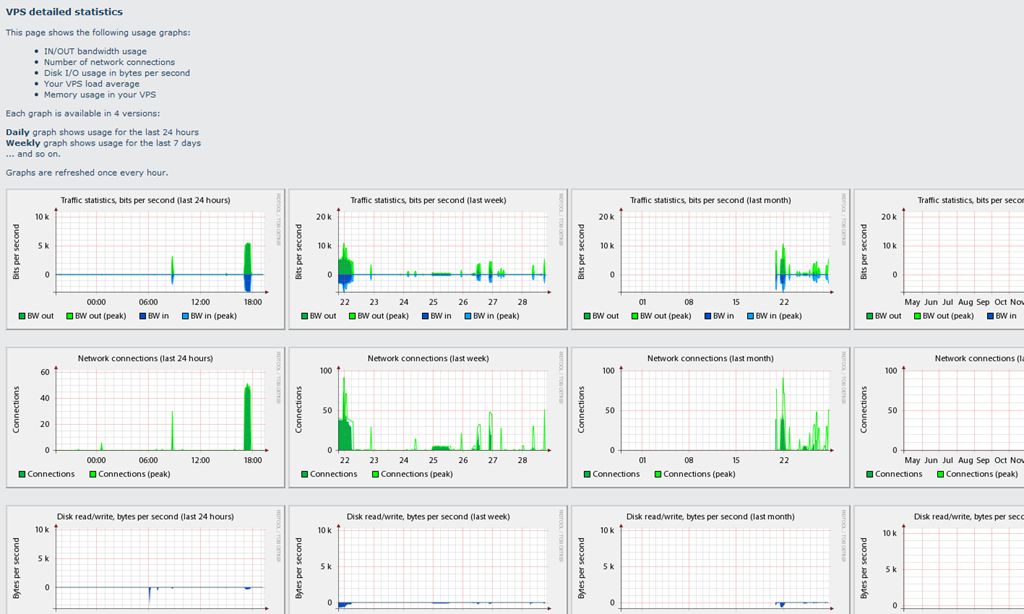
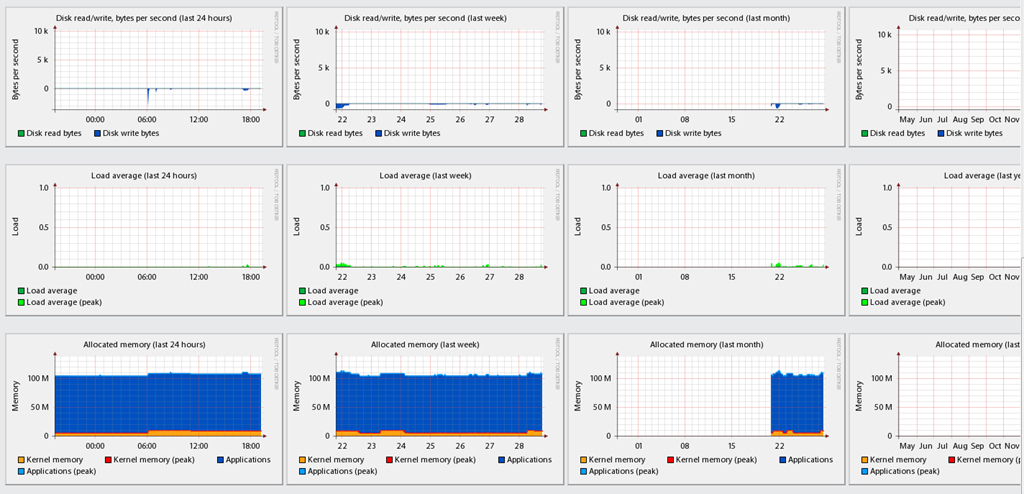
As you can see, the number of graphs is almost overwhelming, and I am not sure if it would be necessary to have this much information available.
There is a pretty comprehensive list of operating systems available for reinstall:
arch-2010.05-i686-minimal
arch-2010.05-x86_64-minimal
arch-2012-11-19-x86_64-minimal-caner-version
centos-4-i386-minimal
centos-4-x86
centos-4-x86_64-minimal
centos-4-x86_64
centos-5-x86
centos-5-x86_64
centos-6-x86
centos-6-x86_64
debian-3.1-x86
debian-4.0-x86
debian-4.0-x86_64
debian-5.0-x86
debian-5.0-x86_64
debian-6-turnkey-nginx-php-fastcgi_12.0-1_i386
debian-6.0-i386-minimal-beta
debian-6.0-x86
debian-6.0-x86_64
fedora-10-x86
fedora-10-x86_64
fedora-11-x86
fedora-11-x86_64
fedora-12-x86
fedora-12-x86_64
fedora-13-x86
fedora-13-x86_64
fedora-14-x86
fedora-14-x86_64
fedora-15-x86
fedora-15-x86_64
gentoo-openvz-x86-2008.11.30
opensuse-11.0-i586-20081217
owl-3.0-release-i686
owl-3.0-release-x86_64
owl-current-20100323-i686
owl-current-20100323-x86_64
scientific-6-x86
scientific-6-x86_64
slackware-13.1-i386-minimal
suse-11.2-x86
suse-11.2-x86_64
suse-11.3-x86
suse-11.3-x86_64
suse-11.4-x86
suse-11.4-x86_64
ubuntu-10.04-x86
ubuntu-10.04-x86_64
ubuntu-10.10-x86
ubuntu-10.10-x86_64
ubuntu-11.04-x86
ubuntu-11.04-x86_64
ubuntu-11.10-x86
ubuntu-11.10-x86_64
ubuntu-12.04-x86
ubuntu-12.04-x86_64
ubuntu-8.04-x86
ubuntu-8.04-x86_64
ubuntu-8.10-x86
ubuntu-8.10-x86_64
ubuntu-9.04-x86
ubuntu-9.04-x86_64
ubuntu-9.10-x86
ubuntu-9.10-x86_64
In fact, there are altogether 65 templates that covers almost all of the latest versions of major Linux distributions, there are also minimal and turnkey templates which might be useful as well.
And finally, host name, root password, control panel password and contact email can all be changed from the interface:




Test on the VPS
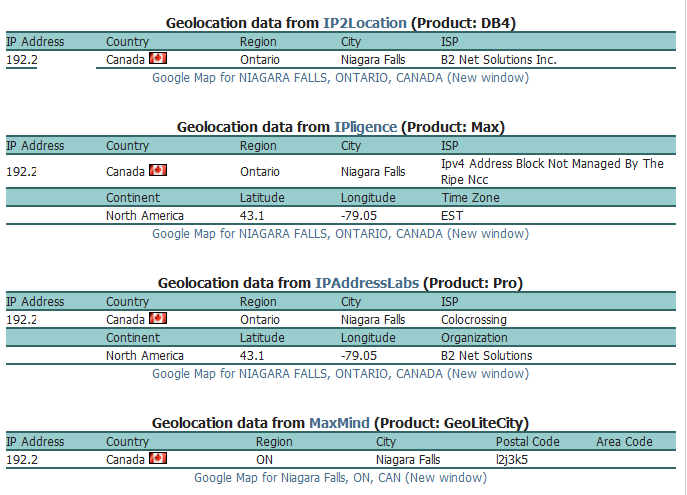
As mentioned above, the VPS has 256MB of RAM, 5GB of SSD-based hard drive space, and 250GB of bandwidth on 1Gbit port (which seems a little low). The VPS is located in ColoCrossing datacenter in Buffalo, New York, although interestingly, the IP was geo-located to Niagara Falls, Canada, which could be useful for people who are in need of a Canadian IP address. I have installed Debian 6 minimal 32 bit for testing purposes.
When the OS was first loaded, 6MB of RAM was used, which indicates the OS template was optimized for smaller RAM usage:
free -m
             total       used       free     shared    buffers     cached
Mem:           256         14        241          0          0          8
-/+ buffers/cache:          6        249
Swap:          128          0        127
Top output showing the processes running:
top - 01:50:50 up 51 days,  6:42,  1 user,  load average: 0.00, 0.00, 0.00
Tasks:  18 total,   1 running,  17 sleeping,   0 stopped,   0 zombie
Cpu(s):  0.0%us,  0.0%sy,  0.0%ni,100.0%id,  0.0%wa,  0.0%hi,  0.0%si,  0.0%st
Mem:    262144k total,    15260k used,   246884k free,        0k buffers
Swap:   131072k total,      612k used,   130460k free,     8448k cached

  PID USER      PR  NI  VIRT  RES  SHR S %CPU %MEM    TIME+  COMMAND
12635 root      20   0  8464 2944 2324 S    0  1.1   0:00.11 sshd
12638 root      20   0  2976 1632 1300 S    0  0.6   0:00.01 bash
12647 root      20   0  2328 1068  876 R    0  0.4   0:00.00 top
  314 root      20   0 34464  716  472 S    0  0.3   0:14.43 rsyslogd
  377 root      20   0  5488  316  212 S    0  0.1   0:12.94 sshd
  370 root      20   0  2288  164  112 S    0  0.1   0:03.17 cron
    1 root      20   0  2028   84   52 S    0  0.0   0:32.62 init
    2 root      20   0     0    0    0 S    0  0.0   0:00.00 kthreadd/1285
    3 root      20   0     0    0    0 S    0  0.0   0:00.00 khelper/1285
    4 root      20   0     0    0    0 S    0  0.0   0:00.00 rpciod/1285/0
    5 root      20   0     0    0    0 S    0  0.0   0:00.00 rpciod/1285/1
    6 root      20   0     0    0    0 S    0  0.0   0:00.00 rpciod/1285/2
    7 root      20   0     0    0    0 S    0  0.0   0:00.00 rpciod/1285/3
    8 root      20   0     0    0    0 S    0  0.0   0:00.00 rpciod/1285/4
    9 root      20   0     0    0    0 S    0  0.0   0:00.00 rpciod/1285/5
   10 root      20   0     0    0    0 S    0  0.0   0:00.00 rpciod/1285/6
   11 root      20   0     0    0    0 S    0  0.0   0:00.00 rpciod/1285/7
Htop output:
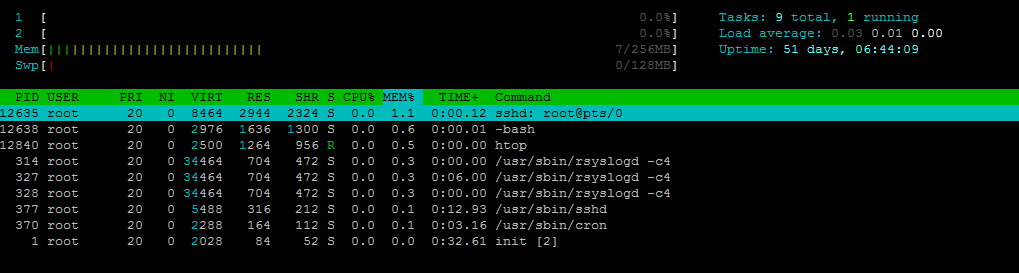
About 170MB of hard drive space was used:
 df -h
Filesystem            Size  Used Avail Use% Mounted on
/dev/simfs            5.0G  170M  4.9G   4% /
tmpfs                 128M     0  128M   0% /lib/init/rw
tmpfs                 128M     0  128M   0% /dev/shm
And the inodes usage is pretty standard:
 df -i
Filesystem            Inodes   IUsed   IFree IUse% Mounted on
/dev/simfs           5120000   10544 5109456    1% /
tmpfs                  32768       4   32764    1% /lib/init/rw
tmpfs                  32768       1   32767    1% /dev/shm
When the full LNMP stack was loaded, RAM usage goes up to 22MB, which is still significantly lower than what normally would be:
 free -m
             total       used       free     shared    buffers     cached
Mem:           256        252          3          0          0        229
-/+ buffers/cache:         22        233
Swap:          128          7        120
Top showing the processes running:
top - 10:16:05 up 51 days,  7:08,  1 user,  load average: 0.34, 0.78, 0.58
Tasks:  28 total,   1 running,  27 sleeping,   0 stopped,   0 zombie
Cpu(s):  0.0%us,  0.0%sy,  0.0%ni,100.0%id,  0.0%wa,  0.0%hi,  0.0%si,  0.0%st
Mem:    262144k total,   258824k used,     3320k free,        0k buffers
Swap:   131072k total,     7572k used,   123500k free,   235328k cached

  PID USER      PR  NI  VIRT  RES  SHR S %CPU %MEM    TIME+  COMMAND
19432 www       20   0 14996  10m  416 S    0  4.2   0:00.01 nginx
19413 mysql     20   0 33948 2024 2020 S    0  0.8   0:00.00 mysqld
19423 root      20   0 22624 1624 1404 S    0  0.6   0:00.00 php-cgi
19426 www       20   0 22624 1444  992 S    0  0.6   0:00.00 php-cgi
19427 www       20   0 22624 1444  992 S    0  0.6   0:00.00 php-cgi
19428 www       20   0 22624 1440  992 S    0  0.5   0:00.00 php-cgi
19425 www       20   0 22624 1388  992 S    0  0.5   0:00.00 php-cgi
19424 www       20   0 22624 1356  992 S    0  0.5   0:00.00 php-cgi
19457 root      20   0  2328 1092  884 R    0  0.4   0:00.00 top
12638 root      20   0  2976 1008  848 S    0  0.4   0:00.01 bash
19431 root      20   0  4784  724  276 S    0  0.3   0:00.00 nginx
  314 root      20   0 34464  540  436 S    0  0.2   0:14.44 rsyslogd
12635 root      20   0  8464  524  408 S    0  0.2   0:01.32 sshd
19311 root      20   0  1744  460  456 S    0  0.2   0:00.00 mysqld_safe
  370 root      20   0  2288  156  108 S    0  0.1   0:03.17 cron
  377 root      20   0  5488  144  140 S    0  0.1   0:12.94 sshd
    1 root      20   0  2028   96   76 S    0  0.0   0:32.63 init
    2 root      20   0     0    0    0 S    0  0.0   0:00.00 kthreadd/1285
    3 root      20   0     0    0    0 S    0  0.0   0:00.00 khelper/1285
    4 root      20   0     0    0    0 S    0  0.0   0:00.00 rpciod/1285/0
    5 root      20   0     0    0    0 S    0  0.0   0:00.00 rpciod/1285/1
    6 root      20   0     0    0    0 S    0  0.0   0:00.00 rpciod/1285/2
    7 root      20   0     0    0    0 S    0  0.0   0:00.00 rpciod/1285/3
    8 root      20   0     0    0    0 S    0  0.0   0:00.00 rpciod/1285/4
    9 root      20   0     0    0    0 S    0  0.0   0:00.00 rpciod/1285/5
   10 root      20   0     0    0    0 S    0  0.0   0:00.00 rpciod/1285/6
   11 root      20   0     0    0    0 S    0  0.0   0:00.00 rpciod/1285/7
   12 root      20   0     0    0    0 S    0  0.0   0:00.00 nfsiod/1285
Htop output:
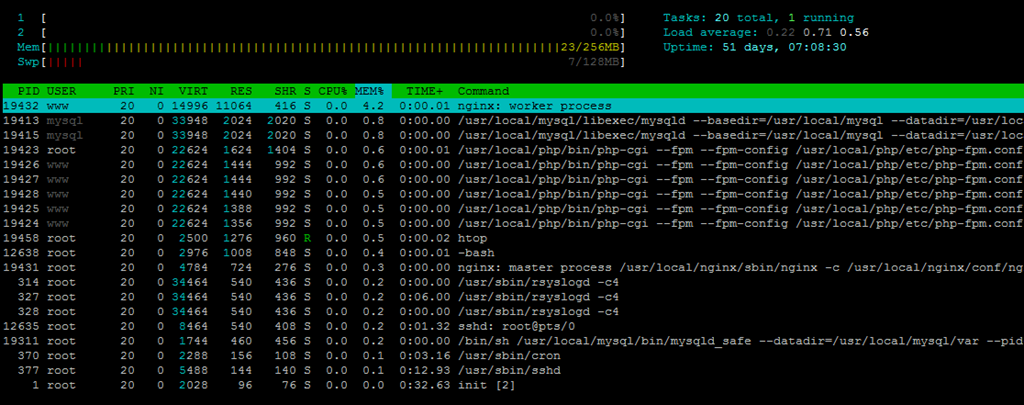
About 1.6GB of hard drive space was used:
 df -h
Filesystem            Size  Used Avail Use% Mounted on
/dev/simfs            5.0G  1.6G  3.5G  31% /
tmpfs                 128M     0  128M   0% /lib/init/rw
tmpfs                 128M     0  128M   0% /dev/shm
And inodes is again, pretty standard:
df -i
Filesystem            Inodes   IUsed   IFree IUse% Mounted on
/dev/simfs           5120000   63484 5056516    2% /
tmpfs                  32768       4   32764    1% /lib/init/rw
tmpfs                  32768       1   32767    1% /dev/shm
Uptime output shows the VPS is fairly stable:
 uptime
 10:03:28 up 72 days,  2:11,  1 user,  load average: 0.00, 0.00, 0.00
VMstat shows there is no iowait:
 vmstat
procs -----------memory---------- ---swap-- -----io---- -system-- ----cpu----
 r  b   swpd   free   buff  cache   si   so    bi    bo   in   cs us sy id wa
 0  0  39840 242324      0   7720    0    0     1     0    0    3  0  0 100  0
CPUInfo shows there are two CPU cores assigned to this VPS, and the processor they used is E3-1270v2, which is a relatively new processor:
cat /proc/cpuinfo
processor       : 0
vendor_id       : GenuineIntel
cpu family      : 6
model           : 58
model name      : Intel(R) Xeon(R) CPU E3-1270 V2 @ 3.50GHz
stepping        : 9
cpu MHz         : 1750.500
cache size      : 8192 KB
physical id     : 0
siblings        : 8
core id         : 0
cpu cores       : 4
apicid          : 0
initial apicid  : 0
fpu             : yes
fpu_exception   : yes
cpuid level     : 13
wp              : yes
flags           : fpu vme de pse tsc msr pae mce cx8 apic sep mtrr pge mca cmov pat pse36 clflush dts acpi mmx fxsr sse sse2 ss ht tm pbe syscall nx rdtscp lm constant_tsc arch_perfmon pebs bts rep_good xtopology nonstop_tsc aperfmperf pni pclmulqdq dtes64 monitor ds_cpl vmx smx est tm2 ssse3 cx16 xtpr pdcm sse4_1 sse4_2 x2apic popcnt aes xsave avx f16c rdrand lahf_lm ida arat epb xsaveopt pln pts dts tpr_shadow vnmi flexpriority ept vpid fsgsbase smep erms
bogomips        : 6999.84
clflush size    : 64
cache_alignment : 64
address sizes   : 36 bits physical, 48 bits virtual
power management:

processor       : 1
vendor_id       : GenuineIntel
cpu family      : 6
model           : 58
model name      : Intel(R) Xeon(R) CPU E3-1270 V2 @ 3.50GHz
stepping        : 9
cpu MHz         : 800.000
cache size      : 8192 KB
physical id     : 0
siblings        : 8
core id         : 1
cpu cores       : 4
apicid          : 2
initial apicid  : 2
fpu             : yes
fpu_exception   : yes
cpuid level     : 13
wp              : yes
flags           : fpu vme de pse tsc msr pae mce cx8 apic sep mtrr pge mca cmov pat pse36 clflush dts acpi mmx fxsr sse sse2 ss ht tm pbe syscall nx rdtscp lm constant_tsc arch_perfmon pebs bts rep_good xtopology nonstop_tsc aperfmperf pni pclmulqdq dtes64 monitor ds_cpl vmx smx est tm2 ssse3 cx16 xtpr pdcm sse4_1 sse4_2 x2apic popcnt aes xsave avx f16c rdrand lahf_lm ida arat epb xsaveopt pln pts dts tpr_shadow vnmi flexpriority ept vpid fsgsbase smep erms
bogomips        : 6999.84
clflush size    : 64
cache_alignment : 64
address sizes   : 36 bits physical, 48 bits virtual
power management:
Meminfo shows nothing too interesting:
cat /proc/meminfo
MemTotal:         262144 kB
MemFree:             628 kB
Cached:           255712 kB
Active:            93884 kB
Inactive:         162236 kB
Active(anon):        132 kB
Inactive(anon):      276 kB
Active(file):      93752 kB
Inactive(file):   161960 kB
Unevictable:           0 kB
Mlocked:               0 kB
SwapTotal:        131072 kB
SwapFree:         107188 kB
Dirty:             72220 kB
Writeback:             0 kB
AnonPages:           408 kB
Shmem:              5128 kB
Slab:               5384 kB
SReclaimable:       2884 kB
SUnreclaim:         2500 kB
Beancounters, as with the most recent versions of OpenVZ kernels, seem to show some relatively large values:
cat /proc/user_beancounters
Version: 2.5
       uid  resource                     held              maxheld              barrier                limit              failcnt
     1285:  kmemsize                  5532169             14413824            112721920            123994112                    0
            lockedpages                     0                    0                27520                27520                    0
            privvmpages                 26066                74977  9223372036854775807  9223372036854775807                    0
            shmpages                     1282                 1938                16384                16384                    0
            dummy                           0                    0                    0                    0                    0
            numproc                        33                  105                  200                  200                    0
            physpages                   64910                65537                    0                65536                    0
            vmguarpages                     0                    0                65536  9223372036854775807                    0
            oomguarpages                 6073                 6819                65536  9223372036854775807                    0
            numtcpsock                      6                   88                 1670                 1670                    0
            numflock                        1                    3                  512                  563                    0
            numpty                          1                    8                   32                   32                    0
            numsiginfo                      0                   27                  256                  256                    0
            tcpsndbuf                  124392              1077184              8550400             12825600                    0
            tcprcvbuf                   98304              8981000              8550400             12825600               178097
            othersockbuf                 6936                28224              4275200              8550400                    0
            dgramrcvbuf                     0                 4624               427520               427520                    0
            numothersock                   36                   43                 1670                 1670                    0
            dcachesize                2970375              7864320              7149382              7864320                    0
            numfile                       313                  525                10240                10240                    0
            dummy                           0                    0                    0                    0                    0
            dummy                           0                    0                    0                    0                    0
            dummy                           0                    0                    0                    0                    0
            numiptent                      24                   24                  384                  384                    0
Note that the failcnt for tcprcvbuf is not 0, which is uncommon since most of the time fail count should be 0 for all items.
As a result, the output of VZFree is also showing some weird numbers:
vzfree
             Total     Used     Free
Kernel:    107.50M    5.28M  102.22M
Allocate: 36028797018963968.00M  101.82M 36028797018963868.00M (256M Guaranteed)
Commit:    256.00M   29.00M  227.00M (23.3% of Allocated)
Swap:              -229.75M          (-968.5% of Committed)
Time sync results:
time sync

real    0m0.002s
user    0m0.000s
sys     0m0.001s
For the SSD-based VPS, the most interesting part is the disk I/O and VPSBlast was showing some inconsistent but pretty good results:
 dd if=/dev/zero of=test bs=64k count=16k conv=fdatasync
16384+0 records in
16384+0 records out
1073741824 bytes (1.1 GB) copied, 10.9609 s, 98.0 MB/s
As you can see, this is not a lot better than a regular RAID 10 hard drive configuration.
And when I ran the I/O test again a while later, here is what I see:
 dd if=/dev/zero of=test bs=64k count=16k conv=fdatasync
16384+0 records in
16384+0 records out
1073741824 bytes (1.1 GB) copied, 4.24318 s, 253 MB/s
This is closer to what the disk I/O of a SSD configuration would offer.
IOPing results are pretty inconsistent as well:
ioping -c 10 .
4096 bytes from . (simfs /vz/private/1285): request=1 time=0.0 ms
4096 bytes from . (simfs /vz/private/1285): request=2 time=0.6 ms
4096 bytes from . (simfs /vz/private/1285): request=3 time=0.5 ms
4096 bytes from . (simfs /vz/private/1285): request=4 time=0.6 ms
4096 bytes from . (simfs /vz/private/1285): request=5 time=0.1 ms
4096 bytes from . (simfs /vz/private/1285): request=6 time=0.6 ms
4096 bytes from . (simfs /vz/private/1285): request=7 time=0.6 ms
4096 bytes from . (simfs /vz/private/1285): request=8 time=0.6 ms
4096 bytes from . (simfs /vz/private/1285): request=9 time=0.5 ms
4096 bytes from . (simfs /vz/private/1285): request=10 time=0.5 ms

--- . (simfs /vz/private/1285) ioping statistics ---
10 requests completed in 9009.1 ms, 2181 iops, 8.5 mb/s
min/avg/max/mdev = 0.0/0.5/0.6/0.2 ms
Normally for SSD I would expect the ioping to be around 0.1ms range, but the second time I ran it, the results are even less consistent:
ioping -c 10 .
4096 bytes from . (simfs /vz/private/1285): request=1 time=0.0 ms
4096 bytes from . (simfs /vz/private/1285): request=2 time=14.1 ms
4096 bytes from . (simfs /vz/private/1285): request=3 time=0.5 ms
4096 bytes from . (simfs /vz/private/1285): request=4 time=1.1 ms
4096 bytes from . (simfs /vz/private/1285): request=5 time=0.6 ms
4096 bytes from . (simfs /vz/private/1285): request=6 time=0.2 ms
4096 bytes from . (simfs /vz/private/1285): request=7 time=11.6 ms
4096 bytes from . (simfs /vz/private/1285): request=8 time=0.6 ms
4096 bytes from . (simfs /vz/private/1285): request=9 time=15.2 ms
4096 bytes from . (simfs /vz/private/1285): request=10 time=0.6 ms

--- . (simfs /vz/private/1285) ioping statistics ---
10 requests completed in 9047.6 ms, 225 iops, 0.9 mb/s
min/avg/max/mdev = 0.0/4.5/15.2/6.1 ms
As you can see, this results is not even as good as some of the HDD-based configurations.
The network on the other hand, is a lot more impressive. The server was on 1Gbit port, so when I tried to download the Cachefly test file, it was completed really quickly.
 wget cachefly.cachefly.net/100mb.test -O /dev/null
--2012-12-11 11:44:12--  http://cachefly.cachefly.net/100mb.test
Resolving cachefly.cachefly.net... 205.234.175.175
Connecting to cachefly.cachefly.net|205.234.175.175|:80... connected.
HTTP request sent, awaiting response... 200 OK
Length: 104857600 (100M) [application/octet-stream]
Saving to: `/dev/null'

100%[==========================================================================================>] 104,857,600 24.5M/s   in 4.2s

2012-12-11 11:44:16 (23.9 MB/s) - `/dev/null' saved [104857600/104857600]
The testing for second time was showing even better results:
 wget cachefly.cachefly.net/100mb.test -O /dev/null
--2013-04-30 08:05:30--  http://cachefly.cachefly.net/100mb.test
Resolving cachefly.cachefly.net... 205.234.175.175
Connecting to cachefly.cachefly.net|205.234.175.175|:80... connected.
HTTP request sent, awaiting response... 200 OK
Length: 104857600 (100M) [application/octet-stream]
Saving to: `/dev/null'

100%[======================================>] 104,857,600 40.6M/s   in 2.5s

2013-04-30 08:05:33 (40.6 MB/s) - `/dev/null' saved [104857600/104857600]
For the 1Gbit port, I have normally use aget to test the multi-threaded download of a 1GB file, and this time it is no exception.
The first test was done on the ThinkBroadBand 1GB test file:
aget -n 10 http://ipv4.download.thinkbroadband.com/1GB.zipAttempting to read log file aget-1GB.zip.log for resuming download job... Couldn't find log file for this download, starting a clean job... Head-Request Connection established Downloading /1GB.zip (1073741824 bytes) from site ipv4.download.thinkbroadband.com(80.249.99.148:80). Number of Threads: 10 .. [4% completed] ..... [9% completed] ....... [14% completed] .......... [19% completed] ............ [24% completed] ............... [29% completed] ................. [34% completed] .................... [39% completed] ...................... [44% completed] ......................... [49% completed] ........................... [54% completed] .............................. [59% completed] ................................ [64% completed] ................................... [69% completed] ..................................... [74% completed] ........................................ [79% completed] .......................................... [84% completed] ............................................. [89% completed] ............................................... [94% completed] ............................................... [94% completed] .................................................. [99% completed] .................................................. [100% completed] Download completed, job completed in 89 seconds. (11781 Kb/sec) Shutting down...
Testing again:
aget -n 10 http://ipv4.download.thinkbroadband.com/1GB.zipAttempting to read log file aget-1GB.zip.log for resuming download job... Couldn't find log file for this download, starting a clean job... Head-Request Connection established Downloading /1GB.zip (1073741824 bytes) from site ipv4.download.thinkbroadband.com(80.249.99.148:80). Number of Threads: 10 .. [4% completed] ..... [9% completed] ....... [14% completed] .......... .......... .......... .......... [19% completed] [19% completed] [19% completed] [19% completed] ............ [24% completed] ............... [29% completed] ................. ................. [34% completed] [34% completed] .................... [39% completed] ...................... ...................... [44% completed] [44% completed] ......................... [49% completed] ........................... [54% completed] .............................. [59% completed] ................................ ................................ [64% completed] [64% completed] ................................... ................................... [69% completed] [69% completed] ..................................... [74% completed] ........................................ [79% completed] .......................................... [84% completed] ............................................. [89% completed] ............................................... [94% completed] .................................................. [99% completed] .................................................. [100% completed] Download completed, job completed in 89 seconds. (11781 Kb/sec) Shutting down...
Indeed the speed does not exactly show the speed of a 1Gbit port, however it is very consistent and it is almost known that ThinkBroadband itself, which is based in London, UK, is not very fast to start with.
The other test file that I have used is a 1GB test file from DimeNOC/HostDime, and the test file is located in Orlando, FL.
aget -n 10 http://72.29.70.131/1gbfile.tgzAttempting to read log file aget-1gbfile.tgz.log for resuming download job... Couldn't find log file for this download, starting a clean job... Head-Request Connection established Downloading /1gbfile.tgz (1023410176 bytes) from site 72.29.70.131(72.29.70.131:80). Number of Threads: 10 .. [4% completed] ..... [9% completed] ....... ....... [14% completed] [14% completed] .......... [19% completed] ............ [24% completed] ............... [29% completed] ................. ................. [34% completed] [34% completed] .................... [39% completed] ...................... [44% completed] ......................... [49% completed] ............................ .......................... [54% completed] [54% completed] .............................. [59% completed] ................................. ............................... [64% completed] [64% completed] ................................... [69% completed] ..................................... ..................................... [74% completed] [74% completed] ........................................ [79% completed] .......................................... .......................................... [84% completed] [84% completed] ............................................. [89% completed] ............................................... [94% completed] .................................................. [99% completed] .................................................. [100% completed] Download completed, job completed in 26 seconds. (38439 Kb/sec) Shutting down...
As you can see, the speed is now a lot better.
Testing again:
aget -n 10 http://72.29.70.131/1gbfile.tgzAttempting to read log file aget-1gbfile.tgz.log for resuming download job... Couldn't find log file for this download, starting a clean job... Head-Request Connection established Downloading /1gbfile.tgz (1023410176 bytes) from site 72.29.70.131(72.29.70.131:80). Number of Threads: 10 .. .. [4% completed] [4% completed] ..... [9% completed] ....... [14% completed] .......... [19% completed] ............ [24% completed] ............... [29% completed] ................. [34% completed] .................... ..................... ................... [39% completed] [39% completed] [39% completed] ...................... [44% completed] ......................... ......................... [49% completed] [49% completed] ........................... [54% completed] .............................. [59% completed] ................................ ................................ ................................ [64% completed] [64% completed] [64% completed] .................................... .................................. [69% completed] [69% completed] ..................................... [74% completed] ......................................... ....................................... [79% completed] [79% completed] .......................................... .......................................... [84% completed] [84% completed] ............................................. ............................................. [89% completed] [89% completed] ............................................... [94% completed] .................................................. [99% completed] .................................................. [100% completed] Download completed, job completed in 27 seconds. (37015 Kb/sec) Shutting down...
Again, as both servers are along the east coast, the download speed is much better.
For the upload speed tests, the first is on my Quickweb test VPS at Chicago, IL, which is on the east coast:
 wget http://192.227.xxx.xxx/100mb.test -O /dev/null
--2013-04-30 00:53:39--  http://192.227.xxx.xxx/100mb.test
Connecting to 192.227.xxx.xxx:80... connected.
HTTP request sent, awaiting response... 200 OK
Length: 104857600 (100M) [application/octet-stream]
Saving to: `/dev/null'

100%[======================================>] 104,857,600 4.39M/s   in 23s

2013-04-30 00:54:02 (4.33 MB/s) - `/dev/null' saved [104857600/104857600]
From my ChicagoVPS in Los Angeles, CA, which is on the west coast:
wget http://192.227.xxx.xxx/100mb.test -O /dev/null
--2013-04-30 08:48:33--  http://192.227.xxx.xxx/100mb.test
Connecting to 192.227.xxx.xxx:80... connected.
HTTP request sent, awaiting response... 200 OK
Length: 104857600 (100M) [application/octet-stream]
Saving to: `/dev/null'

100%[======================================>] 104,857,600  799K/s   in 2m 13s

2013-04-30 08:50:47 (768 KB/s) - `/dev/null' saved [104857600/104857600]
Finally, the VPS from Prometeus from Milan, Italy, which is in Europe:
 wget http://192.227.xxx.xxx/100mb.test -O /dev/null
--2013-04-29 20:56:07--  http://192.227.xxx.xxx/100mb.test
Connecting to 192.227.xxx.xxx:80... connected.
HTTP request sent, awaiting response... 200 OK
Length: 104857600 (100M) [application/octet-stream]
Saving to: `/dev/null'

100%[======================================>] 104,857,600 11.3M/s   in 12s

2013-04-29 20:56:20 (8.33 MB/s) - `/dev/null' saved [104857600/104857600]
As you can see, the VPS seems to have the best download speed with a European VPS, which is not exactly the closest spot physically. However, doing a traceroute indicated to me that the particularly routing was highly optimized:
 6  nyk-bb1-link.telia.net (80.91.253.122)  88.592 ms nyk-bb1-link.telia.net (213.155.135.5)  88.647 ms nyk-bb1-link.telia.net (80.91.251.96)  88.772 ms
 7  buf-b1-link.telia.net (80.91.246.36)  98.020 ms  97.731 ms  98.157 ms
 8  giglinx-ic-155660-buf-b1.c.telia.net (213.248.96.42)  112.883 ms  113.366 ms  112.527 ms
 9  host.colocrossing.com (198.23.xxx.xxx)  105.883 ms  107.056 ms  106.560 ms
10  v29.xxx.xxx (198.245.xxx.xxx)  105.027 ms  105.241 ms  105.230 ms
11  192.227.xxx.xxx (192.227.xxx.xxx)  98.174 ms  98.049 ms  98.164 ms
Finally, benchmarks. With a SSD storage and two CPU cores I was hoping for some impressive Unixbench score, however the first time I ran through UnixBench test, this did not exactly happen:
  #    #  #    #  #  #    #          #####   ######  #    #   ####   #    #
   #    #  ##   #  #   #  #           #    #  #       ##   #  #    #  #    #
   #    #  # #  #  #    ##            #####   #####   # #  #  #       ######
   #    #  #  # #  #    ##            #    #  #       #  # #  #       #    #
   #    #  #   ##  #   #  #           #    #  #       #   ##  #    #  #    #
    ####   #    #  #  #    #          #####   ######  #    #   ####   #    #

   Version 5.1.3                      Based on the Byte Magazine Unix Benchmark

   Multi-CPU version                  Version 5 revisions by Ian Smith,
                                      Sunnyvale, CA, USA
   January 13, 2011                   johantheghost at yahoo period com


1 x Dhrystone 2 using register variables  1 2 3 4 5 6 7 8 9 10

1 x Double-Precision Whetstone  1 2 3 4 5 6 7 8 9 10

1 x Execl Throughput  1 2 3

1 x File Copy 1024 bufsize 2000 maxblocks  1 2 3

1 x File Copy 256 bufsize 500 maxblocks  1 2 3

1 x File Copy 4096 bufsize 8000 maxblocks  1 2 3

1 x Pipe Throughput  1 2 3 4 5 6 7 8 9 10

1 x Pipe-based Context Switching  1 2 3 4 5 6 7 8 9 10

1 x Process Creation  1 2 3

1 x System Call Overhead  1 2 3 4 5 6 7 8 9 10

1 x Shell Scripts (1 concurrent)  1 2 3

1 x Shell Scripts (8 concurrent)  1 2 3

2 x Dhrystone 2 using register variables  1 2 3 4 5 6 7 8 9 10

2 x Double-Precision Whetstone  1 2 3 4 5 6 7 8 9 10

2 x Execl Throughput  1 2 3

2 x File Copy 1024 bufsize 2000 maxblocks  1 2 3

2 x File Copy 256 bufsize 500 maxblocks  1 2 3

2 x File Copy 4096 bufsize 8000 maxblocks  1 2 3

2 x Pipe Throughput  1 2 3 4 5 6 7 8 9 10

2 x Pipe-based Context Switching  1 2 3 4 5 6 7 8 9 10

2 x Process Creation  1 2 3

2 x System Call Overhead  1 2 3 4 5 6 7 8 9 10

2 x Shell Scripts (1 concurrent)  1 2 3

2 x Shell Scripts (8 concurrent)  1 2 3

========================================================================
   BYTE UNIX Benchmarks (Version 5.1.3)

   System: xxxxxx: GNU/Linux
   OS: GNU/Linux -- 2.6.32-042stab062.2 -- #1 SMP Wed Oct 10 18:28:35 MSK 2012
   Machine: i686 (unknown)
   Language: en_US.utf8 (charmap="UTF-8", collate="UTF-8")
   CPU 0: Intel(R) Xeon(R) CPU E31230 @ 3.20GHz (6385.7 bogomips)
          Hyper-Threading, x86-64, MMX, Physical Address Ext, SYSENTER/SYSEXIT, SYSCALL/SYSRET, Intel virtualization
   CPU 1: Intel(R) Xeon(R) CPU E31230 @ 3.20GHz (6385.7 bogomips)
          Hyper-Threading, x86-64, MMX, Physical Address Ext, SYSENTER/SYSEXIT, SYSCALL/SYSRET, Intel virtualization
   10:24:54 up 51 days,  7:16,  1 user,  load average: 0.00, 0.12, 0.31; runlevel 2

------------------------------------------------------------------------
Benchmark Run: Tue Dec 11 2012 10:24:54 - 10:53:02
2 CPUs in system; running 1 parallel copy of tests

Dhrystone 2 using register variables       20676550.5 lps   (10.0 s, 7 samples)
Double-Precision Whetstone                     3354.1 MWIPS (10.0 s, 7 samples)
Execl Throughput                               2497.2 lps   (29.7 s, 2 samples)
File Copy 1024 bufsize 2000 maxblocks        716569.6 KBps  (30.0 s, 2 samples)
File Copy 256 bufsize 500 maxblocks          189359.3 KBps  (30.0 s, 2 samples)
File Copy 4096 bufsize 8000 maxblocks       1675263.0 KBps  (30.0 s, 2 samples)
Pipe Throughput                             1158210.6 lps   (10.0 s, 7 samples)
Pipe-based Context Switching                  64648.6 lps   (10.0 s, 7 samples)
Process Creation                               6555.9 lps   (30.0 s, 2 samples)
Shell Scripts (1 concurrent)                   3503.9 lpm   (60.0 s, 2 samples)
Shell Scripts (8 concurrent)                    575.6 lpm   (60.1 s, 2 samples)
System Call Overhead                         876835.6 lps   (10.0 s, 7 samples)

System Benchmarks Index Values               BASELINE       RESULT    INDEX
Dhrystone 2 using register variables         116700.0   20676550.5   1771.8
Double-Precision Whetstone                       55.0       3354.1    609.8
Execl Throughput                                 43.0       2497.2    580.7
File Copy 1024 bufsize 2000 maxblocks          3960.0     716569.6   1809.5
File Copy 256 bufsize 500 maxblocks            1655.0     189359.3   1144.2
File Copy 4096 bufsize 8000 maxblocks          5800.0    1675263.0   2888.4
Pipe Throughput                               12440.0    1158210.6    931.0
Pipe-based Context Switching                   4000.0      64648.6    161.6
Process Creation                                126.0       6555.9    520.3
Shell Scripts (1 concurrent)                     42.4       3503.9    826.4
Shell Scripts (8 concurrent)                      6.0        575.6    959.3
System Call Overhead                          15000.0     876835.6    584.6
                                                                   ========
System Benchmarks Index Score                                         846.9

------------------------------------------------------------------------
Benchmark Run: Tue Dec 11 2012 10:53:02 - 11:23:25
2 CPUs in system; running 2 parallel copies of tests

Dhrystone 2 using register variables       18966959.7 lps   (10.0 s, 7 samples)
Double-Precision Whetstone                     6210.6 MWIPS (10.1 s, 7 samples)
Execl Throughput                               2841.0 lps   (30.0 s, 2 samples)
File Copy 1024 bufsize 2000 maxblocks        559216.4 KBps  (30.0 s, 2 samples)
File Copy 256 bufsize 500 maxblocks          149599.7 KBps  (30.0 s, 2 samples)
File Copy 4096 bufsize 8000 maxblocks       1224017.4 KBps  (30.0 s, 2 samples)
Pipe Throughput                             1055048.0 lps   (10.0 s, 7 samples)
Pipe-based Context Switching                  65205.3 lps   (10.0 s, 7 samples)
Process Creation                               6553.1 lps   (30.0 s, 2 samples)
Shell Scripts (1 concurrent)                   3568.8 lpm   (60.0 s, 2 samples)
Shell Scripts (8 concurrent)                    555.0 lpm   (60.2 s, 2 samples)
System Call Overhead                         773853.0 lps   (10.0 s, 7 samples)

System Benchmarks Index Values               BASELINE       RESULT    INDEX
Dhrystone 2 using register variables         116700.0   18966959.7   1625.3
Double-Precision Whetstone                       55.0       6210.6   1129.2
Execl Throughput                                 43.0       2841.0    660.7
File Copy 1024 bufsize 2000 maxblocks          3960.0     559216.4   1412.2
File Copy 256 bufsize 500 maxblocks            1655.0     149599.7    903.9
File Copy 4096 bufsize 8000 maxblocks          5800.0    1224017.4   2110.4
Pipe Throughput                               12440.0    1055048.0    848.1
Pipe-based Context Switching                   4000.0      65205.3    163.0
Process Creation                                126.0       6553.1    520.1
Shell Scripts (1 concurrent)                     42.4       3568.8    841.7
Shell Scripts (8 concurrent)                      6.0        555.0    924.9
System Call Overhead                          15000.0     773853.0    515.9
                                                                   ========
System Benchmarks Index Score                                         821.4
Testing again showed much better results, almost doubling the previous score:
   #    #  #    #  #  #    #          #####   ######  #    #   ####   #    #
   #    #  ##   #  #   #  #           #    #  #       ##   #  #    #  #    #
   #    #  # #  #  #    ##            #####   #####   # #  #  #       ######
   #    #  #  # #  #    ##            #    #  #       #  # #  #       #    #
   #    #  #   ##  #   #  #           #    #  #       #   ##  #    #  #    #
    ####   #    #  #  #    #          #####   ######  #    #   ####   #    #

   Version 5.1.3                      Based on the Byte Magazine Unix Benchmark

   Multi-CPU version                  Version 5 revisions by Ian Smith,
                                      Sunnyvale, CA, USA
   January 13, 2011                   johantheghost at yahoo period com


1 x Dhrystone 2 using register variables  1 2 3 4 5 6 7 8 9 10

1 x Double-Precision Whetstone  1 2 3 4 5 6 7 8 9 10

1 x Execl Throughput  1 2 3

1 x File Copy 1024 bufsize 2000 maxblocks  1 2 3

1 x File Copy 256 bufsize 500 maxblocks  1 2 3

1 x File Copy 4096 bufsize 8000 maxblocks  1 2 3

1 x Pipe Throughput  1 2 3 4 5 6 7 8 9 10

1 x Pipe-based Context Switching  1 2 3 4 5 6 7 8 9 10

1 x Process Creation  1 2 3

1 x System Call Overhead  1 2 3 4 5 6 7 8 9 10

1 x Shell Scripts (1 concurrent)  1 2 3

1 x Shell Scripts (8 concurrent)  1 2 3

2 x Dhrystone 2 using register variables  1 2 3 4 5 6 7 8 9 10

2 x Double-Precision Whetstone  1 2 3 4 5 6 7 8 9 10

2 x Execl Throughput  1 2 3

2 x File Copy 1024 bufsize 2000 maxblocks  1 2 3

2 x File Copy 256 bufsize 500 maxblocks  1 2 3

2 x File Copy 4096 bufsize 8000 maxblocks  1 2 3

2 x Pipe Throughput  1 2 3 4 5 6 7 8 9 10

2 x Pipe-based Context Switching  1 2 3 4 5 6 7 8 9 10

2 x Process Creation  1 2 3

2 x System Call Overhead  1 2 3 4 5 6 7 8 9 10

2 x Shell Scripts (1 concurrent)  1 2 3

2 x Shell Scripts (8 concurrent)  1 2 3

========================================================================
   BYTE UNIX Benchmarks (Version 5.1.3)

   System: xxxxxxx: GNU/Linux
   OS: GNU/Linux -- 2.6.32-042stab075.2 -- #1 SMP Tue Mar 5 15:21:53 MSK 2013
   Machine: i686 (unknown)
   Language: en_US.utf8 (charmap="UTF-8", collate="UTF-8")
   CPU 0: Intel(R) Xeon(R) CPU E3-1270 V2 @ 3.50GHz (6999.8 bogomips)
          Hyper-Threading, x86-64, MMX, Physical Address Ext, SYSENTER/SYSEXIT, SYSCALL/SYSRET, Intel virtualization
   CPU 1: Intel(R) Xeon(R) CPU E3-1270 V2 @ 3.50GHz (6999.8 bogomips)
          Hyper-Threading, x86-64, MMX, Physical Address Ext, SYSENTER/SYSEXIT, SYSCALL/SYSRET, Intel virtualization
   11:01:31 up 11:14,  1 user,  load average: 0.00, 0.00, 0.00; runlevel 2

------------------------------------------------------------------------
Benchmark Run: Sun Mar 31 2013 11:01:31 - 11:29:35
2 CPUs in system; running 1 parallel copy of tests

Dhrystone 2 using register variables       26341754.8 lps   (10.0 s, 7 samples)
Double-Precision Whetstone                     3859.5 MWIPS (10.0 s, 7 samples)
Execl Throughput                               7853.0 lps   (30.0 s, 2 samples)
File Copy 1024 bufsize 2000 maxblocks        862060.2 KBps  (30.0 s, 2 samples)
File Copy 256 bufsize 500 maxblocks          222662.7 KBps  (30.0 s, 2 samples)
File Copy 4096 bufsize 8000 maxblocks       2295277.6 KBps  (30.0 s, 2 samples)
Pipe Throughput                             1332087.4 lps   (10.0 s, 7 samples)
Pipe-based Context Switching                 310172.4 lps   (10.0 s, 7 samples)
Process Creation                              20782.0 lps   (30.0 s, 2 samples)
Shell Scripts (1 concurrent)                   9780.9 lpm   (60.0 s, 2 samples)
Shell Scripts (8 concurrent)                   1253.7 lpm   (60.0 s, 2 samples)
System Call Overhead                        1016407.3 lps   (10.0 s, 7 samples)

System Benchmarks Index Values               BASELINE       RESULT    INDEX
Dhrystone 2 using register variables         116700.0   26341754.8   2257.2
Double-Precision Whetstone                       55.0       3859.5    701.7
Execl Throughput                                 43.0       7853.0   1826.3
File Copy 1024 bufsize 2000 maxblocks          3960.0     862060.2   2176.9
File Copy 256 bufsize 500 maxblocks            1655.0     222662.7   1345.4
File Copy 4096 bufsize 8000 maxblocks          5800.0    2295277.6   3957.4
Pipe Throughput                               12440.0    1332087.4   1070.8
Pipe-based Context Switching                   4000.0     310172.4    775.4
Process Creation                                126.0      20782.0   1649.4
Shell Scripts (1 concurrent)                     42.4       9780.9   2306.8
Shell Scripts (8 concurrent)                      6.0       1253.7   2089.6
System Call Overhead                          15000.0    1016407.3    677.6
                                                                   ========
System Benchmarks Index Score                                        1518.2

------------------------------------------------------------------------
Benchmark Run: Sun Mar 31 2013 11:29:35 - 11:59:45
2 CPUs in system; running 2 parallel copies of tests

Dhrystone 2 using register variables       26048461.1 lps   (10.0 s, 7 samples)
Double-Precision Whetstone                     7680.0 MWIPS (10.0 s, 7 samples)
Execl Throughput                               7694.0 lps   (30.0 s, 2 samples)
File Copy 1024 bufsize 2000 maxblocks        859269.0 KBps  (30.0 s, 2 samples)
File Copy 256 bufsize 500 maxblocks          223645.7 KBps  (30.0 s, 2 samples)
File Copy 4096 bufsize 8000 maxblocks       2327457.2 KBps  (30.0 s, 2 samples)
Pipe Throughput                             1318553.7 lps   (10.0 s, 7 samples)
Pipe-based Context Switching                 297629.4 lps   (10.0 s, 7 samples)
Process Creation                              20485.0 lps   (30.0 s, 2 samples)
Shell Scripts (1 concurrent)                   9562.4 lpm   (60.0 s, 2 samples)
Shell Scripts (8 concurrent)                   1214.4 lpm   (60.0 s, 2 samples)
System Call Overhead                        1002323.5 lps   (10.0 s, 7 samples)

System Benchmarks Index Values               BASELINE       RESULT    INDEX
Dhrystone 2 using register variables         116700.0   26048461.1   2232.1
Double-Precision Whetstone                       55.0       7680.0   1396.4
Execl Throughput                                 43.0       7694.0   1789.3
File Copy 1024 bufsize 2000 maxblocks          3960.0     859269.0   2169.9
File Copy 256 bufsize 500 maxblocks            1655.0     223645.7   1351.3
File Copy 4096 bufsize 8000 maxblocks          5800.0    2327457.2   4012.9
Pipe Throughput                               12440.0    1318553.7   1059.9
Pipe-based Context Switching                   4000.0     297629.4    744.1
Process Creation                                126.0      20485.0   1625.8
Shell Scripts (1 concurrent)                     42.4       9562.4   2255.3
Shell Scripts (8 concurrent)                      6.0       1214.4   2024.0
System Call Overhead                          15000.0    1002323.5    668.2
                                                                   ========
System Benchmarks Index Score                                        1587.7
For Geekbench, we could see the processors are throttled to 800MHz, and the results are a lot more consistent than what was showing in the UnixBench results:
System Information
  Platform:                  Linux x86 (32-bit)
  Compiler:                  GCC 4.1.2 20070925 (Red Hat 4.1.2-33)
  Operating System:          Linux 2.6.32-042stab062.2 i686
  Model:                     Linux PC (Intel(R) Xeon(R) CPU E31230 @ 3.20GHz)
  Motherboard:               Unknown Motherboard
  Processor:                 Intel(R) Xeon(R) CPU E31230 @ 3.20GHz
  Processor ID:              GenuineIntel Family 6 Model 42 Stepping 7
  Logical Processors:        2
  Physical Processors:       1
  Processor Frequency:       800 MHz
  L1 Instruction Cache:      0.00 B
  L1 Data Cache:             0.00 B
  L2 Cache:                  256 KB
  L3 Cache:                  0.00 B
  Bus Frequency:             0.00 Hz
  Memory:                    256 MB
  Memory Type:               N/A
  SIMD:                      1
  BIOS:                      N/A
  Processor Model:                     Intel(R) Xeon(R) CPU E31230 @ 3.20GHz
  Processor Cores:           2

Integer
  Blowfish
    single-threaded scalar    2241 ||||||||
    multi-threaded scalar     4298 |||||||||||||||||
  Text Compress
    single-threaded scalar    2950 |||||||||||
    multi-threaded scalar     2997 |||||||||||
  Text Decompress
    single-threaded scalar    3208 ||||||||||||
    multi-threaded scalar     3791 |||||||||||||||
  Image Compress
    single-threaded scalar    2502 ||||||||||
    multi-threaded scalar     4787 |||||||||||||||||||
  Image Decompress
    single-threaded scalar    2472 |||||||||
    multi-threaded scalar     4895 |||||||||||||||||||
  Lua
    single-threaded scalar    4101 ||||||||||||||||
    multi-threaded scalar     4326 |||||||||||||||||

Floating Point
  Mandelbrot
    single-threaded scalar    2760 |||||||||||
    multi-threaded scalar     3121 ||||||||||||
  Dot Product
    single-threaded scalar    4656 ||||||||||||||||||
    multi-threaded scalar     5955 |||||||||||||||||||||||
    single-threaded vector    5647 ||||||||||||||||||||||
    multi-threaded vector    12630 ||||||||||||||||||||||||||||||||||||||||||||||||||
  LU Decomposition
    single-threaded scalar    3589 ||||||||||||||
    multi-threaded scalar     5853 |||||||||||||||||||||||
  Primality Test
    single-threaded scalar    4881 |||||||||||||||||||
    multi-threaded scalar     3859 |||||||||||||||
  Sharpen Image
    single-threaded scalar   11442 |||||||||||||||||||||||||||||||||||||||||||||
    multi-threaded scalar    20328 |||||||||||||||||||||||||||||||||||||||||||||||||||||||||||||||||||||||||||||||||
  Blur Image
    single-threaded scalar    8476 |||||||||||||||||||||||||||||||||
    multi-threaded scalar    10189 ||||||||||||||||||||||||||||||||||||||||

Memory
  Read Sequential
    single-threaded scalar    6238 ||||||||||||||||||||||||
  Write Sequential
    single-threaded scalar    6234 ||||||||||||||||||||||||
  Stdlib Allocate
    single-threaded scalar    5059 ||||||||||||||||||||
  Stdlib Write
    single-threaded scalar    4101 ||||||||||||||||
  Stdlib Copy
    single-threaded scalar    7837 |||||||||||||||||||||||||||||||

Stream
  Stream Copy
    single-threaded scalar    3163 ||||||||||||
    single-threaded vector    3992 |||||||||||||||
  Stream Scale
    single-threaded scalar    3337 |||||||||||||
    single-threaded vector    3903 |||||||||||||||
  Stream Add
    single-threaded scalar    3203 ||||||||||||
    single-threaded vector    3685 ||||||||||||||
  Stream Triad
    single-threaded scalar    3454 |||||||||||||
    single-threaded vector    2730 ||||||||||

Integer Score:                3547 ||||||||||||||
Floating Point Score:         7384 |||||||||||||||||||||||||||||
Memory Score:                 5893 |||||||||||||||||||||||
Stream Score:                 3433 |||||||||||||

Overall Geekbench Score:      5347 |||||||||||||||||||||
Testing again showed more or less similar results:
System Information
  Platform:                  Linux x86 (32-bit)
  Compiler:                  GCC 4.1.2 20070925 (Red Hat 4.1.2-33)
  Operating System:          Linux 2.6.32-042stab062.2 i686
  Model:                     Linux PC (Intel(R) Xeon(R) CPU E31230 @ 3.20GHz)
  Motherboard:               Unknown Motherboard
  Processor:                 Intel(R) Xeon(R) CPU E31230 @ 3.20GHz
  Processor ID:              GenuineIntel Family 6 Model 42 Stepping 7
  Logical Processors:        2
  Physical Processors:       1
  Processor Frequency:       800 MHz
  L1 Instruction Cache:      0.00 B
  L1 Data Cache:             0.00 B
  L2 Cache:                  256 KB
  L3 Cache:                  0.00 B
  Bus Frequency:             0.00 Hz
  Memory:                    256 MB
  Memory Type:               N/A
  SIMD:                      1
  BIOS:                      N/A
  Processor Model:                     Intel(R) Xeon(R) CPU E31230 @ 3.20GHz
  Processor Cores:           2

Integer
  Blowfish
    single-threaded scalar    2226 ||||||||
    multi-threaded scalar     4428 |||||||||||||||||
  Text Compress
    single-threaded scalar    2967 |||||||||||
    multi-threaded scalar     2986 |||||||||||
  Text Decompress
    single-threaded scalar    3170 ||||||||||||
    multi-threaded scalar     3903 |||||||||||||||
  Image Compress
    single-threaded scalar    2087 ||||||||
    multi-threaded scalar     4727 ||||||||||||||||||
  Image Decompress
    single-threaded scalar    2482 |||||||||
    multi-threaded scalar     4904 |||||||||||||||||||
  Lua
    single-threaded scalar    4108 ||||||||||||||||
    multi-threaded scalar     3724 ||||||||||||||

Floating Point
  Mandelbrot
    single-threaded scalar    2838 |||||||||||
    multi-threaded scalar     2987 |||||||||||
  Dot Product
    single-threaded scalar    4551 ||||||||||||||||||
    multi-threaded scalar     6293 |||||||||||||||||||||||||
    single-threaded vector    5603 ||||||||||||||||||||||
    multi-threaded vector    11007 ||||||||||||||||||||||||||||||||||||||||||||
  LU Decomposition
    single-threaded scalar    3262 |||||||||||||
    multi-threaded scalar     4832 |||||||||||||||||||
  Primality Test
    single-threaded scalar    4906 |||||||||||||||||||
    multi-threaded scalar     4073 ||||||||||||||||
  Sharpen Image
    single-threaded scalar   10008 ||||||||||||||||||||||||||||||||||||||||
    multi-threaded scalar    18261 |||||||||||||||||||||||||||||||||||||||||||||||||||||||||||||||||||||||||
  Blur Image
    single-threaded scalar    7940 |||||||||||||||||||||||||||||||
    multi-threaded scalar     9925 |||||||||||||||||||||||||||||||||||||||

Memory
  Read Sequential
    single-threaded scalar    5910 |||||||||||||||||||||||
  Write Sequential
    single-threaded scalar    5883 |||||||||||||||||||||||
  Stdlib Allocate
    single-threaded scalar    5094 ||||||||||||||||||||
  Stdlib Write
    single-threaded scalar    4023 ||||||||||||||||
  Stdlib Copy
    single-threaded scalar    8033 ||||||||||||||||||||||||||||||||

Stream
  Stream Copy
    single-threaded scalar    3240 ||||||||||||
    single-threaded vector    3696 ||||||||||||||
  Stream Scale
    single-threaded scalar    3839 |||||||||||||||
    single-threaded vector    3783 |||||||||||||||
  Stream Add
    single-threaded scalar    3192 ||||||||||||
    single-threaded vector    3685 ||||||||||||||
  Stream Triad
    single-threaded scalar    3487 |||||||||||||
    single-threaded vector    2692 ||||||||||

Integer Score:                3476 |||||||||||||
Floating Point Score:         6891 |||||||||||||||||||||||||||
Memory Score:                 5788 |||||||||||||||||||||||
Stream Score:                 3451 |||||||||||||

Overall Geekbench Score:      5131 ||||||||||||||||||||
Customer Service and Support
In order to test out the level of customer support, I have logged in two tickets, one is for a straight-forward “yes/no” type of question and the second one is to add an OS template, which I thought would take more time to do so. Both tickets are logged at about 9:30pm on a Saturday evening and the first question was responded in three minutes and the second one, was responded in four minutes, and the OS template was already added. I have to say such a quick speed in response is probably something that is truly impressive.
Conclusion
It is really difficult for me to come to a solid conclusion on VPSBlast, on one hand, the KiwiVM panel was impressive, network speed was great and the support is amazingly fast. However, the inconsistent disk I/O and UnixBench score is really what stopped me from saying this VPS as the “perfect” provider, particularly since most of the people are getting SSD VPS for the sake of getting good disk I/O and that is, for the most part, why people are paying the premium of the SSD VPS versus the traditional HDD-based configuration. Furthermore, the CPU cores are throttled, and considering the fact that most of the programs running in low end VPS are single-threaded, it is probably better to have a single unthrottled core than two throttled CPU cores. Nonetheless, overall, the experience with VPSBlast is positive and if you are looking for a SSD VPS with fast network and fast support, it definitely worth a try.
Please approve my new banner I uploaded on buysellads.com. You still have not approved and it seems to be taking a very long time. Thank you.
@Chad Done, sorry for the wait, if you have any issue with advertisement in future please email me admin AT 96mb DOT com.