
96MB Low End VPS Review Part 64–Ninja Hawk
NinjaHawk is probably not one of the VPS providers who provide aggressive prices in the LEB community (which is in contrast, of, say, ChicagoVPS), and quite frankly speaking the pricing that they have, without discount at least, is definitely in the “premier” range. Although this is definitely not the first non-LEB VPS provider I have ever reviewed (you can see some of the examples here, here and here), since personally I feel that it is a matter of personal choices that some people would simply like to pay more for one reason or another (even though I do encourage readers like you to get the most work done using the least amount of resources), I definitely have higher expectations on the non-LEB providers. So how is NinjaHawk holding up with regards to this, especially after one of their founding members has left? Let’s take a look.
Basic Information and Set Up
First and foremost, I have to say NinjaHwak definitely has probably one of the most beautiful website design that I have seen, and the Hawk logo is definitely good as well. Obviously these won’t have any impact during my review, but it is nonetheless something pleasant to see.

I first saw their offer on LowEndTalk and here is what you get for 7USD per month:
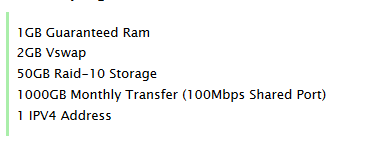
As you can see, the specification itself is probably not the impressive for the price paid (for people who visit LET/LEB often, the “standard” price we see for a 1GB RAM VPS is about 5-6USD per month), and their undiscounted price is definitely closer to the “premium” providers than the budget providers. Therefore, I definitely have a higher expectation on the services level.
Set up was instant and the new server information is a quite standard one from WHCMS, although much more simpler and there is also some information about the CPanel and WHM access information. It is again another very simple change on the WHCMS email template but could avoid some unnecessary complains such as “why is the CPanel on my VPS showing trail license”, etc.

The WHCMS system they have is on a secured HTTPS interface and once logged in, the VPS control panel can be found under My Services:
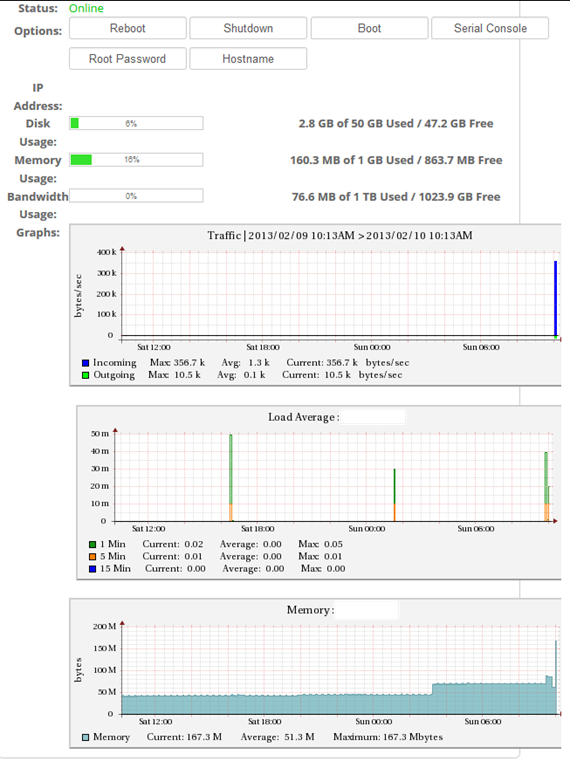
As you can see, all three graphs are available on the WHMCS interface, although for some reason the graphs are not positioned well on the screen and was cut off towards the right hand side.
Most of the buttons on the control panel seem to work, for example, I managed to change my root password from the control panel:

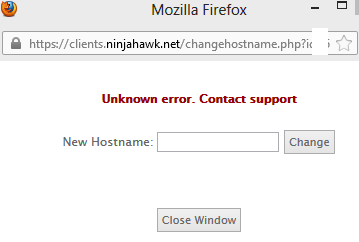
However, when I tried to change the host name, it actually failed:
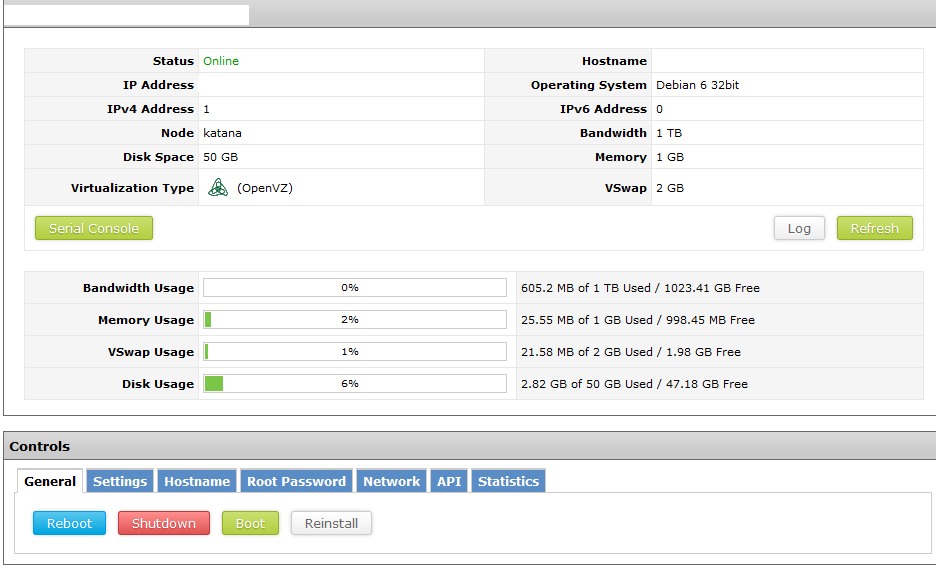
Other than that there is a Control Panel Login link, which is going to take you to the SolusVM control panel once you click in the link. Although it is a relatively small change, but it is quite convenient for people who logged into the WHCMS system initially to make changes to the VPS but realized they will need to do a bit more later on. Also, for most of the providers, the WHCMS interface is accessible from their homepage, which means all I need to know is the URL of the provider (which is easy to remember) rather than remembering the link to their SolusVM page:

Their SolusVM page is a secured HTTPS page with non-standard port.
There are quite a few OS templates available for reinstallation, and each one of them is accompanied by a general introduction:
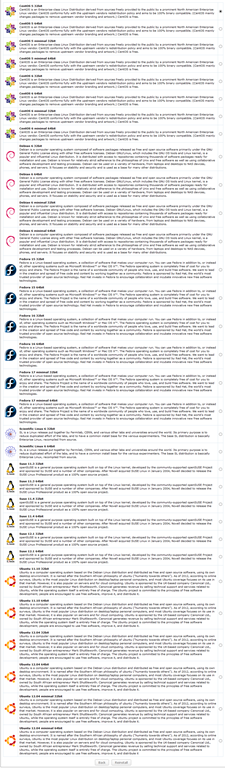
In my opinion, the explanatory text is rather long and unnecessary since it is a general description that I am pretty sure whoever that intend to use will understand. It would be nice if some template-specific comments could be added.
Other than that, there is not too much excitement, and instant rDNS does not appear to be available:

Test on the VPS
As mentioned above, the test VPS that I have signed up has 1GB of dedicated RAM and 2GB of vSwap space, 50GB hard drive space and 1TB of bandwidth on 100mbit port. The VPS is located in Corexchange DC in Dallas, Texas and I have installed Debian 6 32 bit template for testing.
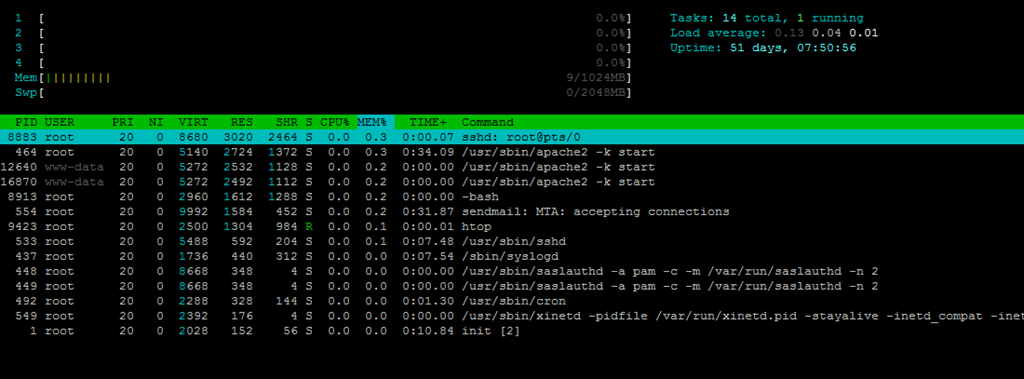
When the OS was initially loaded, about 7MB of RAM was used:
free -m
             total       used       free     shared    buffers     cached
Mem:          1024         35        988          0          0         27
-/+ buffers/cache:          7       1016
Swap:         2048          0       2048
Top showing the processes running:
top - 17:29:12 up 51 days,  7:49,  1 user,  load average: 0.00, 0.00, 0.00
Tasks:  16 total,   1 running,  15 sleeping,   0 stopped,   0 zombie
Cpu(s):  0.0%us,  0.0%sy,  0.0%ni,100.0%id,  0.0%wa,  0.0%hi,  0.0%si,  0.0%st
Mem:   1048576k total,    36232k used,  1012344k free,        0k buffers
Swap:  2097152k total,        0k used,  2097152k free,    28676k cached

  PID USER      PR  NI  VIRT  RES  SHR S %CPU %MEM    TIME+  COMMAND
 8883 root      20   0  8680 3020 2464 S    0  0.3   0:00.05 sshd
  464 root      20   0  5140 2724 1372 S    0  0.3   0:34.09 apache2
12640 www-data  20   0  5272 2532 1128 S    0  0.2   0:00.00 apache2
16870 www-data  20   0  5272 2492 1112 S    0  0.2   0:00.00 apache2
 8913 root      20   0  2960 1604 1284 S    0  0.2   0:00.00 bash
  554 root      20   0  9992 1584  452 S    0  0.2   0:31.88 sendmail-mta
 8924 root      20   0  2328 1088  900 R    0  0.1   0:00.00 top
  533 root      20   0  5488  592  204 S    0  0.1   0:07.48 sshd
  437 root      20   0  1736  440  312 S    0  0.0   0:07.55 syslogd
  448 root      20   0  8668  348    4 S    0  0.0   0:00.00 saslauthd
  449 root      20   0  8668  348    4 S    0  0.0   0:00.00 saslauthd
  492 root      20   0  2288  328  144 S    0  0.0   0:01.31 cron
  549 root      20   0  2392  176    4 S    0  0.0   0:00.00 xinetd
    1 root      20   0  2028  152   56 S    0  0.0   0:10.85 init
    2 root      20   0     0    0    0 S    0  0.0   0:00.00 kthreadd/104
    3 root      20   0     0    0    0 S    0  0.0   0:00.00 khelper/104
Htop output showing the RAM usage:
And slightly above 500MB of hard drive space was used:
df -h
Filesystem            Size  Used Avail Use% Mounted on
/dev/simfs             50G  518M   50G   2% /
tmpfs                  16G     0   16G   0% /lib/init/rw
tmpfs                  16G     0   16G   0% /dev/shm
About 1% of iNodes are used:
 df -i
Filesystem            Inodes   IUsed   IFree IUse% Mounted on
/dev/simfs           26214400   26207 26188193    1% /
tmpfs                4098583       4 4098579    1% /lib/init/rw
tmpfs                4098583       1 4098582    1% /dev/shm
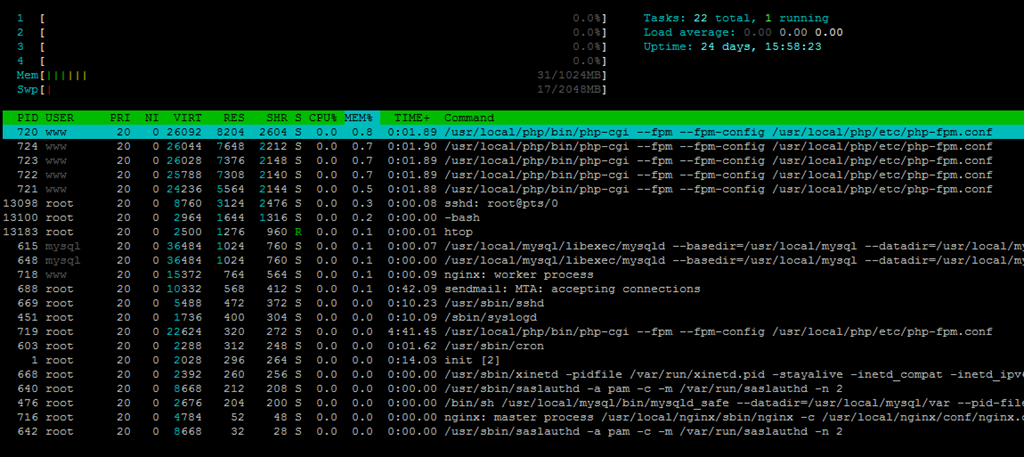
When the full LNMP stack is loaded, about 30MB of RAM was used:
 free -m
             total       used       free     shared    buffers     cached
Mem:          1024         58        965          0          0         27
-/+ buffers/cache:         30        993
Swap:         2048         17       2030
Top showing the full stack running:
top - 23:07:41 up 24 days, 15:57,  1 user,  load average: 0.00, 0.00, 0.00
Tasks:  23 total,   1 running,  22 sleeping,   0 stopped,   0 zombie
Cpu(s):  0.0%us,  0.0%sy,  0.0%ni,100.0%id,  0.0%wa,  0.0%hi,  0.0%si,  0.0%st
Mem:   1048576k total,    60296k used,   988280k free,        0k buffers
Swap:  2097152k total,    17592k used,  2079560k free,    28436k cached

  PID USER      PR  NI  VIRT  RES  SHR S %CPU %MEM    TIME+  COMMAND
  720 www       20   0 26092 8204 2604 S    0  0.8   0:01.89 php-cgi
  724 www       20   0 26044 7648 2212 S    0  0.7   0:01.90 php-cgi
  723 www       20   0 26028 7376 2148 S    0  0.7   0:01.89 php-cgi
  722 www       20   0 25788 7308 2140 S    0  0.7   0:01.89 php-cgi
  721 www       20   0 24236 5564 2144 S    0  0.5   0:01.88 php-cgi
13098 root      20   0  8760 3124 2476 S    0  0.3   0:00.08 sshd
13100 root      20   0  2964 1644 1316 S    0  0.2   0:00.00 bash
13182 root      20   0  2328 1084  884 R    0  0.1   0:00.00 top
  615 mysql     20   0 36484 1024  760 S    0  0.1   0:00.29 mysqld
  718 www       20   0 15372  764  564 S    0  0.1   0:00.09 nginx
  688 root      20   0 10332  568  412 S    0  0.1   0:42.10 sendmail-mta
  669 root      20   0  5488  472  372 S    0  0.0   0:10.24 sshd
  451 root      20   0  1736  400  304 S    0  0.0   0:10.10 syslogd
  719 root      20   0 22624  320  272 S    0  0.0   4:41.45 php-cgi
  603 root      20   0  2288  312  248 S    0  0.0   0:01.62 cron
    1 root      20   0  2028  296  264 S    0  0.0   0:14.04 init
  668 root      20   0  2392  260  256 S    0  0.0   0:00.00 xinetd
  640 root      20   0  8668  212  208 S    0  0.0   0:00.00 saslauthd
  476 root      20   0  2676  204  200 S    0  0.0   0:00.00 mysqld_safe
  716 root      20   0  4784   52   48 S    0  0.0   0:00.00 nginx
  642 root      20   0  8668   32   28 S    0  0.0   0:00.00 saslauthd
    2 root      20   0     0    0    0 S    0  0.0   0:00.00 kthreadd/104
    3 root      20   0     0    0    0 S    0  0.0   0:00.00 khelper/104
And htop output:
About 2.8GB of hard drive space was used when the full stack was loaded:
df -h
Filesystem            Size  Used Avail Use% Mounted on
/dev/simfs             50G  2.8G   48G   6% /
tmpfs                 512M     0  512M   0% /lib/init/rw
tmpfs                 512M     0  512M   0% /dev/shm
And the iNode value is pretty high:
 df -i
Filesystem            Inodes   IUsed   IFree IUse% Mounted on
/dev/simfs           26214400   69597 26144803    1% /
tmpfs                 131072       4  131068    1% /lib/init/rw
tmpfs                 131072       1  131071    1% /dev/shm
The VPS is quite stable as shown in the uptime output:
 uptime
 17:28:30 up 51 days,  7:49,  1 user,  load average: 0.00, 0.00, 0.00
VMStat also shows 0 iowait:
 vmstat
procs -----------memory---------- ---swap-- -----io---- -system-- ----cpu----
 r  b   swpd   free   buff  cache   si   so    bi    bo   in   cs us sy id wa
 0  0  17416 884248      0 132276    0    0     0     0    0    3  0  0 100  0
I am not sure what has changed with most of the recent OpenVZ set up but the beancounter values are pretty strange at best:
 cat /proc/user_beancounters
Version: 2.5
       uid  resource                     held              maxheld              barrier                limit              failcnt
      104:  kmemsize                  4413762              5734400            536870912            536870912                    0
            lockedpages                     0                    0               131072               131072                    0
            privvmpages                 21656                24926  9223372036854775807  9223372036854775807                    0
            shmpages                      642                 2018  9223372036854775807  9223372036854775807                    0
            dummy                           0                    0                    0                    0                    0
            numproc                        24                   54  9223372036854775807  9223372036854775807                    0
            physpages                   17332                27063                    0               262144                    0
            vmguarpages                     0                    0  9223372036854775807  9223372036854775807                    0
            oomguarpages                11160                12666  9223372036854775807  9223372036854775807                    0
            numtcpsock                      7                   14  9223372036854775807  9223372036854775807                    0
            numflock                        4                    6  9223372036854775807  9223372036854775807                    0
            numpty                          1                    6  9223372036854775807  9223372036854775807                    0
            numsiginfo                      0                   30  9223372036854775807  9223372036854775807                    0
            tcpsndbuf                  124392               244160  9223372036854775807  9223372036854775807                    0
            tcprcvbuf                  114688               229376  9223372036854775807  9223372036854775807                    0
            othersockbuf                 9248                45648  9223372036854775807  9223372036854775807                    0
            dgramrcvbuf                     0                 4624  9223372036854775807  9223372036854775807                    0
            numothersock                   41                   59  9223372036854775807  9223372036854775807                    0
            dcachesize                1891321              1945544            268435456            268435456                    0
            numfile                       352                  590  9223372036854775807  9223372036854775807                    0
            dummy                           0                    0                    0                    0                    0
            dummy                           0                    0                    0                    0                    0
            dummy                           0                    0                    0                    0                    0
            numiptent                      24                   24  9223372036854775807  9223372036854775807
As a result, I have got some pretty weird vzfree values:
 vzfree
             Total     Used     Free
Kernel:    512.00M    4.69M  507.31M
Allocate: 36028797018963968.00M   86.96M 36028797018963880.00M (36028797018963967M Guaranteed)
Commit:   36028797018963968.00M   49.78M 36028797018963920.00M (51.9% of Allocated)
Swap:               -38.25M          (-84.8% of Committed)
CPUInfo shows the processor assigned to this VPS is the Xeon E21230 and there are four cores assigned:
cat /proc/cpuinfo
processor       : 0
vendor_id       : GenuineIntel
cpu family      : 6
model           : 42
model name      : Intel(R) Xeon(R) CPU E31230 @ 3.20GHz
stepping        : 7
cpu MHz         : 3192.634
cache size      : 8192 KB
physical id     : 0
siblings        : 8
core id         : 0
cpu cores       : 4
apicid          : 0
initial apicid  : 0
fpu             : yes
fpu_exception   : yes
cpuid level     : 13
wp              : yes
flags           : fpu vme de pse tsc msr pae mce cx8 apic sep mtrr pge mca cmov pat pse36 clflush dts acpi mmx fxsr sse sse2 ss ht tm pbe syscall nx rdtscp lm constant_tsc arch_perfmon pebs bts rep_good xtopology nonstop_tsc aperfmperf pni pclmulqdq dtes64 monitor ds_cpl vmx smx est tm2 ssse3 cx16 xtpr pdcm sse4_1 sse4_2 x2apic popcnt xsave avx lahf_lm ida arat epb xsaveopt pln pts dts tpr_shadow vnmi flexpriority ept vpid
bogomips        : 6385.26
clflush size    : 64
cache_alignment : 64
address sizes   : 36 bits physical, 48 bits virtual
power management:

processor       : 1
vendor_id       : GenuineIntel
cpu family      : 6
model           : 42
model name      : Intel(R) Xeon(R) CPU E31230 @ 3.20GHz
stepping        : 7
cpu MHz         : 3192.634
cache size      : 8192 KB
physical id     : 0
siblings        : 8
core id         : 1
cpu cores       : 4
apicid          : 2
initial apicid  : 2
fpu             : yes
fpu_exception   : yes
cpuid level     : 13
wp              : yes
flags           : fpu vme de pse tsc msr pae mce cx8 apic sep mtrr pge mca cmov pat pse36 clflush dts acpi mmx fxsr sse sse2 ss ht tm pbe syscall nx rdtscp lm constant_tsc arch_perfmon pebs bts rep_good xtopology nonstop_tsc aperfmperf pni pclmulqdq dtes64 monitor ds_cpl vmx smx est tm2 ssse3 cx16 xtpr pdcm sse4_1 sse4_2 x2apic popcnt xsave avx lahf_lm ida arat epb xsaveopt pln pts dts tpr_shadow vnmi flexpriority ept vpid
bogomips        : 6385.26
clflush size    : 64
cache_alignment : 64
address sizes   : 36 bits physical, 48 bits virtual
power management:

processor       : 2
vendor_id       : GenuineIntel
cpu family      : 6
model           : 42
model name      : Intel(R) Xeon(R) CPU E31230 @ 3.20GHz
stepping        : 7
cpu MHz         : 3192.634
cache size      : 8192 KB
physical id     : 0
siblings        : 8
core id         : 2
cpu cores       : 4
apicid          : 4
initial apicid  : 4
fpu             : yes
fpu_exception   : yes
cpuid level     : 13
wp              : yes
flags           : fpu vme de pse tsc msr pae mce cx8 apic sep mtrr pge mca cmov pat pse36 clflush dts acpi mmx fxsr sse sse2 ss ht tm pbe syscall nx rdtscp lm constant_tsc arch_perfmon pebs bts rep_good xtopology nonstop_tsc aperfmperf pni pclmulqdq dtes64 monitor ds_cpl vmx smx est tm2 ssse3 cx16 xtpr pdcm sse4_1 sse4_2 x2apic popcnt xsave avx lahf_lm ida arat epb xsaveopt pln pts dts tpr_shadow vnmi flexpriority ept vpid
bogomips        : 6385.26
clflush size    : 64
cache_alignment : 64
address sizes   : 36 bits physical, 48 bits virtual
power management:

processor       : 3
vendor_id       : GenuineIntel
cpu family      : 6
model           : 42
model name      : Intel(R) Xeon(R) CPU E31230 @ 3.20GHz
stepping        : 7
cpu MHz         : 3192.634
cache size      : 8192 KB
physical id     : 0
siblings        : 8
core id         : 3
cpu cores       : 4
apicid          : 6
initial apicid  : 6
fpu             : yes
fpu_exception   : yes
cpuid level     : 13
wp              : yes
flags           : fpu vme de pse tsc msr pae mce cx8 apic sep mtrr pge mca cmov pat pse36 clflush dts acpi mmx fxsr sse sse2 ss ht tm pbe syscall nx rdtscp lm constant_tsc arch_perfmon pebs bts rep_good xtopology nonstop_tsc aperfmperf pni pclmulqdq dtes64 monitor ds_cpl vmx smx est tm2 ssse3 cx16 xtpr pdcm sse4_1 sse4_2 x2apic popcnt xsave avx lahf_lm ida arat epb xsaveopt pln pts dts tpr_shadow vnmi flexpriority ept vpid
bogomips        : 6385.26
clflush size    : 64
cache_alignment : 64
address sizes   : 36 bits physical, 48 bits virtual
power management:
Meminfo output:
cat /proc/meminfo
MemTotal:        1048576 kB
MemFree:          884728 kB
Cached:           132008 kB
Active:            26968 kB
Inactive:         132116 kB
Active(anon):      12564 kB
Inactive(anon):    14512 kB
Active(file):      14404 kB
Inactive(file):   117604 kB
Unevictable:           0 kB
Mlocked:               0 kB
SwapTotal:       2097152 kB
SwapFree:        2079568 kB
Dirty:            102400 kB
Writeback:             0 kB
AnonPages:         27076 kB
Shmem:              2568 kB
Slab:               4724 kB
SReclaimable:       2252 kB
SUnreclaim:         2472 kB
And time sync:
 time sync

real    0m0.071s
user    0m0.001s
sys     0m0.000s
As the VPS is using RAID10 for storage, I expect pretty good disk I/O speed, and indeed in this case the VPS put in some pretty decent results:
dd if=/dev/zero of=test bs=64k count=16k conv=fdatasync
16384+0 records in
16384+0 records out
1073741824 bytes (1.1 GB) copied, 9.71313 s, 111 MB/s
Obviously since the disk is not SSD RAID the result is not eye-popping surprisingly high, however this is definitely more than enough for any general use of VPS.
Testing again showed even better results:
 dd if=/dev/zero of=test bs=64k count=16k conv=fdatasync
16384+0 records in
16384+0 records out
1073741824 bytes (1.1 GB) copied, 9.05247 s, 119 MB/s
The ioping results are fairly consistent as well, and although it is obviously not as good as the results you would see on a SSD VPS, I’d say it is still pretty decent:
ioping -c 10 .
4096 bytes from . (simfs /vz/private/104): request=1 time=1.0 ms
4096 bytes from . (simfs /vz/private/104): request=2 time=0.9 ms
4096 bytes from . (simfs /vz/private/104): request=3 time=0.3 ms
4096 bytes from . (simfs /vz/private/104): request=4 time=0.2 ms
4096 bytes from . (simfs /vz/private/104): request=5 time=0.2 ms
4096 bytes from . (simfs /vz/private/104): request=6 time=0.2 ms
4096 bytes from . (simfs /vz/private/104): request=7 time=16.5 ms
4096 bytes from . (simfs /vz/private/104): request=8 time=0.2 ms
4096 bytes from . (simfs /vz/private/104): request=9 time=0.2 ms
4096 bytes from . (simfs /vz/private/104): request=10 time=0.2 ms

--- . (simfs /vz/private/104) ioping statistics ---
10 requests completed in 9021.2 ms, 497 iops, 1.9 mb/s
min/avg/max/mdev = 0.2/2.0/16.5/4.8 ms
As you can see, one of the pings seems to have a bit of issue, but other than that, the ping is within the 1ms range.
Testing again showed similar results:
ioping -c 10 .
4096 bytes from . (simfs /vz/private/104): request=1 time=1.1 ms
4096 bytes from . (simfs /vz/private/104): request=2 time=0.3 ms
4096 bytes from . (simfs /vz/private/104): request=3 time=0.2 ms
4096 bytes from . (simfs /vz/private/104): request=4 time=0.3 ms
4096 bytes from . (simfs /vz/private/104): request=5 time=0.3 ms
4096 bytes from . (simfs /vz/private/104): request=6 time=0.3 ms
4096 bytes from . (simfs /vz/private/104): request=7 time=0.3 ms
4096 bytes from . (simfs /vz/private/104): request=8 time=0.3 ms
4096 bytes from . (simfs /vz/private/104): request=9 time=0.4 ms
4096 bytes from . (simfs /vz/private/104): request=10 time=0.3 ms

--- . (simfs /vz/private/104) ioping statistics ---
10 requests completed in 9005.2 ms, 2581 iops, 10.1 mb/s
min/avg/max/mdev = 0.2/0.4/1.1/0.2 ms
Download speed was not bad for a 100mbit port:
 wget cachefly.cachefly.net/100mb.test -O /dev/null
--2013-02-10 23:26:57--  http://cachefly.cachefly.net/100mb.test
Resolving cachefly.cachefly.net... 205.234.175.175
Connecting to cachefly.cachefly.net|205.234.175.175|:80... connected.
HTTP request sent, awaiting response... 200 OK
Length: 104857600 (100M) [application/octet-stream]
Saving to: `/dev/null'

100%[=======================================================================================================================================>] 104,857,600 11.0M/s   in 9.7s

2013-02-10 23:27:07 (10.3 MB/s) - `/dev/null' saved [104857600/104857600]
Tried it the next day and the speed is even slightly better, this time hitting close to the port speed:
 wget cachefly.cachefly.net/100mb.test -O /dev/null
--2012-12-11 11:32:29--  http://cachefly.cachefly.net/100mb.test
Resolving cachefly.cachefly.net... 205.234.175.175
Connecting to cachefly.cachefly.net|205.234.175.175|:80... connected.
HTTP request sent, awaiting response... 200 OK
Length: 104857600 (100M) [application/octet-stream]
Saving to: `/dev/null'

100%[=====================================>] 104,857,600 11.3M/s   in 8.9s

2012-12-11 11:32:38 (11.3 MB/s) - `/dev/null' saved [104857600/104857600]
Upload speed, as usual, is mostly affected by the location, with the fastest upload speed with my Quickweb VPS locaed in Chicago, IL:
wget 108.166.175.162/100mb.test -O /dev/null
--2013-02-10 08:17:21--  http://108.166.175.162/100mb.test
Connecting to 108.166.175.162:80... connected.
HTTP request sent, awaiting response... 200 OK
Length: 104857600 (100M) [application/octet-stream]
Saving to: `/dev/null'

100%[======================================>] 104,857,600 3.54M/s   in 29s

2013-02-10 08:17:50 (3.45 MB/s) - `/dev/null' saved [104857600/104857600]
Along the west coast, the speed is significantly lower – in fact, it was the slowest upload speed among all three, and I was only able to get 1.34MB/s with my test VPS from ChicagoVPS located at Los Angeles, CA:
 wget 108.166.175.162/100mb.test -O /dev/null
--2013-02-10 19:18:25--  http://108.166.175.162/100mb.test
Connecting to 108.166.175.162:80... connected.
HTTP request sent, awaiting response... 200 OK
Length: 104857600 (100M) [application/octet-stream]
Saving to: `/dev/null'

100%[======================================>] 104,857,600 1.38M/s   in 75s

2013-02-10 19:19:40 (1.34 MB/s) - `/dev/null' saved [104857600/104857600]
Surprisingly, the upload speed to UK is not bad, my test VPS at HTTPSimple was able to pull the file at 2.76MB/s.
wget 108.166.175.162/100mb.test -O /dev/null
--2013-02-10 19:25:27--  http://108.166.175.162/100mb.test
Connecting to 108.166.175.162:80... connected.
HTTP request sent, awaiting response... 200 OK
Length: 104857600 (100M) [application/octet-stream]
Saving to: `/dev/null'

100%[======================================>] 104,857,600 2.89M/s   in 36s

2013-02-10 19:26:03 (2.76 MB/s) - `/dev/null' saved [104857600/104857600]
Finally, for the benchmarks, normally VPS with multiple cores perform well in the Unixbench tests, and this time it is of no exception:
   #    #  #    #  #  #    #          #####   ######  #    #   ####   #    #
   #    #  ##   #  #   #  #           #    #  #       ##   #  #    #  #    #
   #    #  # #  #  #    ##            #####   #####   # #  #  #       ######
   #    #  #  # #  #    ##            #    #  #       #  # #  #       #    #
   #    #  #   ##  #   #  #           #    #  #       #   ##  #    #  #    #
    ####   #    #  #  #    #          #####   ######  #    #   ####   #    #

   Version 5.1.3                      Based on the Byte Magazine Unix Benchmark

   Multi-CPU version                  Version 5 revisions by Ian Smith,
                                      Sunnyvale, CA, USA
   January 13, 2011                   johantheghost at yahoo period com


1 x Dhrystone 2 using register variables  1 2 3 4 5 6 7 8 9 10

1 x Double-Precision Whetstone  1 2 3 4 5 6 7 8 9 10

1 x Execl Throughput  1 2 3

1 x File Copy 1024 bufsize 2000 maxblocks  1 2 3

1 x File Copy 256 bufsize 500 maxblocks  1 2 3

1 x File Copy 4096 bufsize 8000 maxblocks  1 2 3

1 x Pipe Throughput  1 2 3 4 5 6 7 8 9 10

1 x Pipe-based Context Switching  1 2 3 4 5 6 7 8 9 10

1 x Process Creation  1 2 3

1 x System Call Overhead  1 2 3 4 5 6 7 8 9 10

1 x Shell Scripts (1 concurrent)  1 2 3

1 x Shell Scripts (8 concurrent)  1 2 3

4 x Dhrystone 2 using register variables  1 2 3 4 5 6 7 8 9 10

4 x Double-Precision Whetstone  1 2 3 4 5 6 7 8 9 10

4 x Execl Throughput  1 2 3

4 x File Copy 1024 bufsize 2000 maxblocks  1 2 3

4 x File Copy 256 bufsize 500 maxblocks  1 2 3

4 x File Copy 4096 bufsize 8000 maxblocks  1 2 3

4 x Pipe Throughput  1 2 3 4 5 6 7 8 9 10

4 x Pipe-based Context Switching  1 2 3 4 5 6 7 8 9 10

4 x Process Creation  1 2 3

4 x System Call Overhead  1 2 3 4 5 6 7 8 9 10

4 x Shell Scripts (1 concurrent)  1 2 3

4 x Shell Scripts (8 concurrent)  1 2 3

========================================================================
   BYTE UNIX Benchmarks (Version 5.1.3)

   System: xxxxxxx: GNU/Linux
   OS: GNU/Linux -- 2.6.32-042stab062.2 -- #1 SMP Tue Oct 23 16:24:09 MSK 2012
   Machine: i686 (unknown)
   Language: en_US.utf8 (charmap="ANSI_X3.4-1968", collate="ANSI_X3.4-1968")
   CPU 0: Intel(R) Xeon(R) CPU E31230 @ 3.20GHz (6385.0 bogomips)
          Hyper-Threading, x86-64, MMX, Physical Address Ext, SYSENTER/SYSEXIT, SYSCALL/SYSRET, Intel virtualization
   CPU 1: Intel(R) Xeon(R) CPU E31230 @ 3.20GHz (6385.0 bogomips)
          Hyper-Threading, x86-64, MMX, Physical Address Ext, SYSENTER/SYSEXIT, SYSCALL/SYSRET, Intel virtualization
   CPU 2: Intel(R) Xeon(R) CPU E31230 @ 3.20GHz (6385.0 bogomips)
          Hyper-Threading, x86-64, MMX, Physical Address Ext, SYSENTER/SYSEXIT, SYSCALL/SYSRET, Intel virtualization
   CPU 3: Intel(R) Xeon(R) CPU E31230 @ 3.20GHz (6385.0 bogomips)
          Hyper-Threading, x86-64, MMX, Physical Address Ext, SYSENTER/SYSEXIT, SYSCALL/SYSRET, Intel virtualization
   07:03:41 up 51 days, 17:24,  1 user,  load average: 0.00, 0.00, 0.00; runlevel 2

------------------------------------------------------------------------
Benchmark Run: Tue Dec 11 2012 07:03:41 - 07:31:49
4 CPUs in system; running 1 parallel copy of tests

Dhrystone 2 using register variables       19818089.4 lps   (10.0 s, 7 samples)
Double-Precision Whetstone                     3158.8 MWIPS (10.1 s, 7 samples)
Execl Throughput                               4991.7 lps   (30.0 s, 2 samples)
File Copy 1024 bufsize 2000 maxblocks        707728.6 KBps  (30.0 s, 2 samples)
File Copy 256 bufsize 500 maxblocks          186065.0 KBps  (30.0 s, 2 samples)
File Copy 4096 bufsize 8000 maxblocks       1811939.6 KBps  (30.0 s, 2 samples)
Pipe Throughput                             1112829.3 lps   (10.0 s, 7 samples)
Pipe-based Context Switching                 181369.7 lps   (10.0 s, 7 samples)
Process Creation                              16015.2 lps   (30.0 s, 2 samples)
Shell Scripts (1 concurrent)                   8519.2 lpm   (60.0 s, 2 samples)
Shell Scripts (8 concurrent)                   2700.6 lpm   (60.0 s, 2 samples)
System Call Overhead                         837042.8 lps   (10.0 s, 7 samples)

System Benchmarks Index Values               BASELINE       RESULT    INDEX
Dhrystone 2 using register variables         116700.0   19818089.4   1698.2
Double-Precision Whetstone                       55.0       3158.8    574.3
Execl Throughput                                 43.0       4991.7   1160.9
File Copy 1024 bufsize 2000 maxblocks          3960.0     707728.6   1787.2
File Copy 256 bufsize 500 maxblocks            1655.0     186065.0   1124.3
File Copy 4096 bufsize 8000 maxblocks          5800.0    1811939.6   3124.0
Pipe Throughput                               12440.0    1112829.3    894.6
Pipe-based Context Switching                   4000.0     181369.7    453.4
Process Creation                                126.0      16015.2   1271.1
Shell Scripts (1 concurrent)                     42.4       8519.2   2009.2
Shell Scripts (8 concurrent)                      6.0       2700.6   4501.0
System Call Overhead                          15000.0     837042.8    558.0
                                                                   ========
System Benchmarks Index Score                                        1275.2

------------------------------------------------------------------------
Benchmark Run: Tue Dec 11 2012 07:31:49 - 08:00:02
4 CPUs in system; running 4 parallel copies of tests

Dhrystone 2 using register variables       67903086.9 lps   (10.0 s, 7 samples)
Double-Precision Whetstone                    12044.0 MWIPS (10.0 s, 7 samples)
Execl Throughput                              21873.3 lps   (30.0 s, 2 samples)
File Copy 1024 bufsize 2000 maxblocks       1106173.1 KBps  (30.0 s, 2 samples)
File Copy 256 bufsize 500 maxblocks          284521.3 KBps  (30.0 s, 2 samples)
File Copy 4096 bufsize 8000 maxblocks       3282475.4 KBps  (30.0 s, 2 samples)
Pipe Throughput                             3943338.1 lps   (10.0 s, 7 samples)
Pipe-based Context Switching                 849711.7 lps   (10.0 s, 7 samples)
Process Creation                              50006.1 lps   (30.0 s, 2 samples)
Shell Scripts (1 concurrent)                  24474.4 lpm   (60.0 s, 2 samples)
Shell Scripts (8 concurrent)                   3244.9 lpm   (60.0 s, 2 samples)
System Call Overhead                        2877667.5 lps   (10.0 s, 7 samples)

System Benchmarks Index Values               BASELINE       RESULT    INDEX
Dhrystone 2 using register variables         116700.0   67903086.9   5818.6
Double-Precision Whetstone                       55.0      12044.0   2189.8
Execl Throughput                                 43.0      21873.3   5086.8
File Copy 1024 bufsize 2000 maxblocks          3960.0    1106173.1   2793.4
File Copy 256 bufsize 500 maxblocks            1655.0     284521.3   1719.2
File Copy 4096 bufsize 8000 maxblocks          5800.0    3282475.4   5659.4
Pipe Throughput                               12440.0    3943338.1   3169.9
Pipe-based Context Switching                   4000.0     849711.7   2124.3
Process Creation                                126.0      50006.1   3968.7
Shell Scripts (1 concurrent)                     42.4      24474.4   5772.3
Shell Scripts (8 concurrent)                      6.0       3244.9   5408.2
System Call Overhead                          15000.0    2877667.5   1918.4
                                                                   ========
System Benchmarks Index Score                                        3447.6
Testing again showed almost the same results:
   #    #  #    #  #  #    #          #####   ######  #    #   ####   #    #
   #    #  ##   #  #   #  #           #    #  #       ##   #  #    #  #    #
   #    #  # #  #  #    ##            #####   #####   # #  #  #       ######
   #    #  #  # #  #    ##            #    #  #       #  # #  #       #    #
   #    #  #   ##  #   #  #           #    #  #       #   ##  #    #  #    #
    ####   #    #  #  #    #          #####   ######  #    #   ####   #    #

   Version 5.1.3                      Based on the Byte Magazine Unix Benchmark

   Multi-CPU version                  Version 5 revisions by Ian Smith,
                                      Sunnyvale, CA, USA
   January 13, 2011                   johantheghost at yahoo period com


1 x Dhrystone 2 using register variables  1 2 3 4 5 6 7 8 9 10

1 x Double-Precision Whetstone  1 2 3 4 5 6 7 8 9 10

1 x Execl Throughput  1 2 3

1 x File Copy 1024 bufsize 2000 maxblocks  1 2 3

1 x File Copy 256 bufsize 500 maxblocks  1 2 3

1 x File Copy 4096 bufsize 8000 maxblocks  1 2 3

1 x Pipe Throughput  1 2 3 4 5 6 7 8 9 10

1 x Pipe-based Context Switching  1 2 3 4 5 6 7 8 9 10

1 x Process Creation  1 2 3

1 x System Call Overhead  1 2 3 4 5 6 7 8 9 10

1 x Shell Scripts (1 concurrent)  1 2 3

1 x Shell Scripts (8 concurrent)  1 2 3

4 x Dhrystone 2 using register variables  1 2 3 4 5 6 7 8 9 10

4 x Double-Precision Whetstone  1 2 3 4 5 6 7 8 9 10

4 x Execl Throughput  1 2 3

4 x File Copy 1024 bufsize 2000 maxblocks  1 2 3

4 x File Copy 256 bufsize 500 maxblocks  1 2 3

4 x File Copy 4096 bufsize 8000 maxblocks  1 2 3

4 x Pipe Throughput  1 2 3 4 5 6 7 8 9 10

4 x Pipe-based Context Switching  1 2 3 4 5 6 7 8 9 10

4 x Process Creation  1 2 3

4 x System Call Overhead  1 2 3 4 5 6 7 8 9 10

4 x Shell Scripts (1 concurrent)  1 2 3

4 x Shell Scripts (8 concurrent)  1 2 3

========================================================================
   BYTE UNIX Benchmarks (Version 5.1.3)

   System: xxxxxx: GNU/Linux
   OS: GNU/Linux -- 2.6.32-042stab063.2 -- #1 SMP Tue Oct 23 16:24:09 MSK 2012
   Machine: i686 (unknown)
   Language: en_US.utf8 (charmap="ANSI_X3.4-1968", collate="ANSI_X3.4-1968")
   CPU 0: Intel(R) Xeon(R) CPU E31230 @ 3.20GHz (6385.0 bogomips)
          Hyper-Threading, x86-64, MMX, Physical Address Ext, SYSENTER/SYSEXIT, SYSCALL/SYSRET, Intel virtualization
   CPU 1: Intel(R) Xeon(R) CPU E31230 @ 3.20GHz (6385.0 bogomips)
          Hyper-Threading, x86-64, MMX, Physical Address Ext, SYSENTER/SYSEXIT, SYSCALL/SYSRET, Intel virtualization
   CPU 2: Intel(R) Xeon(R) CPU E31230 @ 3.20GHz (6385.0 bogomips)
          Hyper-Threading, x86-64, MMX, Physical Address Ext, SYSENTER/SYSEXIT, SYSCALL/SYSRET, Intel virtualization
   CPU 3: Intel(R) Xeon(R) CPU E31230 @ 3.20GHz (6385.0 bogomips)
          Hyper-Threading, x86-64, MMX, Physical Address Ext, SYSENTER/SYSEXIT, SYSCALL/SYSRET, Intel virtualization
   09:54:40 up  1:49,  1 user,  load average: 0.00, 0.00, 0.00; runlevel 2

------------------------------------------------------------------------
Benchmark Run: Tue Dec 11 2012 09:54:40 - 10:22:48
4 CPUs in system; running 1 parallel copy of tests

Dhrystone 2 using register variables       19836932.6 lps   (10.0 s, 7 samples)
Double-Precision Whetstone                     3159.5 MWIPS (10.0 s, 7 samples)
Execl Throughput                               5028.5 lps   (29.9 s, 2 samples)
File Copy 1024 bufsize 2000 maxblocks        705503.0 KBps  (30.0 s, 2 samples)
File Copy 256 bufsize 500 maxblocks          183605.8 KBps  (30.0 s, 2 samples)
File Copy 4096 bufsize 8000 maxblocks       1813453.0 KBps  (30.0 s, 2 samples)
Pipe Throughput                             1112517.6 lps   (10.0 s, 7 samples)
Pipe-based Context Switching                 186976.0 lps   (10.0 s, 7 samples)
Process Creation                              16375.0 lps   (30.0 s, 2 samples)
Shell Scripts (1 concurrent)                   8542.9 lpm   (60.0 s, 2 samples)
Shell Scripts (8 concurrent)                   2692.2 lpm   (60.0 s, 2 samples)
System Call Overhead                         837146.4 lps   (10.0 s, 7 samples)

System Benchmarks Index Values               BASELINE       RESULT    INDEX
Dhrystone 2 using register variables         116700.0   19836932.6   1699.8
Double-Precision Whetstone                       55.0       3159.5    574.4
Execl Throughput                                 43.0       5028.5   1169.4
File Copy 1024 bufsize 2000 maxblocks          3960.0     705503.0   1781.6
File Copy 256 bufsize 500 maxblocks            1655.0     183605.8   1109.4
File Copy 4096 bufsize 8000 maxblocks          5800.0    1813453.0   3126.6
Pipe Throughput                               12440.0    1112517.6    894.3
Pipe-based Context Switching                   4000.0     186976.0    467.4
Process Creation                                126.0      16375.0   1299.6
Shell Scripts (1 concurrent)                     42.4       8542.9   2014.8
Shell Scripts (8 concurrent)                      6.0       2692.2   4487.0
System Call Overhead                          15000.0     837146.4    558.1
                                                                   ========
System Benchmarks Index Score                                        1280.0

------------------------------------------------------------------------
Benchmark Run: Tue Dec 11 2012 10:22:48 - 10:50:59
4 CPUs in system; running 4 parallel copies of tests

Dhrystone 2 using register variables       67192880.1 lps   (10.0 s, 7 samples)
Double-Precision Whetstone                    12170.2 MWIPS (10.0 s, 7 samples)
Execl Throughput                              21964.9 lps   (29.8 s, 2 samples)
File Copy 1024 bufsize 2000 maxblocks       1017480.8 KBps  (30.0 s, 2 samples)
File Copy 256 bufsize 500 maxblocks          274101.5 KBps  (30.0 s, 2 samples)
File Copy 4096 bufsize 8000 maxblocks       2996868.8 KBps  (30.0 s, 2 samples)
Pipe Throughput                             4008262.4 lps   (10.0 s, 7 samples)
Pipe-based Context Switching                 845607.3 lps   (10.0 s, 7 samples)
Process Creation                              50160.1 lps   (30.0 s, 2 samples)
Shell Scripts (1 concurrent)                  24011.3 lpm   (60.0 s, 2 samples)
Shell Scripts (8 concurrent)                   3216.4 lpm   (60.0 s, 2 samples)
System Call Overhead                        2930780.6 lps   (10.0 s, 7 samples)

System Benchmarks Index Values               BASELINE       RESULT    INDEX
Dhrystone 2 using register variables         116700.0   67192880.1   5757.7
Double-Precision Whetstone                       55.0      12170.2   2212.8
Execl Throughput                                 43.0      21964.9   5108.1
File Copy 1024 bufsize 2000 maxblocks          3960.0    1017480.8   2569.4
File Copy 256 bufsize 500 maxblocks            1655.0     274101.5   1656.2
File Copy 4096 bufsize 8000 maxblocks          5800.0    2996868.8   5167.0
Pipe Throughput                               12440.0    4008262.4   3222.1
Pipe-based Context Switching                   4000.0     845607.3   2114.0
Process Creation                                126.0      50160.1   3981.0
Shell Scripts (1 concurrent)                     42.4      24011.3   5663.0
Shell Scripts (8 concurrent)                      6.0       3216.4   5360.7
System Call Overhead                          15000.0    2930780.6   1953.9
                                                                   ========
System Benchmarks Index Score                                        3389.8
For the Geekbench tests, again it put in a pretty stellar show with close to 10K points:
System Information
  Platform:                  Linux x86 (32-bit)
  Compiler:                  GCC 4.1.2 20070925 (Red Hat 4.1.2-33)
  Operating System:          Linux 2.6.32-042stab063.2 i686
  Model:                     Linux PC (Intel(R) Xeon(R) CPU E31230 @ 3.20GHz)
  Motherboard:               Unknown Motherboard
  Processor:                 Intel(R) Xeon(R) CPU E31230 @ 3.20GHz
  Processor ID:              GenuineIntel Family 6 Model 42 Stepping 7
  Logical Processors:        4
  Physical Processors:       1
  Processor Frequency:       3.19 GHz
  L1 Instruction Cache:      0.00 B
  L1 Data Cache:             0.00 B
  L2 Cache:                  256 KB
  L3 Cache:                  0.00 B
  Bus Frequency:             0.00 Hz
  Memory:                    1.00 GB
  Memory Type:               N/A
  SIMD:                      1
  BIOS:                      N/A
  Processor Model:                     Intel(R) Xeon(R) CPU E31230 @ 3.20GHz
  Processor Cores:           4

Integer
  Blowfish
    single-threaded scalar    2078 ||||||||
    multi-threaded scalar     8824 |||||||||||||||||||||||||||||||||||
  Text Compress
    single-threaded scalar    2821 |||||||||||
    multi-threaded scalar    10907 |||||||||||||||||||||||||||||||||||||||||||
  Text Decompress
    single-threaded scalar    3012 ||||||||||||
    multi-threaded scalar    12134 ||||||||||||||||||||||||||||||||||||||||||||||||
  Image Compress
    single-threaded scalar    2354 |||||||||
    multi-threaded scalar     9229 ||||||||||||||||||||||||||||||||||||
  Image Decompress
    single-threaded scalar    2300 |||||||||
    multi-threaded scalar     9220 ||||||||||||||||||||||||||||||||||||
  Lua
    single-threaded scalar    3962 |||||||||||||||
    multi-threaded scalar    13342 |||||||||||||||||||||||||||||||||||||||||||||||||||||

Floating Point
  Mandelbrot
    single-threaded scalar    2669 ||||||||||
    multi-threaded scalar    10856 |||||||||||||||||||||||||||||||||||||||||||
  Dot Product
    single-threaded scalar    4395 |||||||||||||||||
    multi-threaded scalar    18588 ||||||||||||||||||||||||||||||||||||||||||||||||||||||||||||||||||||||||||
    single-threaded vector    5234 ||||||||||||||||||||
    multi-threaded vector    24029 ||||||||||||||||||||||||||||||||||||||||||||||||||||||||||||||||||||||||||||||||||||||||||||||||
  LU Decomposition
    single-threaded scalar    3364 |||||||||||||
    multi-threaded scalar    13466 |||||||||||||||||||||||||||||||||||||||||||||||||||||
  Primality Test
    single-threaded scalar    4705 ||||||||||||||||||
    multi-threaded scalar    14113 ||||||||||||||||||||||||||||||||||||||||||||||||||||||||
  Sharpen Image
    single-threaded scalar   10679 ||||||||||||||||||||||||||||||||||||||||||
    multi-threaded scalar    42353 |||||||||||||||||||||||||||||||||||||||||||||||||||||||||||||||||||||||||||||||||||||||||||||||||||||||||||||||||||||||||||||||||||||||||||||||||||||||||||||||||||||||||
  Blur Image
    single-threaded scalar    8400 |||||||||||||||||||||||||||||||||
    multi-threaded scalar    28680 ||||||||||||||||||||||||||||||||||||||||||||||||||||||||||||||||||||||||||||||||||||||||||||||||||||||||||||||||||

Memory
  Read Sequential
    single-threaded scalar    7301 |||||||||||||||||||||||||||||
  Write Sequential
    single-threaded scalar   11746 ||||||||||||||||||||||||||||||||||||||||||||||
  Stdlib Allocate
    single-threaded scalar    5025 ||||||||||||||||||||
  Stdlib Write
    single-threaded scalar    8166 ||||||||||||||||||||||||||||||||
  Stdlib Copy
    single-threaded scalar   15184 ||||||||||||||||||||||||||||||||||||||||||||||||||||||||||||

Stream
  Stream Copy
    single-threaded scalar    6026 ||||||||||||||||||||||||
    single-threaded vector    7384 |||||||||||||||||||||||||||||
  Stream Scale
    single-threaded scalar    6297 |||||||||||||||||||||||||
    single-threaded vector    6646 ||||||||||||||||||||||||||
  Stream Add
    single-threaded scalar    6200 ||||||||||||||||||||||||
    single-threaded vector    6782 |||||||||||||||||||||||||||
  Stream Triad
    single-threaded scalar    6528 ||||||||||||||||||||||||||
    single-threaded vector    5065 ||||||||||||||||||||

Integer Score:                6681 ||||||||||||||||||||||||||
Floating Point Score:        13680 ||||||||||||||||||||||||||||||||||||||||||||||||||||||
Memory Score:                 9484 |||||||||||||||||||||||||||||||||||||
Stream Score:                 6366 |||||||||||||||||||||||||

Overall Geekbench Score:      9659 ||||||||||||||||||||||||||||||||||||||
Testing again showed almost the same results:
System Information
  Platform:                  Linux x86 (32-bit)
  Compiler:                  GCC 4.1.2 20070925 (Red Hat 4.1.2-33)
  Operating System:          Linux 2.6.32-042stab063.2 i686
  Model:                     Linux PC (Intel(R) Xeon(R) CPU E31230 @ 3.20GHz)
  Motherboard:               Unknown Motherboard
  Processor:                 Intel(R) Xeon(R) CPU E31230 @ 3.20GHz
  Processor ID:              GenuineIntel Family 6 Model 42 Stepping 7
  Logical Processors:        4
  Physical Processors:       1
  Processor Frequency:       3.19 GHz
  L1 Instruction Cache:      0.00 B
  L1 Data Cache:             0.00 B
  L2 Cache:                  256 KB
  L3 Cache:                  0.00 B
  Bus Frequency:             0.00 Hz
  Memory:                    1.00 GB
  Memory Type:               N/A
  SIMD:                      1
  BIOS:                      N/A
  Processor Model:                     Intel(R) Xeon(R) CPU E31230 @ 3.20GHz
  Processor Cores:           4

Integer
  Blowfish
    single-threaded scalar    2078 ||||||||
    multi-threaded scalar     8907 |||||||||||||||||||||||||||||||||||
  Text Compress
    single-threaded scalar    2824 |||||||||||
    multi-threaded scalar    10948 |||||||||||||||||||||||||||||||||||||||||||
  Text Decompress
    single-threaded scalar    3014 ||||||||||||
    multi-threaded scalar    12415 |||||||||||||||||||||||||||||||||||||||||||||||||
  Image Compress
    single-threaded scalar    2354 |||||||||
    multi-threaded scalar     9261 |||||||||||||||||||||||||||||||||||||
  Image Decompress
    single-threaded scalar    2300 |||||||||
    multi-threaded scalar     7326 |||||||||||||||||||||||||||||
  Lua
    single-threaded scalar    3962 |||||||||||||||
    multi-threaded scalar    13175 ||||||||||||||||||||||||||||||||||||||||||||||||||||

Floating Point
  Mandelbrot
    single-threaded scalar    2670 ||||||||||
    multi-threaded scalar    10856 |||||||||||||||||||||||||||||||||||||||||||
  Dot Product
    single-threaded scalar    4394 |||||||||||||||||
    multi-threaded scalar    18637 ||||||||||||||||||||||||||||||||||||||||||||||||||||||||||||||||||||||||||
    single-threaded vector    5242 ||||||||||||||||||||
    multi-threaded vector    24045 ||||||||||||||||||||||||||||||||||||||||||||||||||||||||||||||||||||||||||||||||||||||||||||||||
  LU Decomposition
    single-threaded scalar    3347 |||||||||||||
    multi-threaded scalar     8008 ||||||||||||||||||||||||||||||||
  Primality Test
    single-threaded scalar    4700 ||||||||||||||||||
    multi-threaded scalar    14511 ||||||||||||||||||||||||||||||||||||||||||||||||||||||||||
  Sharpen Image
    single-threaded scalar   10695 ||||||||||||||||||||||||||||||||||||||||||
    multi-threaded scalar    42166 ||||||||||||||||||||||||||||||||||||||||||||||||||||||||||||||||||||||||||||||||||||||||||||||||||||||||||||||||||||||||||||||||||||||||||||||||||||||||||||||||||||||||
  Blur Image
    single-threaded scalar    8411 |||||||||||||||||||||||||||||||||
    multi-threaded scalar    33555 ||||||||||||||||||||||||||||||||||||||||||||||||||||||||||||||||||||||||||||||||||||||||||||||||||||||||||||||||||||||||||||||||||||||

Memory
  Read Sequential
    single-threaded scalar    7274 |||||||||||||||||||||||||||||
  Write Sequential
    single-threaded scalar   11506 ||||||||||||||||||||||||||||||||||||||||||||||
  Stdlib Allocate
    single-threaded scalar    5055 ||||||||||||||||||||
  Stdlib Write
    single-threaded scalar    7593 ||||||||||||||||||||||||||||||
  Stdlib Copy
    single-threaded scalar   16584 ||||||||||||||||||||||||||||||||||||||||||||||||||||||||||||||||||

Stream
  Stream Copy
    single-threaded scalar    6196 ||||||||||||||||||||||||
    single-threaded vector    7483 |||||||||||||||||||||||||||||
  Stream Scale
    single-threaded scalar    6528 ||||||||||||||||||||||||||
    single-threaded vector    7441 |||||||||||||||||||||||||||||
  Stream Add
    single-threaded scalar    6118 ||||||||||||||||||||||||
    single-threaded vector    6866 |||||||||||||||||||||||||||
  Stream Triad
    single-threaded scalar    6741 ||||||||||||||||||||||||||
    single-threaded vector    5098 ||||||||||||||||||||

Integer Score:                6547 ||||||||||||||||||||||||||
Floating Point Score:        13659 ||||||||||||||||||||||||||||||||||||||||||||||||||||||
Memory Score:                 9602 ||||||||||||||||||||||||||||||||||||||
Stream Score:                 6558 ||||||||||||||||||||||||||

Overall Geekbench Score:      9648 ||||||||||||||||||||||||||||||||||||||
Customer Service and Support
I always think there are two things distinguished a great provider from a not-so-great one, one is stability and the other one is support. Having a friendly (but yet professional), and most importantly, speedy support is what I would value highly of a VPS provider. I am glad that in this case, NinjaHawk has been doing a pretty good job in it. I have submitted a technical support request at 10:13AM on a Sunday morning and it was answered by 10:25AM, which is not bad at all.
Conclusion
Ninjahawk may not offer the most amazing price that I have seen among low end VPS providers (particularly at a time when providers have started to offer 4GB RAM VPS for less than 7 USD per month), and initially I was a little thrown off by the price tag, even after the huge discount. However, the service says it all, the network speed is pretty good, disk I/O, even not the greatest, is pretty good as well. Although several improvements can be made (such as fixing the hostname changes in WHCMS panel), it is nonetheless a pretty good VPS provider that I would recommend.
I believe NinjaHawk is a decent provider that I would trust to host my needs. I just worry that branding with humor is not generally palatable with corporate people.
@jcaleb: indeed the name is a bit geared towards the cartoonic side, so is the logo, but I guess that way they managed to attract the younger clientele (which could be a good thing or bad).
Thank you very much for the kind words 96mb and Jcaleb.
To answer your inquiry about our brand name, these terms “Hawk” and “Ninja” goes really hosting business and I believe both of you can tell that :). Our motto was to do something little bit different than other provider an bring in a fresh non corporate personal feeling with our service and this is where our wording and our brand image helps us.
While I am personally not proud of our 100mb/s+ throughput results, I can assure you that these are constant and that is the lowest I have seen on our full node (You can verify my claim through serverbear http://serverbear.com/9788/ninjahawk) and that is expected from non cached 4disk raid 10 arrays. There are always room for improvements and we are constantly improving. Our newest nodes will feature a bigger raid 10 array of 8-12 drives.
Feel free to ask me any question here and I will do my level best to answer them.
Once again, thank you very much for your honest feedback, it really helps when you pinpoint our negative and positive sides. It really helps us to set our target higher 🙂
Pingback: NinjaHawk – $7/Month – 1024MB OpenVZ VPS in Dallas – Low End Box
Pingback: NinjaHawk – $7/Month – 1024MB OpenVZ VPS in Dallas | LEB OFFER's
Pingback: NinjaHawk – > NYC OVZ + Phoenix KVM + Free service credit + Double resource and much more! | 低价盒子(lowendbox中国)
Pingback: {VPS UK/USA} NYC/Arizona/Dallas/Kent-10$ CPANEL-FREE SSL-FREE UPGRADE-From $6.50/mo | Host Offers Only
Pingback: SSD Cached 25GB / 512MB RAM/ $6.50/mo / Free SSL / 99.9% Uptime S.L.A.- Ninja Hawk | Discover Cheap VPS in US!