
96MB Low End VPS Review Part 63–Semoweb
Happy New Year everyone! Hope everyone has had a good break, had spent some time with your family and friends and had a pretty good break! And to me, I have been spending days taking a mini-vacation and spend some time to think and plan for the next year, and one of the items that I have had for my 2013 To-Do list is definitely to keep 96MB going so that readers like you would be benefited from the VPS review that I have been writing!
Most of the time I do a review either because the VPS business has put in a review request or if I happened to be in need of a VPS myself. However, in some occasion, the review request comes from customers who are either happy with the service and would like more people to know about the provider they are using, or they feel the provider has some rooms for improvement that they would like to bring into the provider’s attention. The VPS provider that I am reviewing today, Semoweb, is a provider that was brought to my attention by one of the 96MB readers, and let’s take a look, as objective as I can (after all, that is why you guys are reading 96MB right?), on the quality of service offered by Semoweb.
Note: Semoweb does not seem to offer the plan I signed up for testing any longer and their current plan on the offer on WHT seems to be more expensive with more disk space but less RAM. However, I feel this review is still relevant since it offers the reader a peek of the overall service, regardless of the plan resources specifications.
Basic Information and Set Up
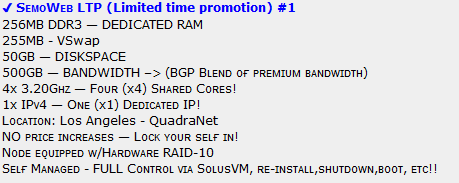
According to the advertisement on LowEndTalk, here is what you would get for 3USD per month.

Their sign-up page is on HTTPs protocol and some quite standard options are available (please note that this screenshot is not for the exact product indicated as it is no longer sold on their website):
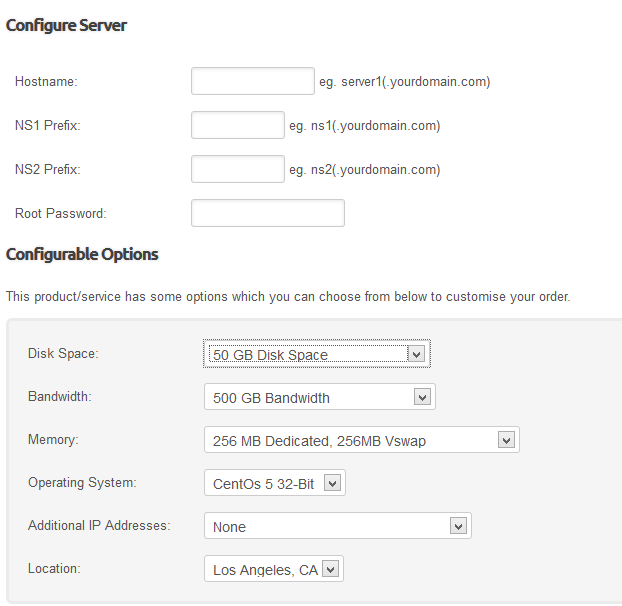
Although Semoweb advertise instant set up, in my particular case at least, the provision was not instant (possibly fraud check?) and my payment confirmation arrived at 7:22pm, after putting in a ticket at 8:57pm (yes, I am aware that I was a bit impatient and 24 hours is normally how long I should be waiting), I have received an update at 10:04pm informing me the ticket is sent to the “supervisor”, and no update afterwards until I sent another reply at 3:23pm the next day asking for an update from the supervisor and finally received the VPS New Information email at 8:56pm (slightly over 24 hours after I have submitted my payments) and a reply at 10:56pm the next day informing me the VPS has been set up and all good to go.
The WHMCS system on Semoweb is on HTTPS interface, and once logged in, the details of the service is listed under My Product:
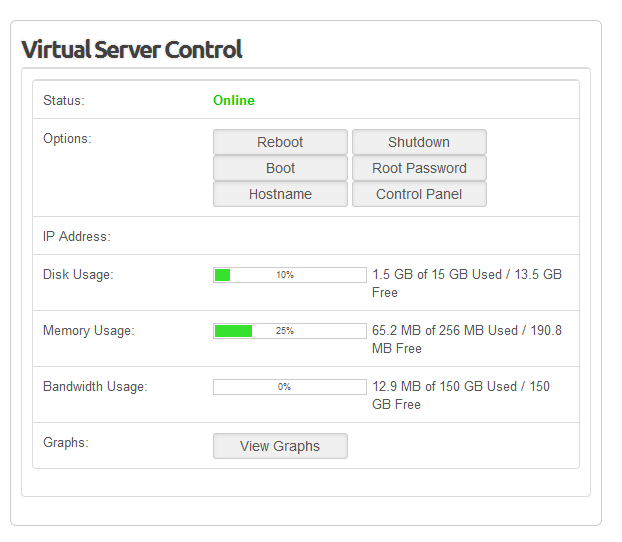
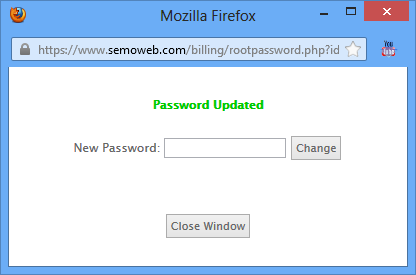
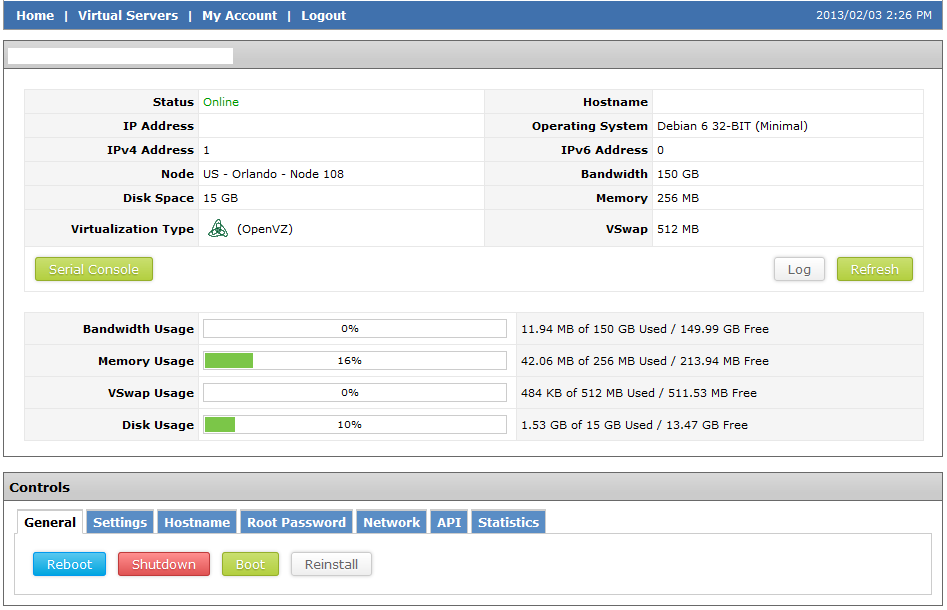
As you can see, the layout is pretty standard however not all button seems to work. When I tried to click on the Update Root Password option, the operation seems to work and I can verify the new root password was indeed in use:
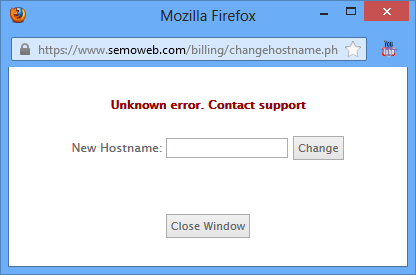
However, when I tried to change the hostname, I did not have such kind of luck:
None of the graph is available unfortunately are available:

Interestingly, their SolusVM interface only provide an IP address but no domain name, which is normally what happens when the provider is reselling the service. Turns out in this particular case, Semoweb is a reseller for Hostdime as the rDNS of the IP is pointing to: dimer.hostdimer.com.
The SolusVM address given by the Welcome email is using HTTP interface only, although if you do not mind getting a certificate error, you can visit the secured HTTPS site by adding 5656 as the port. Once logged in, a standard SolusVM interface is shown:
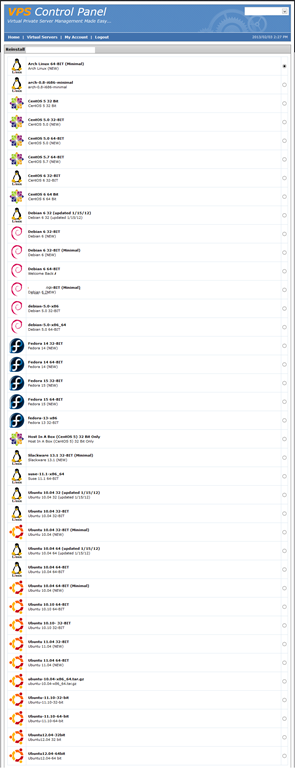
There are quite a few OS templates available for reinstallation, in particular, a vast selection of Ubuntu distributions are available:
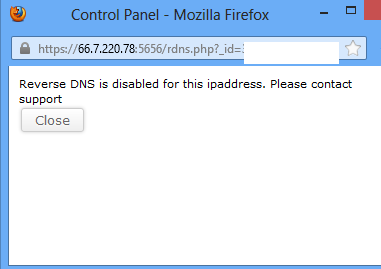
Since Semoweb is a reseller, I was not surprised when there is no instant rDNS available:
Although you have the ability to enable TUN/TAP and PPP on the interface:
Test on the VPS
As mentioned above, the test VPS I have purchased has 256MB of dedicated RAM, 768MB of burstable RAM, 15GB of hard drive space and 150GB of bandwidth, the VPS is located at Orlando, Florida and Semoweb is reselling the service from HostDime. For the tests carried out below, I have used Debian 6 32 bit minimal as the OS template.
When the OS template was initially loaded, only 5MB of RAM was used, leading me to believe the template is indeed “minimal”:
 free -m
             total       used       free     shared    buffers     cached
Mem:           256         15        240          0          0         10
-/+ buffers/cache:          5        250
Swap:          512          0        512
Top showing the processes running:
top - 02:23:41 up 1 day,  2:47,  1 user,  load average: 0.00, 0.00, 0.00
Tasks:  11 total,   1 running,  10 sleeping,   0 stopped,   0 zombie
Cpu(s):  0.0%us,  0.0%sy,  0.0%ni,100.0%id,  0.0%wa,  0.0%hi,  0.0%si,  0.0%st
Mem:    262144k total,    17400k used,   244744k free,        0k buffers
Swap:   524288k total,        0k used,   524288k free,    10564k cached

  PID USER      PR  NI  VIRT  RES  SHR S %CPU %MEM    TIME+  COMMAND
 9705 root      20   0  8252 2844 2324 S    0  1.1   0:00.04 sshd
 9960 root      20   0  7036 2636 2136 S    0  1.0   0:00.00 sshd
 9733 root      20   0  2976 1644 1304 S    0  0.6   0:00.00 bash
  296 root      20   0 34464 1440 1040 S    0  0.5   0:00.96 rsyslogd
 9961 sshd      20   0  6832 1332  872 S    0  0.5   0:00.00 sshd
 9962 root      20   0  2328 1060  876 R    0  0.4   0:00.00 top
  335 root      20   0  5488  972  584 S    0  0.4   0:00.94 sshd
  337 root      20   0  2288  764  600 S    0  0.3   0:00.05 cron
    1 root      20   0  2028  680  588 S    0  0.3   0:00.78 init
    2 root      20   0     0    0    0 S    0  0.0   0:00.00 kthreadd/6454
    3 root      20   0     0    0    0 S    0  0.0   0:00.00 khelper/6454
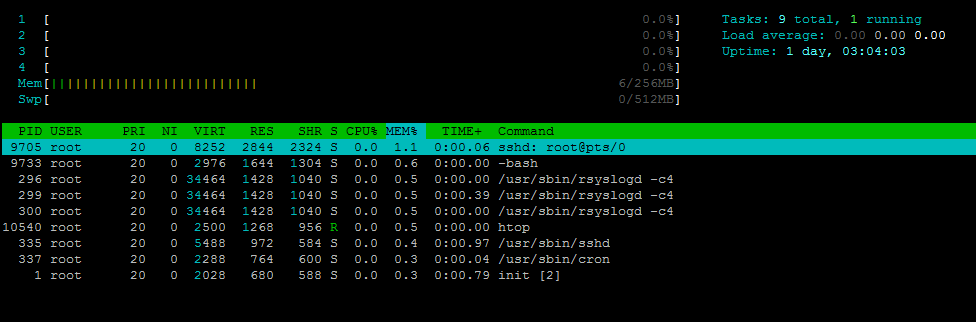
And htop output:
About 170MB of hard drive space was used when the OS was initially loaded, which is also a good sign that this OS template has been stripped off many of the unnecessary items:
 df -h
Filesystem            Size  Used Avail Use% Mounted on
/dev/simfs             15G  170M   15G   2% /
tmpfs                 128M     0  128M   0% /lib/init/rw
tmpfs                 128M     0  128M   0% /dev/shm
And the iNodes are set to pretty standard values:
df -i
Filesystem            Inodes   IUsed   IFree IUse% Mounted on
/dev/simfs           7864320   10500 7853820    1% /
tmpfs                  32768       4   32764    1% /lib/init/rw
tmpfs                  32768       1   32767    1% /dev/shm
When the full LNMP stack was loaded, 42MB of RAM was used:
free -m
             total       used       free     shared    buffers     cached
Mem:           256         72        183          0          0         29
-/+ buffers/cache:         42        213
Swap:          512          0        511
This is again much smaller compare to most of the VPS that I have tested before.
Top showing the full LNMP stack running:
top - 04:37:12 up 56 days, 12:37,  1 user,  load average: 0.00, 0.00, 0.00
Tasks:  19 total,   1 running,  18 sleeping,   0 stopped,   0 zombie
Cpu(s):  0.0%us,  0.0%sy,  0.0%ni,100.0%id,  0.0%wa,  0.0%hi,  0.0%si,  0.0%st
Mem:    262144k total,    74040k used,   188104k free,        0k buffers
Swap:   524288k total,      484k used,   523804k free,    30768k cached

  PID USER      PR  NI  VIRT  RES  SHR S %CPU %MEM    TIME+  COMMAND
  517 www       20   0 15012  11m  568 S    0  4.3   0:00.08 nginx
  521 www       20   0 26732 7724 2152 S    0  2.9   0:00.06 php-cgi
  522 www       20   0 26204 7200 2152 S    0  2.7   0:00.05 php-cgi
  523 www       20   0 26204 7200 2152 S    0  2.7   0:00.04 php-cgi
  520 www       20   0 26204 7156 2108 S    0  2.7   0:00.05 php-cgi
  519 www       20   0 26732 5580    4 S    0  2.1   0:00.05 php-cgi
  485 mysql     20   0 36484 3448  780 S    0  1.3   0:01.57 mysqld
  518 root      20   0 22624 3192   52 S    0  1.2  11:34.79 php-cgi
11132 root      20   0  8456 2948 2328 S    0  1.1   0:00.17 sshd
11135 root      20   0  2976 1632 1292 S    0  0.6   0:00.00 bash
11162 root      20   0  2328 1080  884 R    0  0.4   0:00.00 top
  320 root      20   0 34464  916  588 S    0  0.3   0:18.09 rsyslogd
  486 root      20   0  5488  600  216 S    0  0.2   0:16.41 sshd
  516 root      20   0  4784  444    0 S    0  0.2   0:00.00 nginx
  442 root      20   0  2288  280  112 S    0  0.1   0:02.78 cron
    1 root      20   0  2028   92   64 S    0  0.0   0:31.78 init
  335 root      20   0  1744   92    4 S    0  0.0   0:00.00 mysqld_safe
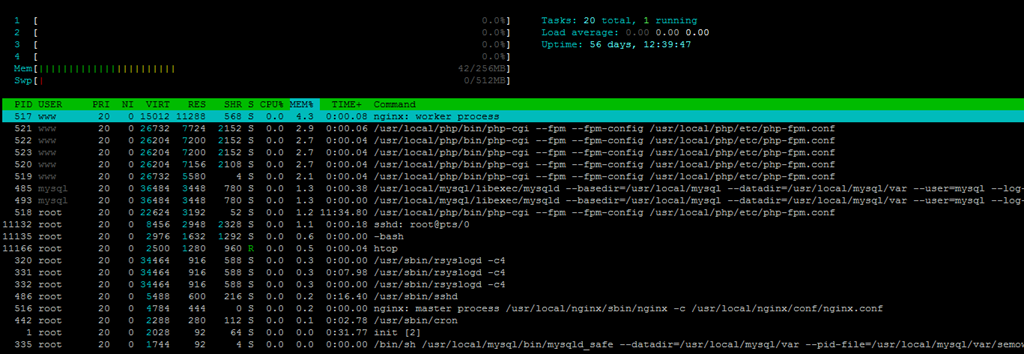
And htop output:
About 1.6GB of hard drive space was used once the intallation is done:
df -h
Filesystem            Size  Used Avail Use% Mounted on
/dev/simfs             15G  1.6G   14G  11% /
tmpfs                 128M     0  128M   0% /lib/init/rw
tmpfs                 128M     0  128M   0% /dev/shm
And the inodes output is pretty standard as well:
 df -i
Filesystem            Inodes   IUsed   IFree IUse% Mounted on
/dev/simfs           7864320   63529 7800791    1% /
tmpfs                  32768       4   32764    1% /lib/init/rw
tmpfs                  32768       1   32767    1% /dev/shm
The VPS is fairly stable and little used, as shown in the output of uptime:
 uptime
 04:43:01 up 56 days, 12:43,  1 user,  load average: 0.00, 0.00, 0.00
vmstat shows no IOwait as well, which is also a good sign:
vmstat
procs -----------memory---------- ---swap-- -----io---- -system-- ----cpu----
 r  b   swpd   free   buff  cache   si   so    bi    bo   in   cs us sy id wa
 0  0    484 187916      0  30952    0    0     0     0    0    0  0  0 100  0
Beancounters are set to pretty high values and there is no failure count, which is something good:
 cat /proc/user_beancounters
Version: 2.5
       uid  resource                     held              maxheld              barrier                limit              failcnt
     6454:  kmemsize                  6850981             77090816            134217728            134217728                    0
            lockedpages                     0                    0                32768                32768                    0
            privvmpages                 26970               123023  9223372036854775807  9223372036854775807                    0
            shmpages                      642                 2354  9223372036854775807  9223372036854775807                    0
            dummy                           0                    0                    0                    0                    0
            numproc                        22                  135  9223372036854775807  9223372036854775807                    0
            physpages                   18552                42193                    0                65536                    0
            vmguarpages                     0                    0  9223372036854775807  9223372036854775807                    0
            oomguarpages                 9242                10813  9223372036854775807  9223372036854775807                    0
            numtcpsock                      5                   27  9223372036854775807  9223372036854775807                    0
            numflock                        1                    3  9223372036854775807  9223372036854775807                    0
            numpty                          1                    6  9223372036854775807  9223372036854775807                    0
            numsiginfo                      0                   27  9223372036854775807  9223372036854775807                    0
            tcpsndbuf                  102592               470880  9223372036854775807  9223372036854775807                    0
            tcprcvbuf                   81920               442368  9223372036854775807  9223372036854775807                    0
            othersockbuf                 6936                41784  9223372036854775807  9223372036854775807                    0
            dgramrcvbuf                     0                 4624  9223372036854775807  9223372036854775807                    0
            numothersock                   36                   57  9223372036854775807  9223372036854775807                    0
            dcachesize                4288699             67108858             67108864             67108864                    0
            numfile                       267                  710  9223372036854775807  9223372036854775807                    0
            dummy                           0                    0                    0                    0                    0
            dummy                           0                    0                    0                    0                    0
            dummy                           0                    0                    0                    0                    0
            numiptent                      24                   24  9223372036854775807  9223372036854775807                    0
Since the beancounter values are pretty strange, the vzfree output does not make a lot of sense to me as well:
vzfree
             Total     Used     Free
Kernel:    128.00M    6.50M  121.50M
Allocate: 36028797018963968.00M  105.36M 36028797018963864.00M (36028797018963967M Guaranteed)
Commit:   36028797018963968.00M   42.65M 36028797018963924.00M (34.3% of Allocated)
Swap:              -203.50M          (-563.0% of Committed)
CPUInfo shows there are four CPU cores available and none of them are throttled:
cat /proc/cpuinfo
processor       : 0
vendor_id       : GenuineIntel
cpu family      : 6
model           : 42
model name      : Intel(R) Xeon(R) CPU E31230 @ 3.20GHz
stepping        : 7
cpu MHz         : 3192.861
cache size      : 8192 KB
physical id     : 0
siblings        : 8
core id         : 0
cpu cores       : 4
apicid          : 0
initial apicid  : 0
fpu             : yes
fpu_exception   : yes
cpuid level     : 13
wp              : yes
flags           : fpu vme de pse tsc msr pae mce cx8 apic mtrr pge mca cmov pat pse36 clflush dts acpi mmx fxsr sse sse2 ss ht tm pbe syscall nx rdtscp lm constant_tsc arch_perfmon pebs bts rep_good xtopology nonstop_tsc aperfmperf pni pclmulqdq dtes64 monitor ds_cpl vmx smx est tm2 ssse3 cx16 xtpr pdcm sse4_1 sse4_2 x2apic popcnt xsave avx lahf_lm ida arat epb xsaveopt pln pts dts tpr_shadow vnmi flexpriority ept vpid
bogomips        : 6385.72
clflush size    : 64
cache_alignment : 64
address sizes   : 36 bits physical, 48 bits virtual
power management:

processor       : 1
vendor_id       : GenuineIntel
cpu family      : 6
model           : 42
model name      : Intel(R) Xeon(R) CPU E31230 @ 3.20GHz
stepping        : 7
cpu MHz         : 3192.861
cache size      : 8192 KB
physical id     : 0
siblings        : 8
core id         : 1
cpu cores       : 4
apicid          : 2
initial apicid  : 2
fpu             : yes
fpu_exception   : yes
cpuid level     : 13
wp              : yes
flags           : fpu vme de pse tsc msr pae mce cx8 apic mtrr pge mca cmov pat pse36 clflush dts acpi mmx fxsr sse sse2 ss ht tm pbe syscall nx rdtscp lm constant_tsc arch_perfmon pebs bts rep_good xtopology nonstop_tsc aperfmperf pni pclmulqdq dtes64 monitor ds_cpl vmx smx est tm2 ssse3 cx16 xtpr pdcm sse4_1 sse4_2 x2apic popcnt xsave avx lahf_lm ida arat epb xsaveopt pln pts dts tpr_shadow vnmi flexpriority ept vpid
bogomips        : 6385.72
clflush size    : 64
cache_alignment : 64
address sizes   : 36 bits physical, 48 bits virtual
power management:

processor       : 2
vendor_id       : GenuineIntel
cpu family      : 6
model           : 42
model name      : Intel(R) Xeon(R) CPU E31230 @ 3.20GHz
stepping        : 7
cpu MHz         : 3192.861
cache size      : 8192 KB
physical id     : 0
siblings        : 8
core id         : 2
cpu cores       : 4
apicid          : 4
initial apicid  : 4
fpu             : yes
fpu_exception   : yes
cpuid level     : 13
wp              : yes
flags           : fpu vme de pse tsc msr pae mce cx8 apic mtrr pge mca cmov pat pse36 clflush dts acpi mmx fxsr sse sse2 ss ht tm pbe syscall nx rdtscp lm constant_tsc arch_perfmon pebs bts rep_good xtopology nonstop_tsc aperfmperf pni pclmulqdq dtes64 monitor ds_cpl vmx smx est tm2 ssse3 cx16 xtpr pdcm sse4_1 sse4_2 x2apic popcnt xsave avx lahf_lm ida arat epb xsaveopt pln pts dts tpr_shadow vnmi flexpriority ept vpid
bogomips        : 6385.72
clflush size    : 64
cache_alignment : 64
address sizes   : 36 bits physical, 48 bits virtual
power management:

processor       : 3
vendor_id       : GenuineIntel
cpu family      : 6
model           : 42
model name      : Intel(R) Xeon(R) CPU E31230 @ 3.20GHz
stepping        : 7
cpu MHz         : 3192.861
cache size      : 8192 KB
physical id     : 0
siblings        : 8
core id         : 3
cpu cores       : 4
apicid          : 6
initial apicid  : 6
fpu             : yes
fpu_exception   : yes
cpuid level     : 13
wp              : yes
flags           : fpu vme de pse tsc msr pae mce cx8 apic mtrr pge mca cmov pat pse36 clflush dts acpi mmx fxsr sse sse2 ss ht tm pbe syscall nx rdtscp lm constant_tsc arch_perfmon pebs bts rep_good xtopology nonstop_tsc aperfmperf pni pclmulqdq dtes64 monitor ds_cpl vmx smx est tm2 ssse3 cx16 xtpr pdcm sse4_1 sse4_2 x2apic popcnt xsave avx lahf_lm ida arat epb xsaveopt pln pts dts tpr_shadow vnmi flexpriority ept vpid
bogomips        : 6385.72
clflush size    : 64
cache_alignment : 64
address sizes   : 36 bits physical, 48 bits virtual
power management:
Meminfo:
 cat /proc/meminfo
MemTotal:         262144 kB
MemFree:           30652 kB
Cached:           206848 kB
Active:            45092 kB
Inactive:         179708 kB
Active(anon):      16128 kB
Inactive(anon):     1824 kB
Active(file):      28964 kB
Inactive(file):   177884 kB
Unevictable:           0 kB
Mlocked:               0 kB
SwapTotal:        524288 kB
SwapFree:         505148 kB
Dirty:                 0 kB
Writeback:             0 kB
AnonPages:         17952 kB
Shmem:              2568 kB
Slab:               6632 kB
SReclaimable:       4128 kB
SUnreclaim:         2504 kB
And time sync:
time sync

real    0m0.001s
user    0m0.001s
sys     0m0.000s
I was a bit surprised with the disk I/O speed especially considering the fact that this is not a SSD VPS but just HDDs with RAID10:
 dd if=/dev/zero of=test bs=64k count=16k conv=fdatasync
16384+0 records in
16384+0 records out
1073741824 bytes (1.1 GB) copied, 1.13514 s, 946 MB/s
Testing again showed almost the same result:
 dd if=/dev/zero of=test bs=64k count=16k conv=fdatasync
16384+0 records in
16384+0 records out
1073741824 bytes (1.1 GB) copied, 1.09108 s, 984 MB/s
And just to make sure I was reading the right numbers, I have once again run a test a while later to make sure, and although this time is slightly worse than before, the numbers are still very impressive:
 dd if=/dev/zero of=test bs=64k count=16k conv=fdatasync
16384+0 records in
16384+0 records out
1073741824 bytes (1.1 GB) copied, 1.30296 s, 824 MB/s
The ioping results are very consistent as well:
ioping -c 10 .
4096 bytes from . (simfs /vz/private/6454): request=1 time=0.1 ms
4096 bytes from . (simfs /vz/private/6454): request=2 time=0.1 ms
4096 bytes from . (simfs /vz/private/6454): request=3 time=0.1 ms
4096 bytes from . (simfs /vz/private/6454): request=4 time=0.1 ms
4096 bytes from . (simfs /vz/private/6454): request=5 time=0.1 ms
4096 bytes from . (simfs /vz/private/6454): request=6 time=0.1 ms
4096 bytes from . (simfs /vz/private/6454): request=7 time=0.1 ms
4096 bytes from . (simfs /vz/private/6454): request=8 time=0.1 ms
4096 bytes from . (simfs /vz/private/6454): request=9 time=0.1 ms
4096 bytes from . (simfs /vz/private/6454): request=10 time=0.1 ms

--- . (simfs /vz/private/6454) ioping statistics ---
10 requests completed in 9002.2 ms, 9183 iops, 35.9 mb/s
min/avg/max/mdev = 0.1/0.1/0.1/0.0 ms
Testing again showed similar results:
 ioping -c 10 .
4096 bytes from . (simfs /vz/private/6454): request=1 time=0.1 ms
4096 bytes from . (simfs /vz/private/6454): request=2 time=0.1 ms
4096 bytes from . (simfs /vz/private/6454): request=3 time=0.1 ms
4096 bytes from . (simfs /vz/private/6454): request=4 time=0.1 ms
4096 bytes from . (simfs /vz/private/6454): request=5 time=0.1 ms
4096 bytes from . (simfs /vz/private/6454): request=6 time=0.1 ms
4096 bytes from . (simfs /vz/private/6454): request=7 time=0.1 ms
4096 bytes from . (simfs /vz/private/6454): request=8 time=0.1 ms
4096 bytes from . (simfs /vz/private/6454): request=9 time=0.1 ms
4096 bytes from . (simfs /vz/private/6454): request=10 time=0.1 ms

--- . (simfs /vz/private/6454) ioping statistics ---
10 requests completed in 9002.4 ms, 10406 iops, 40.6 mb/s
min/avg/max/mdev = 0.1/0.1/0.1/0.0 ms
As for the network speed, the download speed is definitely very impressive as well, and during the Cachefly download test, I was almost able to get the full port speed:
wget cachefly.cachefly.net/100mb.test -O /dev/null
--2013-02-04 04:52:25--  http://cachefly.cachefly.net/100mb.test
Resolving cachefly.cachefly.net... 205.234.175.175
Connecting to cachefly.cachefly.net|205.234.175.175|:80... connected.
HTTP request sent, awaiting response... 200 OK
Length: 104857600 (100M) [application/octet-stream]
Saving to: `/dev/null'

100%[=======================================================================================================================================>] 104,857,600 15.6M/s   in 5.8s

2013-02-04 04:52:31 (17.4 MB/s) - `/dev/null' saved [104857600/104857600]
As you can see, this is actually more than 150mbit/s.
Testing a little later showed equally impressive results:
 wget cachefly.cachefly.net/100mb.test -O /dev/null
--2013-02-04 05:03:54--  http://cachefly.cachefly.net/100mb.test
Resolving cachefly.cachefly.net... 205.234.175.175
Connecting to cachefly.cachefly.net|205.234.175.175|:80... connected.
HTTP request sent, awaiting response... 200 OK
Length: 104857600 (100M) [application/octet-stream]
Saving to: `/dev/null'

100%[=======================================================================================================================================>] 104,857,600 22.4M/s   in 4.2s

2013-02-04 05:03:58 (24.0 MB/s) - `/dev/null' saved [104857600/104857600]
And one more time, the result, even though is not as good as the previous results, is nonetheless quite impressive.
wget cachefly.cachefly.net/100mb.test -O /dev/null
--2013-02-04 05:06:15--  http://cachefly.cachefly.net/100mb.test
Resolving cachefly.cachefly.net... 205.234.175.175
Connecting to cachefly.cachefly.net|205.234.175.175|:80... connected.
HTTP request sent, awaiting response... 200 OK
Length: 104857600 (100M) [application/octet-stream]
Saving to: `/dev/null'

100%[=======================================================================================================================================>] 104,857,600 10.7M/s   in 9.5s

2013-02-04 05:06:25 (10.5 MB/s) - `/dev/null' saved [104857600/104857600]
The upload speed, on the other hand, although not very impressive, but is still reasonable. First is the upload test with my Quickweb test VPS at Chicago, IL:
 wget 199.168.xxx.xxx/100mb.test -O /dev/null
--2013-02-03 16:14:12--  http://199.168.xxx.xxx/100mb.test
Connecting to 199.168.xxx.xxx:80... connected.
HTTP request sent, awaiting response... 200 OK
Length: 104857600 (100M) [application/octet-stream]
Saving to: `/dev/null'

100%[======================================>] 104,857,600 2.44M/s   in 42s

2013-02-03 16:14:54 (2.40 MB/s) - `/dev/null' saved [104857600/104857600]
As you can see, the upload speed of the VPS is pretty fast along the east coast. Next is a test VPS from Chicago VPS in their Los Angeles DC, which is along the west coast:
 wget 199.168.xxx.xxx/100mb.test -O /dev/null
--2013-02-04 01:36:21--  http://199.168.xxx.xxx/100mb.test
Connecting to 199.168.xxx.xxx:80... connected.
HTTP request sent, awaiting response... 200 OK
Length: 104857600 (100M) [application/octet-stream]
Saving to: `/dev/null'

100%[======================================>] 104,857,600  804K/s   in 2m 28s

2013-02-04 01:38:49 (694 KB/s) - `/dev/null' saved [104857600/104857600]
As you can see, the speed is considerably slower in this case. Lastly is the test from my test VPS from HTTPSimple at London, UK:
wget 199.168.xxx.xxx/100mb.test -O /dev/null
--2013-02-04 02:16:43--  http://199.168.xxx.xxx/100mb.test
Connecting to 199.168.xxx.xxx:80... connected.
HTTP request sent, awaiting response... 200 OK
Length: 104857600 (100M) [application/octet-stream]
Saving to: `/dev/null'

100%[======================================>] 104,857,600 1.20M/s   in 1m 41s

2013-02-04 02:18:24 (1015 KB/s) - `/dev/null' saved [104857600/104857600]
Finally, the benchmarking is done, and this little VPS has impressed me a lot with the good performance. First the UnixBench test:
   #    #  #    #  #  #    #          #####   ######  #    #   ####   #    #
   #    #  ##   #  #   #  #           #    #  #       ##   #  #    #  #    #
   #    #  # #  #  #    ##            #####   #####   # #  #  #       ######
   #    #  #  # #  #    ##            #    #  #       #  # #  #       #    #
   #    #  #   ##  #   #  #           #    #  #       #   ##  #    #  #    #
    ####   #    #  #  #    #          #####   ######  #    #   ####   #    #

   Version 5.1.3                      Based on the Byte Magazine Unix Benchmark

   Multi-CPU version                  Version 5 revisions by Ian Smith,
                                      Sunnyvale, CA, USA
   January 13, 2011                   johantheghost at yahoo period com


1 x Dhrystone 2 using register variables  1 2 3 4 5 6 7 8 9 10

1 x Double-Precision Whetstone  1 2 3 4 5 6 7 8 9 10

1 x Execl Throughput  1 2 3

1 x File Copy 1024 bufsize 2000 maxblocks  1 2 3

1 x File Copy 256 bufsize 500 maxblocks  1 2 3

1 x File Copy 4096 bufsize 8000 maxblocks  1 2 3

1 x Pipe Throughput  1 2 3 4 5 6 7 8 9 10

1 x Pipe-based Context Switching  1 2 3 4 5 6 7 8 9 10

1 x Process Creation  1 2 3

1 x System Call Overhead  1 2 3 4 5 6 7 8 9 10

1 x Shell Scripts (1 concurrent)  1 2 3

1 x Shell Scripts (8 concurrent)  1 2 3

4 x Dhrystone 2 using register variables  1 2 3 4 5 6 7 8 9 10

4 x Double-Precision Whetstone  1 2 3 4 5 6 7 8 9 10

4 x Execl Throughput  1 2 3

4 x File Copy 1024 bufsize 2000 maxblocks  1 2 3

4 x File Copy 256 bufsize 500 maxblocks  1 2 3

4 x File Copy 4096 bufsize 8000 maxblocks  1 2 3

4 x Pipe Throughput  1 2 3 4 5 6 7 8 9 10

4 x Pipe-based Context Switching  1 2 3 4 5 6 7 8 9 10

4 x Process Creation  1 2 3

4 x System Call Overhead  1 2 3 4 5 6 7 8 9 10

4 x Shell Scripts (1 concurrent)  1 2 3

4 x Shell Scripts (8 concurrent)  1 2 3

========================================================================
   BYTE UNIX Benchmarks (Version 5.1.3)

   System: XXXXXX: GNU/Linux
   OS: GNU/Linux -- 2.6.32-042stab059.7 -- #1 SMP Tue Jul 24 19:12:01 MSK 2012
   Machine: i686 (unknown)
   Language: en_US.utf8 (charmap="UTF-8", collate="UTF-8")
   CPU 0: Intel(R) Xeon(R) CPU E31230 @ 3.20GHz (6385.6 bogomips)
          Hyper-Threading, x86-64, MMX, Physical Address Ext, SYSCALL/SYSRET, Intel virtualization
   CPU 1: Intel(R) Xeon(R) CPU E31230 @ 3.20GHz (6385.6 bogomips)
          Hyper-Threading, x86-64, MMX, Physical Address Ext, SYSCALL/SYSRET, Intel virtualization
   CPU 2: Intel(R) Xeon(R) CPU E31230 @ 3.20GHz (6385.6 bogomips)
          Hyper-Threading, x86-64, MMX, Physical Address Ext, SYSCALL/SYSRET, Intel virtualization
   CPU 3: Intel(R) Xeon(R) CPU E31230 @ 3.20GHz (6385.6 bogomips)
          Hyper-Threading, x86-64, MMX, Physical Address Ext, SYSCALL/SYSRET, Intel virtualization
   12:32:11 up 1 day,  4:56,  1 user,  load average: 0.00, 0.00, 0.05; runlevel 2

------------------------------------------------------------------------
Benchmark Run: Sun Dec 09 2012 12:32:11 - 13:00:19
4 CPUs in system; running 1 parallel copy of tests

Dhrystone 2 using register variables       19841982.0 lps   (10.0 s, 7 samples)
Double-Precision Whetstone                     3158.4 MWIPS (10.1 s, 7 samples)
Execl Throughput                               4903.2 lps   (30.0 s, 2 samples)
File Copy 1024 bufsize 2000 maxblocks        697365.0 KBps  (30.0 s, 2 samples)
File Copy 256 bufsize 500 maxblocks          187766.7 KBps  (30.0 s, 2 samples)
File Copy 4096 bufsize 8000 maxblocks       1909126.5 KBps  (30.0 s, 2 samples)
Pipe Throughput                             1108806.7 lps   (10.0 s, 7 samples)
Pipe-based Context Switching                 176087.6 lps   (10.0 s, 7 samples)
Process Creation                              15401.7 lps   (30.0 s, 2 samples)
Shell Scripts (1 concurrent)                   9548.9 lpm   (60.0 s, 2 samples)
Shell Scripts (8 concurrent)                   2783.0 lpm   (60.0 s, 2 samples)
System Call Overhead                         832312.7 lps   (10.0 s, 7 samples)

System Benchmarks Index Values               BASELINE       RESULT    INDEX
Dhrystone 2 using register variables         116700.0   19841982.0   1700.3
Double-Precision Whetstone                       55.0       3158.4    574.3
Execl Throughput                                 43.0       4903.2   1140.3
File Copy 1024 bufsize 2000 maxblocks          3960.0     697365.0   1761.0
File Copy 256 bufsize 500 maxblocks            1655.0     187766.7   1134.5
File Copy 4096 bufsize 8000 maxblocks          5800.0    1909126.5   3291.6
Pipe Throughput                               12440.0    1108806.7    891.3
Pipe-based Context Switching                   4000.0     176087.6    440.2
Process Creation                                126.0      15401.7   1222.4
Shell Scripts (1 concurrent)                     42.4       9548.9   2252.1
Shell Scripts (8 concurrent)                      6.0       2783.0   4638.3
System Call Overhead                          15000.0     832312.7    554.9
                                                                   ========
System Benchmarks Index Score                                        1285.4

------------------------------------------------------------------------
Benchmark Run: Sun Dec 09 2012 13:00:19 - 13:28:31
4 CPUs in system; running 4 parallel copies of tests

Dhrystone 2 using register variables       72686403.0 lps   (10.0 s, 7 samples)
Double-Precision Whetstone                    12399.8 MWIPS (10.0 s, 7 samples)
Execl Throughput                              20467.4 lps   (30.0 s, 2 samples)
File Copy 1024 bufsize 2000 maxblocks       1150905.7 KBps  (30.0 s, 2 samples)
File Copy 256 bufsize 500 maxblocks          288173.1 KBps  (30.0 s, 2 samples)
File Copy 4096 bufsize 8000 maxblocks       3470631.3 KBps  (30.0 s, 2 samples)
Pipe Throughput                             4109914.7 lps   (10.0 s, 7 samples)
Pipe-based Context Switching                 478661.7 lps   (10.0 s, 7 samples)
Process Creation                              48209.3 lps   (30.0 s, 2 samples)
Shell Scripts (1 concurrent)                  23781.0 lpm   (60.0 s, 2 samples)
Shell Scripts (8 concurrent)                   2560.8 lpm   (60.0 s, 2 samples)
System Call Overhead                        2910097.6 lps   (10.0 s, 7 samples)

System Benchmarks Index Values               BASELINE       RESULT    INDEX
Dhrystone 2 using register variables         116700.0   72686403.0   6228.5
Double-Precision Whetstone                       55.0      12399.8   2254.5
Execl Throughput                                 43.0      20467.4   4759.9
File Copy 1024 bufsize 2000 maxblocks          3960.0    1150905.7   2906.3
File Copy 256 bufsize 500 maxblocks            1655.0     288173.1   1741.2
File Copy 4096 bufsize 8000 maxblocks          5800.0    3470631.3   5983.8
Pipe Throughput                               12440.0    4109914.7   3303.8
Pipe-based Context Switching                   4000.0     478661.7   1196.7
Process Creation                                126.0      48209.3   3826.1
Shell Scripts (1 concurrent)                     42.4      23781.0   5608.7
Shell Scripts (8 concurrent)                      6.0       2560.8   4267.9
System Call Overhead                          15000.0    2910097.6   1940.1
                                                                   ========
System Benchmarks Index Score                                        3256.4
Testing again showed even better results:
   #    #  #    #  #  #    #          #####   ######  #    #   ####   #    #
   #    #  ##   #  #   #  #           #    #  #       ##   #  #    #  #    #
   #    #  # #  #  #    ##            #####   #####   # #  #  #       ######
   #    #  #  # #  #    ##            #    #  #       #  # #  #       #    #
   #    #  #   ##  #   #  #           #    #  #       #   ##  #    #  #    #
    ####   #    #  #  #    #          #####   ######  #    #   ####   #    #

   Version 5.1.3                      Based on the Byte Magazine Unix Benchmark

   Multi-CPU version                  Version 5 revisions by Ian Smith,
                                      Sunnyvale, CA, USA
   January 13, 2011                   johantheghost at yahoo period com


1 x Dhrystone 2 using register variables
 1 2 3 4 5 6 7 8 9 10

1 x Double-Precision Whetstone  1 2 3 4 5 6 7 8 9 10

1 x Execl Throughput  1 2 3

1 x File Copy 1024 bufsize 2000 maxblocks  1 2 3

1 x File Copy 256 bufsize 500 maxblocks  1 2 3

1 x File Copy 4096 bufsize 8000 maxblocks  1 2 3

1 x Pipe Throughput  1 2 3 4 5 6 7 8 9 10

1 x Pipe-based Context Switching  1 2 3 4 5 6 7 8 9 10

1 x Process Creation  1 2 3

1 x System Call Overhead  1 2 3 4 5 6 7 8 9 10

1 x Shell Scripts (1 concurrent)  1 2 3

1 x Shell Scripts (8 concurrent)  1 2 3

4 x Dhrystone 2 using register variables  1 2 3 4 5 6 7 8 9 10

4 x Double-Precision Whetstone  1 2 3 4 5 6 7 8 9 10

4 x Execl Throughput  1 2 3

4 x File Copy 1024 bufsize 2000 maxblocks  1 2 3

4 x File Copy 256 bufsize 500 maxblocks  1 2 3

4 x File Copy 4096 bufsize 8000 maxblocks  1 2 3

4 x Pipe Throughput  1 2 3 4 5 6 7 8 9 10

4 x Pipe-based Context Switching  1 2 3 4 5 6 7 8 9 10

4 x Process Creation  1 2 3

4 x System Call Overhead  1 2 3 4 5 6 7 8 9 10

4 x Shell Scripts (1 concurrent)  1 2 3

4 x Shell Scripts (8 concurrent)  1 2 3

========================================================================
   BYTE UNIX Benchmarks (Version 5.1.3)

   System: XXXXXX: GNU/Linux
   OS: GNU/Linux -- 2.6.32-042stab059.7 -- #1 SMP Tue Jul 24 19:12:01 MSK 2012
   Machine: i686 (unknown)
   Language: en_US.utf8 (charmap="UTF-8", collate="UTF-8")
   CPU 0: Intel(R) Xeon(R) CPU E31230 @ 3.20GHz (6385.7 bogomips)
          Hyper-Threading, x86-64, MMX, Physical Address Ext, SYSCALL/SYSRET, Intel virtualization
   CPU 1: Intel(R) Xeon(R) CPU E31230 @ 3.20GHz (6385.7 bogomips)
          Hyper-Threading, x86-64, MMX, Physical Address Ext, SYSCALL/SYSRET, Intel virtualization
   CPU 2: Intel(R) Xeon(R) CPU E31230 @ 3.20GHz (6385.7 bogomips)
          Hyper-Threading, x86-64, MMX, Physical Address Ext, SYSCALL/SYSRET, Intel virtualization
   CPU 3: Intel(R) Xeon(R) CPU E31230 @ 3.20GHz (6385.7 bogomips)
          Hyper-Threading, x86-64, MMX, Physical Address Ext, SYSCALL/SYSRET, Intel virtualization
   23:13:37 up  7:13,  1 user,  load average: 0.00, 0.00, 0.00; runlevel 2

------------------------------------------------------------------------
Benchmark Run: Sun Dec 09 2012 23:13:37 - 23:41:45
4 CPUs in system; running 1 parallel copy of tests

Dhrystone 2 using register variables       19847349.4 lps   (10.0 s, 7 samples)
Double-Precision Whetstone                     3159.1 MWIPS (10.1 s, 7 samples)
Execl Throughput                               4988.3 lps   (30.0 s, 2 samples)
File Copy 1024 bufsize 2000 maxblocks        726759.9 KBps  (30.0 s, 2 samples)
File Copy 256 bufsize 500 maxblocks          192045.3 KBps  (30.0 s, 2 samples)
File Copy 4096 bufsize 8000 maxblocks       2070479.6 KBps  (30.0 s, 2 samples)
Pipe Throughput                             1103739.0 lps   (10.0 s, 7 samples)
Pipe-based Context Switching                 189945.1 lps   (10.0 s, 7 samples)
Process Creation                              16765.6 lps   (30.0 s, 2 samples)
Shell Scripts (1 concurrent)                   9813.0 lpm   (60.0 s, 2 samples)
Shell Scripts (8 concurrent)                   2853.1 lpm   (60.0 s, 2 samples)
System Call Overhead                         835946.5 lps   (10.0 s, 7 samples)

System Benchmarks Index Values               BASELINE       RESULT    INDEX
Dhrystone 2 using register variables         116700.0   19847349.4   1700.7
Double-Precision Whetstone                       55.0       3159.1    574.4
Execl Throughput                                 43.0       4988.3   1160.1
File Copy 1024 bufsize 2000 maxblocks          3960.0     726759.9   1835.3
File Copy 256 bufsize 500 maxblocks            1655.0     192045.3   1160.4
File Copy 4096 bufsize 8000 maxblocks          5800.0    2070479.6   3569.8
Pipe Throughput                               12440.0    1103739.0    887.3
Pipe-based Context Switching                   4000.0     189945.1    474.9
Process Creation                                126.0      16765.6   1330.6
Shell Scripts (1 concurrent)                     42.4       9813.0   2314.4
Shell Scripts (8 concurrent)                      6.0       2853.1   4755.2
System Call Overhead                          15000.0     835946.5    557.3
                                                                   ========
System Benchmarks Index Score                                        1326.3

------------------------------------------------------------------------
Benchmark Run: Sun Dec 09 2012 23:41:45 - 00:09:58
4 CPUs in system; running 4 parallel copies of tests

Dhrystone 2 using register variables       70185287.2 lps   (10.0 s, 7 samples)
Double-Precision Whetstone                    12290.7 MWIPS (9.9 s, 7 samples)
Execl Throughput                              21703.2 lps   (30.0 s, 2 samples)
File Copy 1024 bufsize 2000 maxblocks       1181377.1 KBps  (30.0 s, 2 samples)
File Copy 256 bufsize 500 maxblocks          313551.2 KBps  (30.0 s, 2 samples)
File Copy 4096 bufsize 8000 maxblocks       3526422.9 KBps  (30.0 s, 2 samples)
Pipe Throughput                             4011554.7 lps   (10.0 s, 7 samples)
Pipe-based Context Switching                 482474.9 lps   (10.0 s, 7 samples)
Process Creation                              53435.1 lps   (30.0 s, 2 samples)
Shell Scripts (1 concurrent)                  24842.0 lpm   (60.0 s, 2 samples)
Shell Scripts (8 concurrent)                   2632.0 lpm   (60.1 s, 2 samples)
System Call Overhead                        2936627.1 lps   (10.0 s, 7 samples)

System Benchmarks Index Values               BASELINE       RESULT    INDEX
Dhrystone 2 using register variables         116700.0   70185287.2   6014.2
Double-Precision Whetstone                       55.0      12290.7   2234.7
Execl Throughput                                 43.0      21703.2   5047.2
File Copy 1024 bufsize 2000 maxblocks          3960.0    1181377.1   2983.3
File Copy 256 bufsize 500 maxblocks            1655.0     313551.2   1894.6
File Copy 4096 bufsize 8000 maxblocks          5800.0    3526422.9   6080.0
Pipe Throughput                               12440.0    4011554.7   3224.7
Pipe-based Context Switching                   4000.0     482474.9   1206.2
Process Creation                                126.0      53435.1   4240.9
Shell Scripts (1 concurrent)                     42.4      24842.0   5859.0
Shell Scripts (8 concurrent)                      6.0       2632.0   4386.7
System Call Overhead                          15000.0    2936627.1   1957.8
                                                                   ========
System Benchmarks Index Score                                        3341.1
Geekbench results are even more impressive and I was able to get close to 10000 points on the Geekbench tests:
System Information
  Platform:                  Linux x86 (32-bit)
  Compiler:                  GCC 4.1.2 20070925 (Red Hat 4.1.2-33)
  Operating System:          Linux 2.6.32-042stab059.7 i686
  Model:                     Linux PC (Intel(R) Xeon(R) CPU E31230 @ 3.20GHz)
  Motherboard:               Unknown Motherboard
  Processor:                 Intel(R) Xeon(R) CPU E31230 @ 3.20GHz
  Processor ID:              GenuineIntel Family 6 Model 42 Stepping 7
  Logical Processors:        4
  Physical Processors:       1
  Processor Frequency:       3.19 GHz
  L1 Instruction Cache:      0.00 B
  L1 Data Cache:             0.00 B
  L2 Cache:                  256 KB
  L3 Cache:                  0.00 B
  Bus Frequency:             0.00 Hz
  Memory:                    256 MB
  Memory Type:               N/A
  SIMD:                      1
  BIOS:                      N/A
  Processor Model:                     Intel(R) Xeon(R) CPU E31230 @ 3.20GHz
  Processor Cores:           4

Integer
  Blowfish
    single-threaded scalar    2078 ||||||||
    multi-threaded scalar     8906 |||||||||||||||||||||||||||||||||||
  Text Compress
    single-threaded scalar    2825 |||||||||||
    multi-threaded scalar    10917 |||||||||||||||||||||||||||||||||||||||||||
  Text Decompress
    single-threaded scalar    3034 ||||||||||||
    multi-threaded scalar    12378 |||||||||||||||||||||||||||||||||||||||||||||||||
  Image Compress
    single-threaded scalar    2357 |||||||||
    multi-threaded scalar     9245 ||||||||||||||||||||||||||||||||||||
  Image Decompress
    single-threaded scalar    2305 |||||||||
    multi-threaded scalar     9256 |||||||||||||||||||||||||||||||||||||
  Lua
    single-threaded scalar    3955 |||||||||||||||
    multi-threaded scalar    13574 ||||||||||||||||||||||||||||||||||||||||||||||||||||||

Floating Point
  Mandelbrot
    single-threaded scalar    2670 ||||||||||
    multi-threaded scalar    10845 |||||||||||||||||||||||||||||||||||||||||||
  Dot Product
    single-threaded scalar    4393 |||||||||||||||||
    multi-threaded scalar    18626 ||||||||||||||||||||||||||||||||||||||||||||||||||||||||||||||||||||||||||
    single-threaded vector    5209 ||||||||||||||||||||
    multi-threaded vector    24004 ||||||||||||||||||||||||||||||||||||||||||||||||||||||||||||||||||||||||||||||||||||||||||||||||
  LU Decomposition
    single-threaded scalar    3343 |||||||||||||
    multi-threaded scalar    13519 ||||||||||||||||||||||||||||||||||||||||||||||||||||||
  Primality Test
    single-threaded scalar    4706 ||||||||||||||||||
    multi-threaded scalar    14898 |||||||||||||||||||||||||||||||||||||||||||||||||||||||||||
  Sharpen Image
    single-threaded scalar   10680 ||||||||||||||||||||||||||||||||||||||||||
    multi-threaded scalar    42338 |||||||||||||||||||||||||||||||||||||||||||||||||||||||||||||||||||||||||||||||||||||||||||||||||||||||||||||||||||||||||||||||||||||||||||||||||||||||||||||||||||||||||
  Blur Image
    single-threaded scalar    8413 |||||||||||||||||||||||||||||||||
    multi-threaded scalar    33609 ||||||||||||||||||||||||||||||||||||||||||||||||||||||||||||||||||||||||||||||||||||||||||||||||||||||||||||||||||||||||||||||||||||||

Memory
  Read Sequential
    single-threaded scalar    7357 |||||||||||||||||||||||||||||
  Write Sequential
    single-threaded scalar   12152 ||||||||||||||||||||||||||||||||||||||||||||||||
  Stdlib Allocate
    single-threaded scalar    5048 ||||||||||||||||||||
  Stdlib Write
    single-threaded scalar    8571 ||||||||||||||||||||||||||||||||||
  Stdlib Copy
    single-threaded scalar   16716 ||||||||||||||||||||||||||||||||||||||||||||||||||||||||||||||||||

Stream
  Stream Copy
    single-threaded scalar    6123 ||||||||||||||||||||||||
    single-threaded vector    7485 |||||||||||||||||||||||||||||
  Stream Scale
    single-threaded scalar    6586 ||||||||||||||||||||||||||
    single-threaded vector    7676 ||||||||||||||||||||||||||||||
  Stream Add
    single-threaded scalar    6255 |||||||||||||||||||||||||
    single-threaded vector    6916 |||||||||||||||||||||||||||
  Stream Triad
    single-threaded scalar    6647 ||||||||||||||||||||||||||
    single-threaded vector    5054 ||||||||||||||||||||

Integer Score:                6735 ||||||||||||||||||||||||||
Floating Point Score:        14089 ||||||||||||||||||||||||||||||||||||||||||||||||||||||||
Memory Score:                 9968 |||||||||||||||||||||||||||||||||||||||
Stream Score:                 6592 ||||||||||||||||||||||||||

Overall Geekbench Score:      9941 |||||||||||||||||||||||||||||||||||||||
Testing again showed pretty good results as well:
System Information
  Platform:                  Linux x86 (32-bit)
  Compiler:                  GCC 4.1.2 20070925 (Red Hat 4.1.2-33)
  Operating System:          Linux 2.6.32-042stab059.7 i686
  Model:                     Linux PC (Intel(R) Xeon(R) CPU E31230 @ 3.20GHz)
  Motherboard:               Unknown Motherboard
  Processor:                 Intel(R) Xeon(R) CPU E31230 @ 3.20GHz
  Processor ID:              GenuineIntel Family 6 Model 42 Stepping 7
  Logical Processors:        4
  Physical Processors:       1
  Processor Frequency:       3.19 GHz
  L1 Instruction Cache:      0.00 B
  L1 Data Cache:             0.00 B
  L2 Cache:                  256 KB
  L3 Cache:                  0.00 B
  Bus Frequency:             0.00 Hz
  Memory:                    256 MB
  Memory Type:               N/A
  SIMD:                      1
  BIOS:                      N/A
  Processor Model:                     Intel(R) Xeon(R) CPU E31230 @ 3.20GHz
  Processor Cores:           4

Integer
  Blowfish
    single-threaded scalar    2078 ||||||||
    multi-threaded scalar     8769 |||||||||||||||||||||||||||||||||||
  Text Compress
    single-threaded scalar    2819 |||||||||||
    multi-threaded scalar    10946 |||||||||||||||||||||||||||||||||||||||||||
  Text Decompress
    single-threaded scalar    3029 ||||||||||||
    multi-threaded scalar    12401 |||||||||||||||||||||||||||||||||||||||||||||||||
  Image Compress
    single-threaded scalar    2355 |||||||||
    multi-threaded scalar     9211 ||||||||||||||||||||||||||||||||||||
  Image Decompress
    single-threaded scalar    2311 |||||||||
    multi-threaded scalar     9283 |||||||||||||||||||||||||||||||||||||
  Lua
    single-threaded scalar    3959 |||||||||||||||
    multi-threaded scalar    13469 |||||||||||||||||||||||||||||||||||||||||||||||||||||

Floating Point
  Mandelbrot
    single-threaded scalar    2670 ||||||||||
    multi-threaded scalar    10855 |||||||||||||||||||||||||||||||||||||||||||
  Dot Product
    single-threaded scalar    4270 |||||||||||||||||
    multi-threaded scalar    18108 ||||||||||||||||||||||||||||||||||||||||||||||||||||||||||||||||||||||||
    single-threaded vector    5186 ||||||||||||||||||||
    multi-threaded vector    23956 |||||||||||||||||||||||||||||||||||||||||||||||||||||||||||||||||||||||||||||||||||||||||||||||
  LU Decomposition
    single-threaded scalar    3275 |||||||||||||
    multi-threaded scalar    13482 |||||||||||||||||||||||||||||||||||||||||||||||||||||
  Primality Test
    single-threaded scalar    4705 ||||||||||||||||||
    multi-threaded scalar    14969 |||||||||||||||||||||||||||||||||||||||||||||||||||||||||||
  Sharpen Image
    single-threaded scalar   10689 ||||||||||||||||||||||||||||||||||||||||||
    multi-threaded scalar    42113 ||||||||||||||||||||||||||||||||||||||||||||||||||||||||||||||||||||||||||||||||||||||||||||||||||||||||||||||||||||||||||||||||||||||||||||||||||||||||||||||||||||||||
  Blur Image
    single-threaded scalar    8412 |||||||||||||||||||||||||||||||||
    multi-threaded scalar    33522 ||||||||||||||||||||||||||||||||||||||||||||||||||||||||||||||||||||||||||||||||||||||||||||||||||||||||||||||||||||||||||||||||||||||

Memory
  Read Sequential
    single-threaded scalar    7387 |||||||||||||||||||||||||||||
  Write Sequential
    single-threaded scalar   12157 ||||||||||||||||||||||||||||||||||||||||||||||||
  Stdlib Allocate
    single-threaded scalar    5051 ||||||||||||||||||||
  Stdlib Write
    single-threaded scalar    8490 |||||||||||||||||||||||||||||||||
  Stdlib Copy
    single-threaded scalar   16675 ||||||||||||||||||||||||||||||||||||||||||||||||||||||||||||||||||

Stream
  Stream Copy
    single-threaded scalar    6129 ||||||||||||||||||||||||
    single-threaded vector    7586 ||||||||||||||||||||||||||||||
  Stream Scale
    single-threaded scalar    6378 |||||||||||||||||||||||||
    single-threaded vector    7076 ||||||||||||||||||||||||||||
  Stream Add
    single-threaded scalar    6123 ||||||||||||||||||||||||
    single-threaded vector    6991 |||||||||||||||||||||||||||
  Stream Triad
    single-threaded scalar    6595 ||||||||||||||||||||||||||
    single-threaded vector    5115 ||||||||||||||||||||

Integer Score:                6719 ||||||||||||||||||||||||||
Floating Point Score:        14015 ||||||||||||||||||||||||||||||||||||||||||||||||||||||||
Memory Score:                 9952 |||||||||||||||||||||||||||||||||||||||
Stream Score:                 6499 |||||||||||||||||||||||||

Overall Geekbench Score:      9897 |||||||||||||||||||||||||||||||||||||||
Customer Service and Support
Compare to the VPS itself, which showed me really impressive performance, the support, particularly from the billing department, is comparatively less enjoyable but is pretty relatively pretty fast. Other than the incident mentioned above when I first signed up with them (which was mostly interacting with the billing department), I have contacted Semoweb twice afterwards on technical issues. For the first one, I was not sure if there is any backup system in place even though Semoweb advertise for Daily Backup System:

And the ticket that was submitted at 22:33 was answered by 23:20, which is within 50 minutes. Although the answer was a no (and therefore I assume what they meant by Daily Backup System is you have to run your own daily backups), however at least the ticket was responded fairly fast.
The last ticket I had with them was submitted today (on a Sunday) and Dustin the owner answered the ticket in 12 minutes, which was really fast as well.
Conclusion
Despite this review was requested by a less-than-happy client of Semoweb, I actually found the services to be pretty reasonable. The VPS itself is fast and stable, disk I/O is impressive and the network speed, particularly download speed, is definitely above par. Of course, when buying from a reseller, sometimes Semoweb probably could not be that flexible in terms of billing issues (say for example with regards to refund policies since they themselves are probably has a no-refund clause somewhere in their reseller agreements), but nonetheless the technical support, which is actually what people need most of the time, is fairly responsive. Furthermore, at the cheap price of 3USD/month (although unfortunately this plan is no longer offered), I can not say by any means that this is not a great deal to get for someone looking for a relatively small VPS.
P.S.: Of course this won’t affect the review by any means, but here is a screenshot of footer banner from Semoweb, which I really thought it would be a great idea if they could update these images that has been used by tonnes of different websites (the support girl picture alone has returned 1130 results in Google Image Search):

Hello,
We appreciate your honest and detailed reply, your review was brought up to us by another one of our customers 🙂
I did want to clear any confusion, we’re not a reseller of HostDime in the terms of reselling containers etc..
SemoWeb houses a A BULK amount of servers with HostDime, this does make us a client of theirs but by no means we are ‘reselling’ containers..
The SolusVM URL is indeed white label as we have very LARGE VPS resellers who enjoy and benefit from this white-labeled feature… in addition as you pointed out our Host Names appear to be HostDimes etc making it seem like we’re a reseller… the whole point in this is to make customers & resellers services white labeled this way others think they’re going direct..
Anyhow, we sincerely appreciate your detailed review and hope that you continue using our services.
Thanks!