
96MB Low End VPS Review Part 56–VM Storm VPS
My previous review was about a “cloud” VPS provider, VPS.NET, which is probably one of the largest “cloud” providers in the relatively budget market with 15 locations throughout the world. The VPS provider that I am going to review today, VMStorm, is a much smaller one but has some pretty good reviews and reputations in the community. Are they really as great as they seem to be? Let’s take a look.
Basic Information and Set Up
As per their advertisement on LowEndTalk, here is what is offered:

The signup page is almost a piece of art:

As you can see, everything was listed in one page and straight-forward, which is something really great. They have also listed their helpline number and email for you to contact them.
Note that on the sign up page, there is no cost for extra IPv4 addresses, I have confirmed with David that IPv4 is FREE with VMStorm as long as justification is given, that is very rare among the VPS providers these days, particularly those in the budget market.
The other pretty unique feature with VMStorm is the fact that you can also pay more to “upgrade” your SLA. The base SLA for VMStorm is 99.9%, which is already pretty good, however you can “upgrade” to 100% SLA if your life depends on your website and you do not mind paying an extra $15/month. You can also purchase phone support, priority RAM and CPU access for extra as well.

Payment via Paypal was sent to FlashPoint Informatics, which I can only assume is the parent company of VMStorm.
I have submitted my instant payment via Payapal at 8:00AM and unlike other providers, I have received an email reminding me the VPS is on its way at 8:01AM and then the same email four minutes later. Finally, the VPS was created at 8:05AM, barely five minutes after the payment was submitted.
One of the things that I would like to look into for the cloud providers is their user interface. Unlike the traditional VPS providers who mostly use SolusVM as their control panel, and hence becomes a little boring after a while, most of the cloud VPS providers uses their own panels. In that regard, I have to say the VMStorm control panel is no less than a piece of art.
Here is the login screen of the control panel, which, for some reason, reminded me of the login page of WordPress, and I actually emailed Dave to ask if the control panel was developed using WordPress as the front-end:

Once logged in, the VPS information is shown immediately on the first page, which is a lot more convenient compare to the SolusVM interface. I could understand the rationale of having a list of VPS if you have multiple ones, but it would be a really good idea, if you have only one VPS with a particular provider, to have the SolusVM interface going directly to the main management interface of that particular VPS.
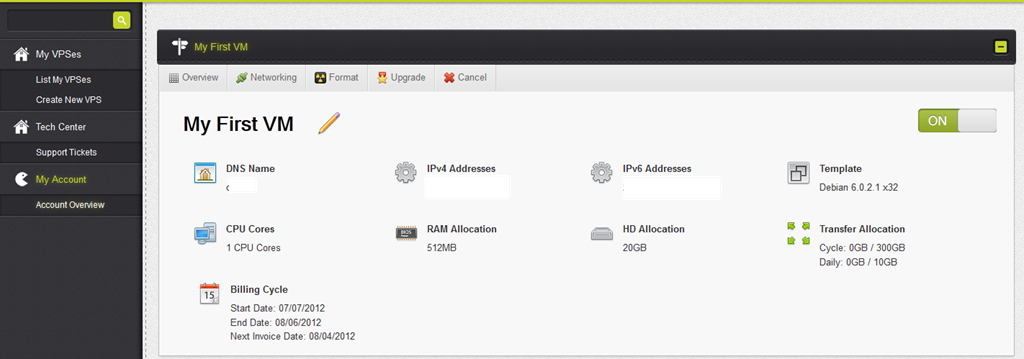
On the top portion of the page, it pretty much listed out all of the resources assigned to the VPS, as well as links to the other tabs that you can perform further actions:
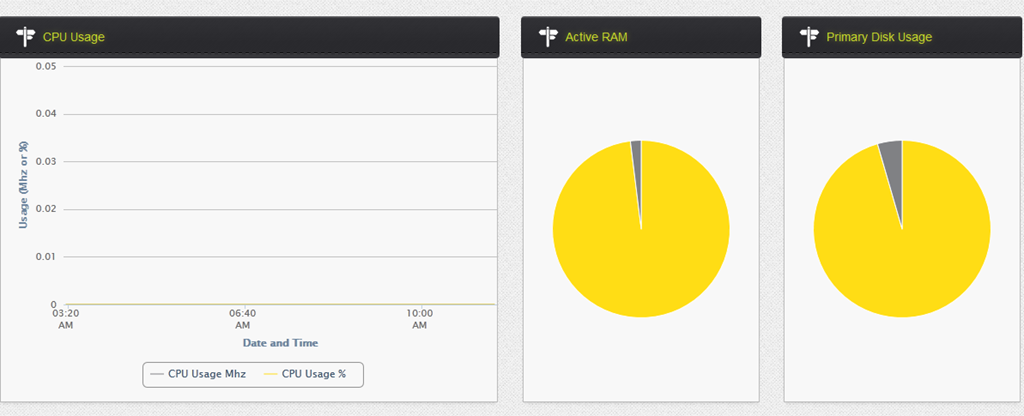
Scrolling down the page, you see the resource usage of the VPS, such as CPU, RAM and disk usage. Note that the CPU usage is taken across a period of time while the RAM and disk usage is just a snapshot of the current usage. However, this does make sense as it is rather meaningless, in my opinion, to give a snapshot of the CPU usage unless the VPS is consistently using a certain amount of CPU.
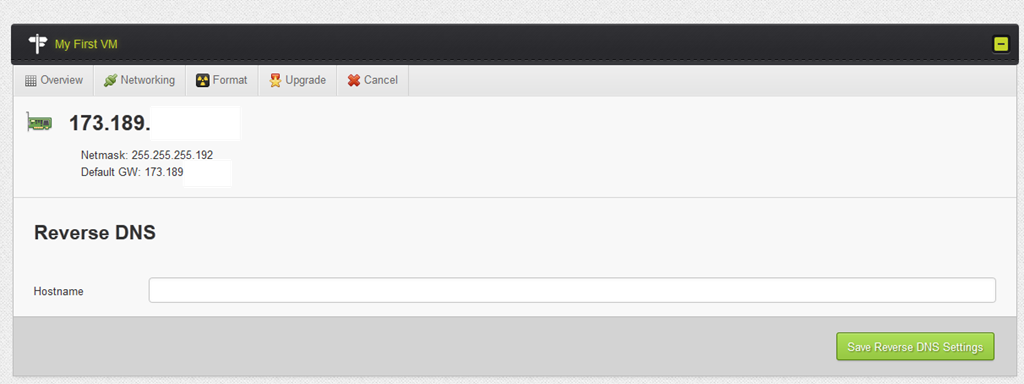
Going to the Networking tab, you see the IP addresses as well as the reverse DNS entry:
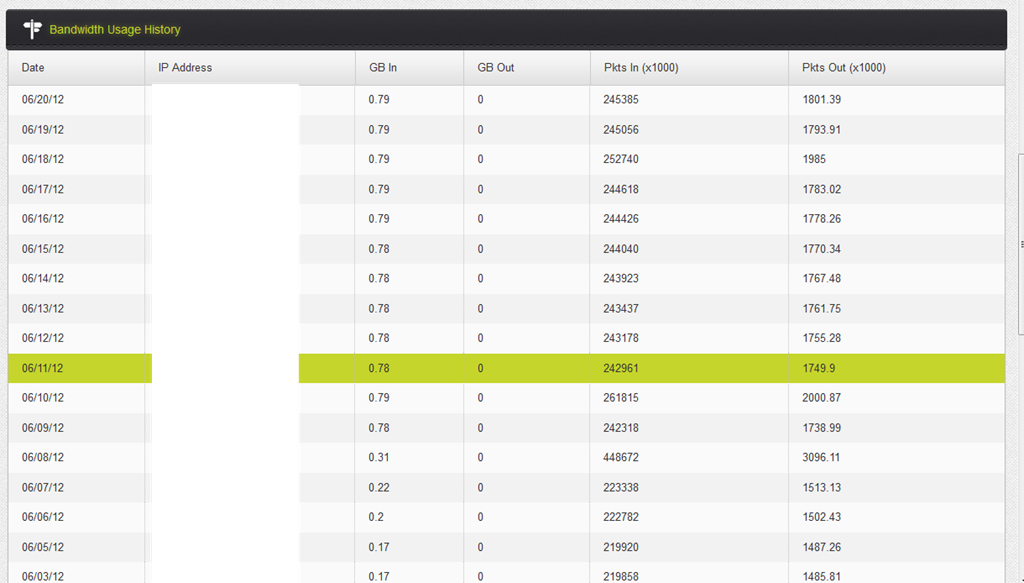
At the bottom of the page is the bandwidth summary by day. It is interesting to see that there is actually statistics in terms of the number of packets as well:
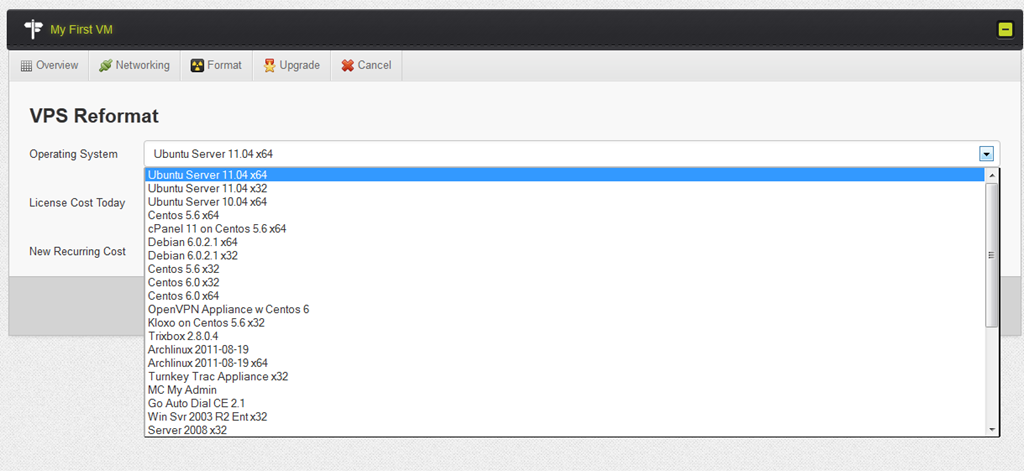
The format tab is obviously where you can install/reload the OS, and from here you can see there are quite a few of templates available, including Windows 2003 and 2008 templates as well as a few pre-packaged Turnkey templates for easy deployment:
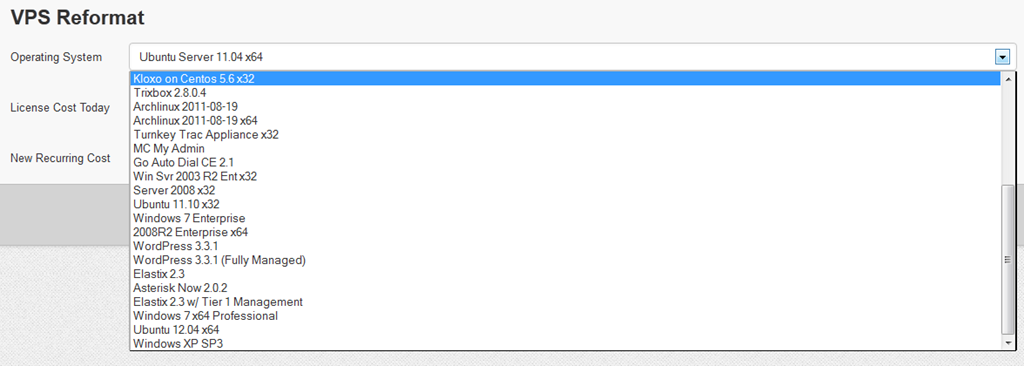
Even more templates by scrolling down the dropdown menu:
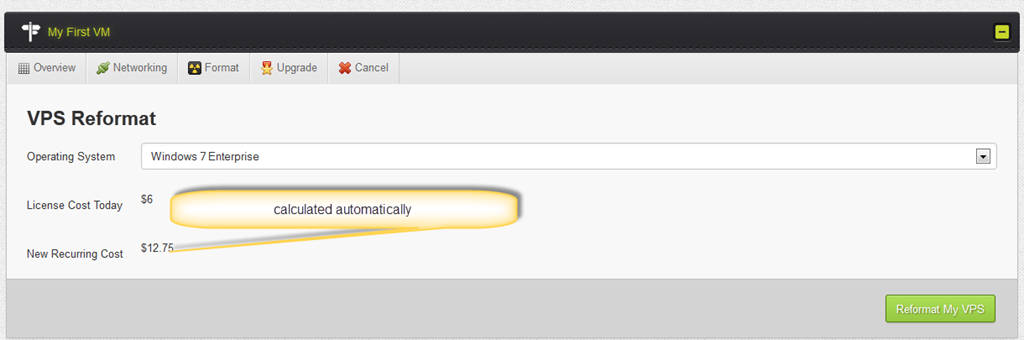
I tried to select the Windows 7 template and I was automatically charged an extra $6 per month for the license. VMStorm does have Windows 7 Enterprise available as well, which is rare among the providers. Interestingly enough, all their Windows license cost 6 USD per month, regardless of whether it is Windows 2003 or Windows 7.
Clicking on the upgrade button you will be brought to the upgrade/downgrade page where you can freely choose the package you would like to have and you will be billed accordingly.
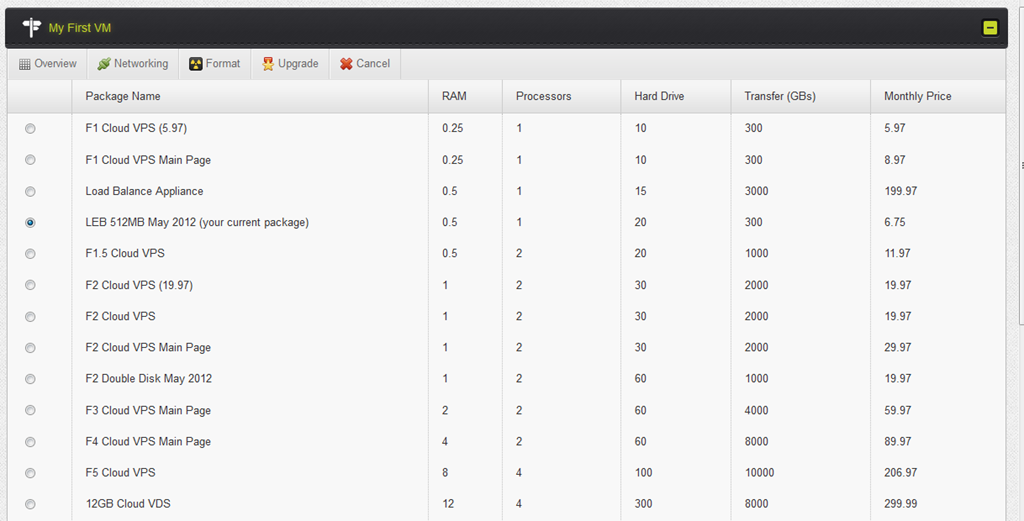
If you choose a separate package, note that you can pay for 90 days and get 5% off or pay for a year and get 10% off. Also, you can manually set the next billing date you would like to be, which I thought is a pretty good feature. There are also options there for you to purchase extra hard drive size.

Finally, the “Cancel” tab, as the name suggest, is for cancellation:

Test on the VPS
As mentioned above, the VPS that I have bought for testing has 1CPU core, 512MB of RAM and 20GB of hard drive space, the VPS is based in their “wholy-owned, private, carrier-neutral facility in State College, Pennsylvania” as per their advertisement on WHT.
I have installed 32 bit Debian template for testing in this case:
 uname -a
Linux xxxxxx 2.6.32-5-686 #1 SMP Mon Jun 13 04:13:06 UTC 2011 i686 GNU/Linux
When the VPS was first installed, almost 32MB of RAM was used, which is quite a lot compare to the standard Debian OVZ/Xen template, which typically used only 17MB.
free -m
             total       used       free     shared    buffers     cached
Mem:           502        476         26          0        335        107
-/+ buffers/cache:         32        469
Swap:         1023          0       1023
I was pretty surprised with that too but the answer becomes more apparent as I started to look at the top output:
top - 11:31:33 up 26 days, 20:43,  1 user,  load average: 0.00, 0.00, 0.00
Tasks:  66 total,   1 running,  65 sleeping,   0 stopped,   0 zombie
Cpu(s):  0.3%us,  0.0%sy,  0.0%ni, 99.7%id,  0.0%wa,  0.0%hi,  0.0%si,  0.0%st
Mem:    514652k total,   487476k used,    27176k free,   343556k buffers
Swap:  1048568k total,        0k used,  1048568k free,   110336k cached

  PID USER      PR  NI  VIRT  RES  SHR S %CPU %MEM    TIME+  COMMAND
 1527 root      20   0 13848 3008 2412 S  0.0  0.6  18:42.83 vmtoolsd
32750 root      20   0  5692 2992 1456 S  0.0  0.6   0:00.16 bash
32748 root      20   0  8260 2860 2332 S  0.0  0.6   0:00.07 sshd
  955 root      20   0 27580 1800 1044 S  0.0  0.3   0:08.36 rsyslogd
  300 root      20   0  2332 1124  900 R  0.0  0.2   0:00.00 top
  346 root      16  -4  2436 1032  452 S  0.0  0.2   0:00.05 udevd
 1904 root      20   0  5496  984  588 S  0.0  0.2   0:02.01 sshd
 1684 root      18  -2  2544  940  360 S  0.0  0.2   0:00.00 udevd
 1339 Debian-e  20   0  6516  936  624 S  0.0  0.2   0:00.26 exim4
 1685 root      18  -2  2432  808  232 S  0.0  0.2   0:00.00 udevd
  808 statd     20   0  1936  768  640 S  0.0  0.1   0:00.00 rpc.statd
 1127 root      20   0  3784  768  604 S  0.0  0.1   0:01.49 cron
 1873 root      20   0  2332  728  460 S  0.0  0.1   0:04.26 dhclient
 1059 root      20   0  1876  724  460 S  0.0  0.1   0:02.37 mpt-statusd
    1 root      20   0  2032  720  624 S  0.0  0.1   0:15.01 init
  981 root      20   0  1704  584  480 S  0.0  0.1   0:00.00 acpid
 1550 root      20   0  1708  552  472 S  0.0  0.1   0:00.00 getty
As well as the output of htop:
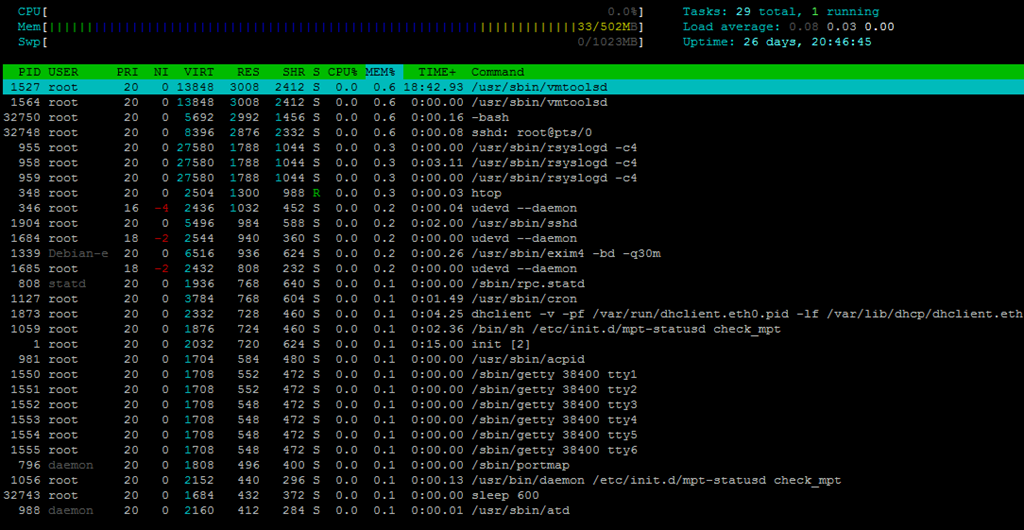
As you can see, the VPS is VMWare based and the vmtools alone ate quite a bit of memory. However, it has to be there in order for the VPS to be controlled remotely via the control panel.
Close to 1GB of hard drive space was used as well, which is again a little more compare to a “standard” Debian installation. The interesting bit here is that they seems to have a seperate partition for dev and boot, which is not common among small VPS:
 df -h
Filesystem            Size  Used Avail Use% Mounted on
/dev/mapper/ubuntu-disk1
                       19G  861M   17G   5% /
tmpfs                 252M     0  252M   0% /lib/init/rw
udev                  247M   96K  247M   1% /dev
tmpfs                 252M     0  252M   0% /dev/shm
/dev/sda1             241M   21M  208M   9% /boot
And there does not seem to be a limit on the inodes:
 df -i
Filesystem            Inodes   IUsed   IFree IUse% Mounted on
/dev/mapper/ubuntu-disk1
                     1245184   40813 1204371    4% /
tmpfs                  64331       5   64326    1% /lib/init/rw
udev                   63118     526   62592    1% /dev
tmpfs                  64331       1   64330    1% /dev/shm
/dev/sda1              63488     222   63266    1% /boot
After the full LNMP stack was installed, about 58MB of RAM was used:
free -m
             total       used       free     shared    buffers     cached
Mem:           502        488         13          0         24        405
-/+ buffers/cache:         58        443
Swap:         1023          0       1023
Top output showing the processes running:
top - 00:04:52 up 26 days, 21:18,  1 user,  load average: 0.00, 0.22, 0.43
Tasks:  76 total,   1 running,  75 sleeping,   0 stopped,   0 zombie
Cpu(s):  0.0%us,  0.0%sy,  0.0%ni,100.0%id,  0.0%wa,  0.0%hi,  0.0%si,  0.0%st
Mem:    514652k total,   501016k used,    13636k free,    25328k buffers
Swap:  1048568k total,       44k used,  1048524k free,   415428k cached

  PID USER      PR  NI  VIRT  RES  SHR S %CPU %MEM    TIME+  COMMAND
32729 www       20   0 15004  10m  432 S  0.0  2.2   0:00.00 nginx
32706 mysql     20   0 33948 4644 2040 S  0.0  0.9   0:00.00 mysqld
32717 root      20   0 24124 4552 1412 S  0.0  0.9   0:00.05 php-cgi
32719 www       20   0 24124 4156 1016 S  0.0  0.8   0:00.00 php-cgi
32720 www       20   0 24124 4156 1016 S  0.0  0.8   0:00.00 php-cgi
32721 www       20   0 24124 4156 1016 S  0.0  0.8   0:00.00 php-cgi
32722 www       20   0 24124 4156 1016 S  0.0  0.8   0:00.00 php-cgi
32723 www       20   0 24124 4156 1016 S  0.0  0.8   0:00.00 php-cgi
32750 root      20   0  5692 2708 1172 S  0.0  0.5   0:00.18 bash
 1527 root      20   0 13848 1836 1240 S  0.0  0.4  18:43.87 vmtoolsd
  955 root      20   0 27580 1508  752 S  0.0  0.3   0:08.37 rsyslogd
32748 root      20   0  8396 1308  760 S  0.0  0.3   0:00.80 sshd
  304 root      20   0  2440 1144  904 R  0.0  0.2   0:00.00 top
  346 root      16  -4  2436  908  368 S  0.0  0.2   0:00.05 udevd
 1684 root      18  -2  2544  864  320 S  0.0  0.2   0:00.00 udevd
 1339 Debian-e  20   0  6516  844  532 S  0.0  0.2   0:00.26 exim4
 1904 root      20   0  5496  820  424 S  0.0  0.2   0:02.01 sshd
 1685 root      18  -2  2432  816  276 S  0.0  0.2   0:00.00 udevd
32727 root      20   0  4792  720  272 S  0.0  0.1   0:00.00 nginx
 1873 root      20   0  2332  712  444 S  0.0  0.1   0:04.26 dhclient
 1059 root      20   0  1876  628  364 S  0.0  0.1   0:02.38 mpt-statusd
    1 root      20   0  2024  612  528 S  0.0  0.1   0:15.02 init
 1127 root      20   0  3784  604  440 S  0.0  0.1   0:01.49 cron
32604 root      20   0  1752  564  480 S  0.0  0.1   0:00.00 mysqld_safe
  808 statd     20   0  1936  532  404 S  0.0  0.1   0:00.00 rpc.statd
  981 root      20   0  1704  460  356 S  0.0  0.1   0:00.00 acpid
32767 root      20   0  1688  444  388 S  0.0  0.1   0:00.00 sleep
  796 daemon    20   0  1808  420  324 S  0.0  0.1   0:00.00 portmap
 1550 root      20   0  1708  412  332 S  0.0  0.1   0:00.00 getty
 1551 root      20   0  1708  412  332 S  0.0  0.1   0:00.00 getty
 1552 root      20   0  1708  408  332 S  0.0  0.1   0:00.00 getty
 1553 root      20   0  1708  408  332 S  0.0  0.1   0:00.00 getty
 1554 root      20   0  1708  408  332 S  0.0  0.1   0:00.00 getty
 1555 root      20   0  1708  408  332 S  0.0  0.1   0:00.00 getty
  988 daemon    20   0  2160  376  248 S  0.0  0.1   0:00.01 atd
 1056 root      20   0  2152  376  232 S  0.0  0.1   0:00.13 daemon
    2 root      20   0     0    0    0 S  0.0  0.0   0:00.04 kthreadd
    3 root      RT   0     0    0    0 S  0.0  0.0   0:00.00 migration/0
And 2GB of hard drive space was used:
 df -h
Filesystem            Size  Used Avail Use% Mounted on
/dev/mapper/ubuntu-disk1
                       19G  2.0G   16G  12% /
tmpfs                 252M     0  252M   0% /lib/init/rw
udev                  247M   96K  247M   1% /dev
tmpfs                 252M     0  252M   0% /dev/shm
/dev/sda1             241M   21M  208M   9% /boot
And the inodes:
 df -i
Filesystem            Inodes   IUsed   IFree IUse% Mounted on
/dev/mapper/ubuntu-disk1
                     1245184   84895 1160289    7% /
tmpfs                  64331       5   64326    1% /lib/init/rw
udev                   63118     526   62592    1% /dev
tmpfs                  64331       1   64330    1% /dev/shm
/dev/sda1              63488     222   63266    1% /boot
Uptime shows the VPS is idle:
 uptime
 11:31:39 up 26 days, 20:43,  1 user,  load average: 0.00, 0.00, 0.00
And there is no iowait in the VPS as well:
 vmstat
procs -----------memory---------- ---swap-- -----io---- -system-- ----cpu----
 r  b   swpd   free   buff  cache   si   so    bi    bo   in   cs us sy id wa
 0  0      0  20348 334236 125604    0    0     0     1   15   10  0  0 100  0
I actually left the VPS running for a while and it has been really stable during its whole lifetime:
uptime
 02:52:36 up 28 days, 5 min,  1 user,  load average: 0.00, 0.00, 0.00
CPU info shows that the Intel i7 CPU is used, which some people have argued that it is a desktop VPS and not something for the server, however, it is definitely a very powerful CPU and the fact that it is not throttled makes it really great for a small VPS like this:
cat cpuinfo
processor       : 0
vendor_id       : GenuineIntel
cpu family      : 6
model           : 30
model name      : Intel(R) Core(TM) i7 CPU         870  @ 2.93GHz
stepping        : 5
cpu MHz         : 2942.521
cache size      : 8192 KB
fdiv_bug        : no
hlt_bug         : no
f00f_bug        : no
coma_bug        : no
fpu             : yes
fpu_exception   : yes
cpuid level     : 11
wp              : yes
flags           : fpu vme de pse tsc msr pae mce cx8 apic sep mtrr pge mca cmov pat pse36 clflush dts acpi mmx fxsr sse sse2 ss nx rdtscp lm constant_tsc up arch_perfmon pebs bts xtopology tsc_reliable nonstop_tsc aperfmperf pni ssse3 cx16 sse4_1 sse4_2 popcnt hypervisor lahf_lm ida
bogomips        : 5885.04
clflush size    : 64
cache_alignment : 64
address sizes   : 40 bits physical, 48 bits virtual
power management:
Meminfo and time sync did not show anything too interesting:
cat meminfo
MemTotal:         514652 kB
MemFree:           11752 kB
Buffers:           27180 kB
Cached:           429196 kB
SwapCached:           52 kB
Active:            79224 kB
Inactive:         403064 kB
Active(anon):      11688 kB
Inactive(anon):    14332 kB
Active(file):      67536 kB
Inactive(file):   388732 kB
Unevictable:           0 kB
Mlocked:               0 kB
HighTotal:             0 kB
HighFree:              0 kB
LowTotal:         514652 kB
LowFree:           11752 kB
SwapTotal:       1048568 kB
SwapFree:        1048516 kB
Dirty:                 0 kB
Writeback:             0 kB
AnonPages:         25864 kB
Mapped:             8872 kB
Shmem:               108 kB
Slab:              15232 kB
SReclaimable:      10684 kB
SUnreclaim:         4548 kB
KernelStack:         632 kB
PageTables:          784 kB
NFS_Unstable:          0 kB
Bounce:                0 kB
WritebackTmp:          0 kB
CommitLimit:     1305892 kB
Committed_AS:     117884 kB
VmallocTotal:     503800 kB
VmallocUsed:        6872 kB
VmallocChunk:     485952 kB
HardwareCorrupted:     0 kB
HugePages_Total:       0
HugePages_Free:        0
HugePages_Rsvd:        0
HugePages_Surp:        0
Hugepagesize:       4096 kB
DirectMap4k:       16384 kB
DirectMap4M:      507904 kB
And time sync:
time sync

real    0m0.020s
user    0m0.000s
sys     0m0.000s
The disk I/O is pretty reasonable at 80MB/s, here is something I have noticed among the cloud VPS providers, for some reason none of their disk I/O is as impressive as those traditional VPS providers, which I can only assume is because the SAN has much longer latency:
 dd if=/dev/zero of=test bs=64k count=16k conv=fdatasync
16384+0 records in
16384+0 records out
1073741824 bytes (1.1 GB) copied, 13.2883 s, 80.8 MB/s
Testing again showed somewhat better results:
 dd if=/dev/zero of=test bs=64k count=16k conv=fdatasync
16384+0 records in
16384+0 records out
1073741824 bytes (1.1 GB) copied, 11.9527 s, 89.8 MB/s
IOPing is actually fairly consistent, which is good:
ioping -c 10 .
4096 bytes from . (ext4 /dev/mapper/ubuntu-disk1): request=1 time=0.4 ms
4096 bytes from . (ext4 /dev/mapper/ubuntu-disk1): request=2 time=0.8 ms
4096 bytes from . (ext4 /dev/mapper/ubuntu-disk1): request=3 time=1.2 ms
4096 bytes from . (ext4 /dev/mapper/ubuntu-disk1): request=4 time=0.5 ms
4096 bytes from . (ext4 /dev/mapper/ubuntu-disk1): request=5 time=0.5 ms
4096 bytes from . (ext4 /dev/mapper/ubuntu-disk1): request=6 time=1.0 ms
4096 bytes from . (ext4 /dev/mapper/ubuntu-disk1): request=7 time=0.5 ms
4096 bytes from . (ext4 /dev/mapper/ubuntu-disk1): request=8 time=0.7 ms
4096 bytes from . (ext4 /dev/mapper/ubuntu-disk1): request=9 time=2.5 ms
4096 bytes from . (ext4 /dev/mapper/ubuntu-disk1): request=10 time=0.8 ms

--- . (ext4 /dev/mapper/ubuntu-disk1) ioping statistics ---
10 requests completed in 9010.6 ms, 1125 iops, 4.4 mb/s
min/avg/max/mdev = 0.4/0.9/2.5/0.6 ms
And testing again:
 ioping -c 10 .
4096 bytes from . (ext4 /dev/mapper/ubuntu-disk1): request=1 time=1.3 ms
4096 bytes from . (ext4 /dev/mapper/ubuntu-disk1): request=2 time=0.6 ms
4096 bytes from . (ext4 /dev/mapper/ubuntu-disk1): request=3 time=0.5 ms
4096 bytes from . (ext4 /dev/mapper/ubuntu-disk1): request=4 time=2.1 ms
4096 bytes from . (ext4 /dev/mapper/ubuntu-disk1): request=5 time=0.4 ms
4096 bytes from . (ext4 /dev/mapper/ubuntu-disk1): request=6 time=0.5 ms
4096 bytes from . (ext4 /dev/mapper/ubuntu-disk1): request=7 time=0.5 ms
4096 bytes from . (ext4 /dev/mapper/ubuntu-disk1): request=8 time=0.5 ms
4096 bytes from . (ext4 /dev/mapper/ubuntu-disk1): request=9 time=0.5 ms
4096 bytes from . (ext4 /dev/mapper/ubuntu-disk1): request=10 time=0.9 ms

--- . (ext4 /dev/mapper/ubuntu-disk1) ioping statistics ---
10 requests completed in 9009.4 ms, 1290 iops, 5.0 mb/s
min/avg/max/mdev = 0.4/0.8/2.1/0.5 ms
I am not sure what the network port speed is for this VPS, but it definitely looks like it is on a shared 1Gbit port, since I was able to push for close to 25MB/s (200mbit/s) downloading the Cachefly test files:
 wget cachefly.cachefly.net/100mb.test -O /dev/null
--2012-07-09 02:58:37--  http://cachefly.cachefly.net/100mb.test
Resolving cachefly.cachefly.net... 205.234.175.175
Connecting to cachefly.cachefly.net|205.234.175.175|:80... connected.
HTTP request sent, awaiting response... 200 OK
Length: 104857600 (100M) [application/octet-stream]
Saving to: a€?/dev/nulla€

100%[======================================>] 104,857,600 26.6M/s   in 4.2s

2012-07-09 02:58:42 (23.5 MB/s) - a€?/dev/nulla€
Testing again showed similar results:
 wget cachefly.cachefly.net/100mb.test -O /dev/null
--2012-07-09 02:59:56--  http://cachefly.cachefly.net/100mb.test
Resolving cachefly.cachefly.net... 205.234.175.175
Connecting to cachefly.cachefly.net|205.234.175.175|:80... connected.
HTTP request sent, awaiting response... 200 OK
Length: 104857600 (100M) [application/octet-stream]
Saving to: a€?/dev/nulla€

100%[======================================>] 104,857,600 26.1M/s   in 4.3s

2012-07-09 03:00:01 (23.1 MB/s) - a€?/dev/nulla€
In order to prove my suspicion that I could push for a bit more on the network speed, I decided to use the aget test to download some 1Gbit files. First is the test file from ThinkBroadBand in London, UK:
aget http://ipv4.download.thinkbroadband.com/1GB.zip -n 10Attempting to read log file aget-1GB.zip.log for resuming download job... Couldn't find log file for this download, starting a clean job... Head-Request Connection established Downloading /1GB.zip (1073741824 bytes) from site ipv4.download.thinkbroadband.com(80.249.99.148:80). Number of Threads: 10 .. [4% completed] ..... [9% completed] ....... [14% completed] .......... [19% completed] ............ [24% completed] ............... [29% completed] ................. [34% completed] .................... [39% completed] ...................... [44% completed] ......................... [49% completed] ........................... [54% completed] .............................. [59% completed] ................................ [64% completed] ................................... [69% completed] ..................................... [74% completed] ........................................ [79% completed] .......................................... [84% completed] ............................................. [89% completed] ............................................... [94% completed] .................................................. [99% completed] .................................................. [100% completed] Download completed, job completed in 192 seconds. (5461 Kb/sec) Shutting down...
As you can see, the speed is probably less impressive than the Cachefly results, but considering how slow ThinkBroadBand normally is, I would say the speed is actually pretty reasonable.
And the results for testing again:
aget http://ipv4.download.thinkbroadband.com/1GB.zip -n 10Attempting to read log file aget-1GB.zip.log for resuming download job... Couldn't find log file for this download, starting a clean job... Head-Request Connection established Downloading /1GB.zip (1073741824 bytes) from site ipv4.download.thinkbroadband.com(80.249.99.148:80). Number of Threads: 10 .. [4% completed] ..... [9% completed] ....... [14% completed] .......... [19% completed] ............ [24% completed] ............... [29% completed] ................. [34% completed] .................... [39% completed] ...................... [44% completed] ......................... [49% completed] ........................... [54% completed] .............................. [59% completed] ................................ [64% completed] ................................... [69% completed] ..................................... [74% completed] ........................................ [79% completed] .......................................... [84% completed] ............................................. [89% completed] ............................................... [94% completed] .................................................. [99% completed] .................................................. [100% completed] Download completed, job completed in 328 seconds. (3196 Kb/sec) Shutting down...
I have also tried to test against the files from DimeNOC in Florida, which is a lot closer physically to the VPS, and the speed is somewhat better in this case:
aget -n 10 http://72.29.70.131/1gbfile.tgzAttempting to read log file aget-1gbfile.tgz.log for resuming download job... Couldn't find log file for this download, starting a clean job... Head-Request Connection established Downloading /1gbfile.tgz (1023410176 bytes) from site 72.29.70.131(72.29.70.131:80). Number of Threads: 10 .. [4% completed] ..... [9% completed] ....... [14% completed] .......... [19% completed] ............ [24% completed] ............... [29% completed] ................. [34% completed] .................... [39% completed] ...................... [44% completed] ......................... [49% completed] ........................... [54% completed] .............................. [59% completed] ................................ [64% completed] ................................... [69% completed] ..................................... [74% completed] ........................................ [79% completed] .......................................... [84% completed] ............................................. [89% completed] ............................................... [94% completed] .................................................. [99% completed] .................................................. [100% completed] Download completed, job completed in 116 seconds. (8615 Kb/sec) Shutting down...
For some reason, the second time of the aget test is worse than the first time in both of my aget tests on this VPS:
aget -n 10 http://72.29.70.131/1gbfile.tgzAttempting to read log file aget-1gbfile.tgz.log for resuming download job... Couldn't find log file for this download, starting a clean job... Head-Request Connection established Downloading /1gbfile.tgz (1023410176 bytes) from site 72.29.70.131(72.29.70.131:80). Number of Threads: 10 .. [4% completed] ..... [9% completed] ....... [14% completed] .......... [19% completed] ............ [24% completed] ............... [29% completed] ................. [34% completed] .................... [39% completed] ...................... [44% completed] ......................... [49% completed] ........................... [54% completed] .............................. [59% completed] ................................ [64% completed] ................................... [69% completed] ..................................... [74% completed] ........................................ [79% completed] .......................................... [84% completed] ............................................. [89% completed] ............................................... [94% completed] .................................................. [99% completed] .................................................. [100% completed] Download completed, job completed in 170 seconds. (5878 Kb/sec) Shutting down...
For the upload tests, the VPS showed pretty impressive results as well, first with my QuickWeb VPS in Chicago, IL, which, for some reason, showed the slowest upload speed among the three test VPS:
wget 173.189.xxx.xxx/100mb.test -O /dev/null
--2012-07-09 03:01:28--  http://173.189.xxx.xxx/100mb.test
Connecting to 173.189.xxx.xxx:80... connected.
HTTP request sent, awaiting response... 200 OK
Length: 104857600 (100M) [application/octet-stream]
Saving to: `/dev/null'

100%[======================================>] 104,857,600 3.95M/s   in 25s

2012-07-09 03:01:54 (3.93 MB/s) - `/dev/null' saved [104857600/104857600]
Suprisingly, with my Quickweb VPS in Los Angeles in CA, which is along the west coast, I was able to get a better test speed:
wget 173.189.xxx.xxx/100mb.test -O /dev/null
--2012-07-08 15:02:14--  http://173.189.xxx.xxx/100mb.test
Connecting to 173.189.xxx.xxx:80... connected.
HTTP request sent, awaiting response... 200 OK
Length: 104857600 (100M) [application/octet-stream]
Saving to: `/dev/null'

100%[======================================>] 104,857,600 7.91M/s   in 17s

2012-07-08 15:02:32 (5.72 MB/s) - `/dev/null' saved [104857600/104857600]
And finally, my XenVZ VPS in Maidenhead, UK:
wget 173.189.xxx.xxx/100mb.test -O /dev/null
--2012-07-09 03:01:35--  http://173.189.xxx.xxx/100mb.test
Connecting to 173.189.xxx.xxx:80... connected.
HTTP request sent, awaiting response... 200 OK
Length: 104857600 (100M) [application/octet-stream]
Saving to: `/dev/null'

100%[======================================>] 104,857,600 3.38M/s   in 25s

2012-07-09 03:01:59 (4.05 MB/s) - `/dev/null' saved [104857600/104857600]
Remember that I have mentioned the i7 is a really powerful CPU? My point was actually proven in the Unixbench test, when this single-core VPS was able to give a quite impressive score of more than 1300 points:
   #    #  #    #  #  #    #          #####   ######  #    #   ####   #    #
   #    #  ##   #  #   #  #           #    #  #       ##   #  #    #  #    #
   #    #  # #  #  #    ##            #####   #####   # #  #  #       ######
   #    #  #  # #  #    ##            #    #  #       #  # #  #       #    #
   #    #  #   ##  #   #  #           #    #  #       #   ##  #    #  #    #
    ####   #    #  #  #    #          #####   ######  #    #   ####   #    #

   Version 5.1.3                      Based on the Byte Magazine Unix Benchmark

   Multi-CPU version                  Version 5 revisions by Ian Smith,
                                      Sunnyvale, CA, USA
   January 13, 2011                   johantheghost at yahoo period com


1 x Dhrystone 2 using register variables  1 2 3 4 5 6 7 8 9 10

1 x Double-Precision Whetstone  1 2 3 4 5 6 7 8 9 10

1 x Execl Throughput  1 2 3

1 x File Copy 1024 bufsize 2000 maxblocks  1 2 3

1 x File Copy 256 bufsize 500 maxblocks  1 2 3

1 x File Copy 4096 bufsize 8000 maxblocks  1 2 3

1 x Pipe Throughput  1 2 3 4 5 6 7 8 9 10

1 x Pipe-based Context Switching  1 2 3 4 5 6 7 8 9 10

1 x Process Creation  1 2 3

1 x System Call Overhead  1 2 3 4 5 6 7 8 9 10

1 x Shell Scripts (1 concurrent)  1 2 3

1 x Shell Scripts (8 concurrent)  1 2 3

========================================================================
   BYTE UNIX Benchmarks (Version 5.1.3)

   System: xxxxx : GNU/Linux
   OS: GNU/Linux -- 2.6.32-5-686 -- #1 SMP Mon Jun 13 04:13:06 UTC 2011
   Machine: i686 (unknown)
   Language: en_US.utf8 (charmap="UTF-8", collate="UTF-8")
   CPU 0: Intel(R) Core(TM) i7 CPU 870 @ 2.93GHz (5885.0 bogomips)
          x86-64, MMX, Physical Address Ext, SYSENTER/SYSEXIT
   23:08:18 up 27 days, 20:21,  1 user,  load average: 0.08, 0.02, 0.01; runlevel 2

------------------------------------------------------------------------
Benchmark Run: Sun Jul 08 2012 23:08:18 - 23:36:26
1 CPU in system; running 1 parallel copy of tests

Dhrystone 2 using register variables       14616255.7 lps   (10.0 s, 7 samples)
Double-Precision Whetstone                     3091.4 MWIPS (9.5 s, 7 samples)
Execl Throughput                               4863.7 lps   (30.0 s, 2 samples)
File Copy 1024 bufsize 2000 maxblocks        612141.1 KBps  (30.0 s, 2 samples)
File Copy 256 bufsize 500 maxblocks          200241.5 KBps  (30.0 s, 2 samples)
File Copy 4096 bufsize 8000 maxblocks       1431848.5 KBps  (30.0 s, 2 samples)
Pipe Throughput                             1816507.0 lps   (10.0 s, 7 samples)
Pipe-based Context Switching                 370124.1 lps   (10.0 s, 7 samples)
Process Creation                              17476.3 lps   (30.0 s, 2 samples)
Shell Scripts (1 concurrent)                   5723.0 lpm   (60.0 s, 2 samples)
Shell Scripts (8 concurrent)                    728.9 lpm   (60.0 s, 2 samples)
System Call Overhead                        3374368.1 lps   (10.0 s, 7 samples)

System Benchmarks Index Values               BASELINE       RESULT    INDEX
Dhrystone 2 using register variables         116700.0   14616255.7   1252.5
Double-Precision Whetstone                       55.0       3091.4    562.1
Execl Throughput                                 43.0       4863.7   1131.1
File Copy 1024 bufsize 2000 maxblocks          3960.0     612141.1   1545.8
File Copy 256 bufsize 500 maxblocks            1655.0     200241.5   1209.9
File Copy 4096 bufsize 8000 maxblocks          5800.0    1431848.5   2468.7
Pipe Throughput                               12440.0    1816507.0   1460.2
Pipe-based Context Switching                   4000.0     370124.1    925.3
Process Creation                                126.0      17476.3   1387.0
Shell Scripts (1 concurrent)                     42.4       5723.0   1349.8
Shell Scripts (8 concurrent)                      6.0        728.9   1214.8
System Call Overhead                          15000.0    3374368.1   2249.6
                                                                   ========
System Benchmarks Index Score                                        1309.5
I was able to get even better results doing the test again:
   #    #  #    #  #  #    #          #####   ######  #    #   ####   #    #
   #    #  ##   #  #   #  #           #    #  #       ##   #  #    #  #    #
   #    #  # #  #  #    ##            #####   #####   # #  #  #       ######
   #    #  #  # #  #    ##            #    #  #       #  # #  #       #    #
   #    #  #   ##  #   #  #           #    #  #       #   ##  #    #  #    #
    ####   #    #  #  #    #          #####   ######  #    #   ####   #    #

   Version 5.1.3                      Based on the Byte Magazine Unix Benchmark

   Multi-CPU version                  Version 5 revisions by Ian Smith,
                                      Sunnyvale, CA, USA
   January 13, 2011                   johantheghost at yahoo period com


1 x Dhrystone 2 using register variables  1 2 3 4 5 6 7 8 9 10

1 x Double-Precision Whetstone  1 2 3 4 5 6 7 8 9 10

1 x Execl Throughput  1 2 3

1 x File Copy 1024 bufsize 2000 maxblocks  1 2 3

1 x File Copy 256 bufsize 500 maxblocks  1 2 3

1 x File Copy 4096 bufsize 8000 maxblocks  1 2 3

1 x Pipe Throughput  1 2 3 4 5 6 7 8 9 10

1 x Pipe-based Context Switching  1 2 3 4 5 6 7 8 9 10

1 x Process Creation  1 2 3

1 x System Call Overhead  1 2 3 4 5 6 7 8 9 10

1 x Shell Scripts (1 concurrent)  1 2 3

1 x Shell Scripts (8 concurrent)  1 2 3

========================================================================
   BYTE UNIX Benchmarks (Version 5.1.3)

   System: xxxxxx: GNU/Linux
   OS: GNU/Linux -- 2.6.32-5-686 -- #1 SMP Mon Jun 13 04:13:06 UTC 2011
   Machine: i686 (unknown)
   Language: en_US.utf8 (charmap="UTF-8", collate="UTF-8")
   CPU 0: Intel(R) Core(TM) i7 CPU 870 @ 2.93GHz (5885.0 bogomips)
          x86-64, MMX, Physical Address Ext, SYSENTER/SYSEXIT
   23:38:42 up 27 days, 20:51,  1 user,  load average: 0.80, 2.73, 1.77; runlevel 2

------------------------------------------------------------------------
Benchmark Run: Sun Jul 08 2012 23:38:42 - 00:06:51
1 CPU in system; running 1 parallel copy of tests

Dhrystone 2 using register variables       14800731.9 lps   (10.0 s, 7 samples)
Double-Precision Whetstone                     3096.1 MWIPS (9.6 s, 7 samples)
Execl Throughput                               5212.7 lps   (30.0 s, 2 samples)
File Copy 1024 bufsize 2000 maxblocks        655408.2 KBps  (30.0 s, 2 samples)
File Copy 256 bufsize 500 maxblocks          212875.8 KBps  (30.0 s, 2 samples)
File Copy 4096 bufsize 8000 maxblocks       1448424.5 KBps  (30.0 s, 2 samples)
Pipe Throughput                             1737235.1 lps   (10.0 s, 7 samples)
Pipe-based Context Switching                 360053.1 lps   (10.0 s, 7 samples)
Process Creation                              17621.9 lps   (30.0 s, 2 samples)
Shell Scripts (1 concurrent)                   5773.7 lpm   (60.0 s, 2 samples)
Shell Scripts (8 concurrent)                    745.2 lpm   (60.1 s, 2 samples)
System Call Overhead                        3334786.2 lps   (10.0 s, 7 samples)

System Benchmarks Index Values               BASELINE       RESULT    INDEX
Dhrystone 2 using register variables         116700.0   14800731.9   1268.3
Double-Precision Whetstone                       55.0       3096.1    562.9
Execl Throughput                                 43.0       5212.7   1212.3
File Copy 1024 bufsize 2000 maxblocks          3960.0     655408.2   1655.1
File Copy 256 bufsize 500 maxblocks            1655.0     212875.8   1286.3
File Copy 4096 bufsize 8000 maxblocks          5800.0    1448424.5   2497.3
Pipe Throughput                               12440.0    1737235.1   1396.5
Pipe-based Context Switching                   4000.0     360053.1    900.1
Process Creation                                126.0      17621.9   1398.6
Shell Scripts (1 concurrent)                     42.4       5773.7   1361.7
Shell Scripts (8 concurrent)                      6.0        745.2   1241.9
System Call Overhead                          15000.0    3334786.2   2223.2
                                                                   ========
System Benchmarks Index Score                                        1329.2
Geekbench is also able to show me some pretty good results:
System Information
  Platform:                  Linux x86 (32-bit)
  Compiler:                  GCC 4.1.2 20070925 (Red Hat 4.1.2-33)
  Operating System:          Linux 2.6.32-5-686 i686
  Model:                     Linux PC (Intel(R) Core(TM) i7 CPU         870  @ 2.93GHz)
  Motherboard:               Unknown Motherboard
  Processor:                 Intel(R) Core(TM) i7 CPU         870  @ 2.93GHz
  Processor ID:              GenuineIntel Family 6 Model 30 Stepping 5
  Logical Processors:        1
  Physical Processors:       1
  Processor Frequency:       2.94 GHz
  L1 Instruction Cache:      0.00 B
  L1 Data Cache:             0.00 B
  L2 Cache:                  256 KB
  L3 Cache:                  0.00 B
  Bus Frequency:             0.00 Hz
  Memory:                    503 MB
  Memory Type:               N/A
  SIMD:                      1
  BIOS:                      N/A
  Processor Model:           Intel(R) Core(TM) i7 CPU         870  @ 2.93GHz
  Processor Cores:           1

Integer
  Blowfish
    single-threaded scalar    2013 ||||||||
    multi-threaded scalar     2132 ||||||||
  Text Compress
    single-threaded scalar    1999 |||||||
    multi-threaded scalar     1907 |||||||
  Text Decompress
    single-threaded scalar    2105 ||||||||
    multi-threaded scalar     2088 ||||||||
  Image Compress
    single-threaded scalar    1869 |||||||
    multi-threaded scalar     1791 |||||||
  Image Decompress
    single-threaded scalar    1603 ||||||
    multi-threaded scalar     1633 ||||||
  Lua
    single-threaded scalar    3144 ||||||||||||
    multi-threaded scalar     3071 ||||||||||||

Floating Point
  Mandelbrot
    single-threaded scalar    2630 ||||||||||
    multi-threaded scalar     2666 ||||||||||
  Dot Product
    single-threaded scalar    3797 |||||||||||||||
    multi-threaded scalar     3995 |||||||||||||||
    single-threaded vector    4467 |||||||||||||||||
    multi-threaded vector     5088 ||||||||||||||||||||
  LU Decomposition
    single-threaded scalar    2491 |||||||||
    multi-threaded scalar     2905 |||||||||||
  Primality Test
    single-threaded scalar    3746 ||||||||||||||
    multi-threaded scalar     2977 |||||||||||
  Sharpen Image
    single-threaded scalar    6232 ||||||||||||||||||||||||
    multi-threaded scalar     6524 ||||||||||||||||||||||||||
  Blur Image
    single-threaded scalar    5927 |||||||||||||||||||||||
    multi-threaded scalar     5991 |||||||||||||||||||||||

Memory
  Read Sequential
    single-threaded scalar    4203 ||||||||||||||||
  Write Sequential
    single-threaded scalar    6694 ||||||||||||||||||||||||||
  Stdlib Allocate
    single-threaded scalar    3939 |||||||||||||||
  Stdlib Write
    single-threaded scalar    3437 |||||||||||||
  Stdlib Copy
    single-threaded scalar    6779 |||||||||||||||||||||||||||

Stream
  Stream Copy
    single-threaded scalar    3242 ||||||||||||
    single-threaded vector    3943 |||||||||||||||
  Stream Scale
    single-threaded scalar    3273 |||||||||||||
    single-threaded vector    3435 |||||||||||||
  Stream Add
    single-threaded scalar    2822 |||||||||||
    single-threaded vector    3833 |||||||||||||||
  Stream Triad
    single-threaded scalar    3065 ||||||||||||
    single-threaded vector    2532 ||||||||||

Integer Score:                2112 ||||||||
Floating Point Score:         4245 ||||||||||||||||
Memory Score:                 5010 ||||||||||||||||||||
Stream Score:                 3268 |||||||||||||

Overall Geekbench Score:      3553 ||||||||||||||
And the second test again give me better benchmarks, close to 4000 points, which is rare for a single core CPU VPS:
System Information
  Platform:                  Linux x86 (32-bit)
  Compiler:                  GCC 4.1.2 20070925 (Red Hat 4.1.2-33)
  Operating System:          Linux 2.6.32-5-686 i686
  Model:                     Linux PC (Intel(R) Core(TM) i7 CPU         870  @ 2.93GHz)
  Motherboard:               Unknown Motherboard
  Processor:                 Intel(R) Core(TM) i7 CPU         870  @ 2.93GHz
  Processor ID:              GenuineIntel Family 6 Model 30 Stepping 5
  Logical Processors:        1
  Physical Processors:       1
  Processor Frequency:       2.94 GHz
  L1 Instruction Cache:      0.00 B
  L1 Data Cache:             0.00 B
  L2 Cache:                  256 KB
  L3 Cache:                  0.00 B
  Bus Frequency:             0.00 Hz
  Memory:                    503 MB
  Memory Type:               N/A
  SIMD:                      1
  BIOS:                      N/A
  Processor Model:           Intel(R) Core(TM) i7 CPU         870  @ 2.93GHz
  Processor Cores:           1

Integer
  Blowfish
    single-threaded scalar    2004 ||||||||
    multi-threaded scalar     2071 ||||||||
  Text Compress
    single-threaded scalar    1850 |||||||
    multi-threaded scalar     1941 |||||||
  Text Decompress
    single-threaded scalar    2078 ||||||||
    multi-threaded scalar     2123 ||||||||
  Image Compress
    single-threaded scalar    1926 |||||||
    multi-threaded scalar     1805 |||||||
  Image Decompress
    single-threaded scalar    1663 ||||||
    multi-threaded scalar     1680 ||||||
  Lua
    single-threaded scalar    3193 ||||||||||||
    multi-threaded scalar     3108 ||||||||||||

Floating Point
  Mandelbrot
    single-threaded scalar    2631 ||||||||||
    multi-threaded scalar     2689 ||||||||||
  Dot Product
    single-threaded scalar    3799 |||||||||||||||
    multi-threaded scalar     4200 ||||||||||||||||
    single-threaded vector    4560 ||||||||||||||||||
    multi-threaded vector     5264 |||||||||||||||||||||
  LU Decomposition
    single-threaded scalar    3022 ||||||||||||
    multi-threaded scalar     2738 ||||||||||
  Primality Test
    single-threaded scalar    3823 |||||||||||||||
    multi-threaded scalar     3002 ||||||||||||
  Sharpen Image
    single-threaded scalar    6546 ||||||||||||||||||||||||||
    multi-threaded scalar     6382 |||||||||||||||||||||||||
  Blur Image
    single-threaded scalar    5902 |||||||||||||||||||||||
    multi-threaded scalar     6197 ||||||||||||||||||||||||

Memory
  Read Sequential
    single-threaded scalar    4380 |||||||||||||||||
  Write Sequential
    single-threaded scalar    7260 |||||||||||||||||||||||||||||
  Stdlib Allocate
    single-threaded scalar    4047 ||||||||||||||||
  Stdlib Write
    single-threaded scalar    3505 ||||||||||||||
  Stdlib Copy
    single-threaded scalar    7006 ||||||||||||||||||||||||||||

Stream
  Stream Copy
    single-threaded scalar    3211 ||||||||||||
    single-threaded vector    4033 ||||||||||||||||
  Stream Scale
    single-threaded scalar    3382 |||||||||||||
    single-threaded vector    3521 ||||||||||||||
  Stream Add
    single-threaded scalar    2990 |||||||||||
    single-threaded vector    3803 |||||||||||||||
  Stream Triad
    single-threaded scalar    2992 |||||||||||
    single-threaded vector    2578 ||||||||||

Integer Score:                2120 ||||||||
Floating Point Score:         4339 |||||||||||||||||
Memory Score:                 5239 ||||||||||||||||||||
Stream Score:                 3313 |||||||||||||

Overall Geekbench Score:      3639 ||||||||||||||
Overall, I have to say that I am really impressed with the performance of this VPS, although the price is probably one of the cheapest that I have seen among the “cloud” VPS providers, performance-wise it is definitely “high-end”.
Customer Service and Support
Other than a solid VPS, I am also impressed by the customer service and support offered by VMStorm. Although there is not exactly a formal ticket system which had me worried initially, Dave seems check emails pretty frequently, particularly during the day in the North American time, which worked out well for me. For example, an email I sent to them at 1:07AM EST was not responding until 7:44AM EST, however the reply I sent at 10:22AM was replied in two minutes at 10:24AM. Two days later, an email I sent to their help desk at 8:12AM was responded a single minute later!
Conclusion
Fast VPS and network, free IPv4 addresses and a really friendly and fast support, those are common features that we only seem to be available for the high-end VPS providers that are primarily catered towards business clients. However, VMStorm VPS has provided all these at an incredibly cheap cost. I was pleasantly surprised by the quality of their service and would definitely recommend VMStorm VPS to anyone who is looking for a cloud VPS.
can you try to ask for free IPs?
@jcaleb: Unfortunately I no longer have the account with them so I can not ask for it anymore, however Dave has stated to me in email that they have free IPv4 as long as justification is there, so I doubt it has changed since then.
Their support is not so fast on my account. I have to wait for hours just for their reply.
I had a problem once on my vm and it took almost a week for them to fix it 🙁
@vpn: sorry to hear about your experience, when I had them it was fairly quick and I was, honestly, pretty impressed. Is there any other VMStormVPS user have similar experience recently? Please kindly share with us.