
96MB Low End VPS Review Part 47 – RocketVPS
Knownhost is probably one of the most well-known brand in the VPS community for their managed VPS services. The services that they have provided is really second to none and have received quite a few positive feedbacks on WebhostingTalk. The only problem? They are too expensive to the budget VPS community. In fact, even with the heavy discount that they have posted here, even their cheapest VPS plan is way beyond the acceptable range of the budget VPS, which is typically set to below 7USD per month. Therefore, when Knownhost opened up their budget hosting division, RocketVPS, and offered a really sweet deal on WebhostingTalk, which even brought down their most basic VPS to within the budget VPS limit, I immediately took the dive and signed up for one of those boxes (Fortunate enough for me, I was able to be one of the first 50 lucky customers to get a 50% off for life discount) and let’s see if RocketVPS would stay up to the great reputation from Knowhost.
Basic Information and Set Up
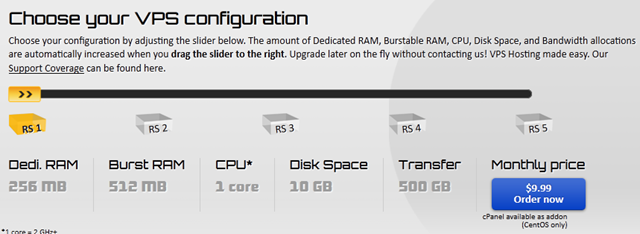
As mentioned in the posting on WebhostingTalk here, here is the specification of the VPS that I have purchased:

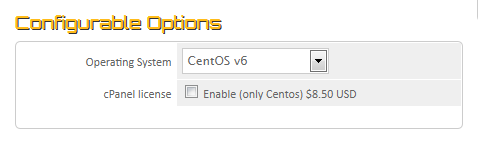
As you can see, the original price is 9.99 however with the 50% off coupon, I managed to lower the price down to 4.99USD per month, which is still not too cheap for a 256MB VPS, however is at least in the reasonable range. One thing worth noticing is that although it is not as cheap as the 5USD CPanel license that Knownhost offers, it is still at a relatively cheap price of 8.50 per month, which is less than what you could get from the outside vendors most of the time:
RocketVPS made use of the trendy slider bar when selecting VPS:
However the interesting bit is that after you select the VPS with the right specifications, you are still asked to input an domain, which is something that many customers would rather not see:

However I will give them the credit for hiding the other two options when inputting the domain, which sort of make your life a little easier. Of course, you can always put in any domain your like, aaa.com worked for me.
There are only two options available, either monthly or annual billing, with slight discount on the annual terms:

However, I do appreciate the fact that they are at least putting the monthly cost for the annual billing term so that I can roughly figure out how much I am saving by paying for a longer term. Many times I have to take out the calculator and divide the price by 12 just to see how much I can save by commit myself to a longer term, which is somewhat inconvenient.
By default, the host name is host, although you can definitely change it to anything you like:

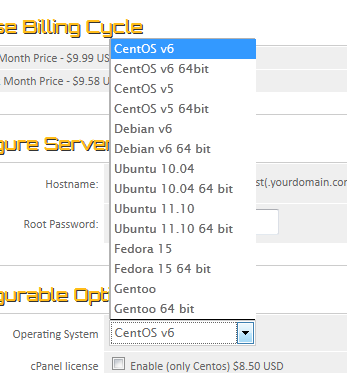
Several options for operating systems are available to choose during the sign up, and as mentioned before, CPanel is available as an addon for 8.50 per month, which is definitely a huge plus. Interestingly, other control panels such as Plesk and DirectAdmin are not even being listed. Just curious, how many people would actually use DirectAdmin and Plesk over CPanel? I personally have used Plesk before, and give up after 2 days and used CPanel again whenever I need a control panel ever since.
Provision was not instant but it was close enough, I have received my payment receipt at 6:46pm and the VPS Welcome email arrived 6 minutes later, with the root password showing in plain text and the SolusVM control panel on port 5656. Interestingly, they actually masked the password for the user forum they have. Quite frankly speaking, I would be more concerned if anyone seeing my root password for my VPS than finding out what my password for the support forum is.
Note that the SSH on the VPS is not on port 22 by default, which is something that really gave me a little headache, however a little search on their knowledgebase shows up this article, which tells me the default port is 2200. Although it is definitely a great security measure, I think it would be a lot easier if they could state such in the welcome email.
WHMCS is actually having a HTTP page for login, however once you are logged in, you are automatically forwarded to the HTTPS protocol, which is pretty interesting as I thought the whole purpose of HTTPS protocol is to encrypt the password during the transmission.
All buttons in the Control Panel in WHMCS is working and all three graphs are shown:
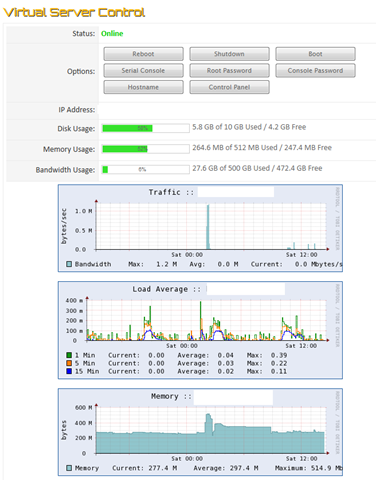
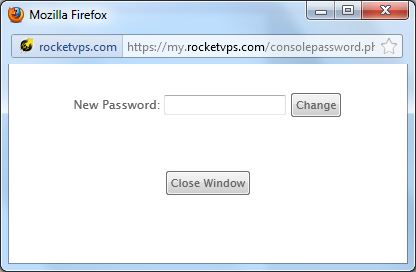
and as an example, the pop-up is shown when you click on the console password:
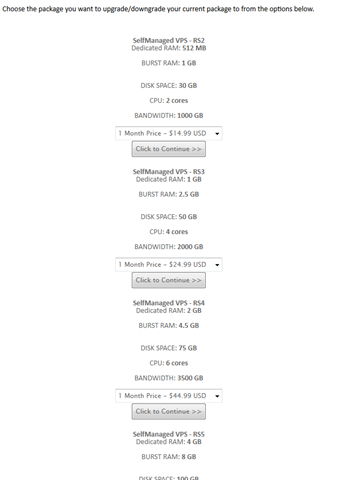
You can also click on the Upgrade/Downgrade button to upgrade to change the package:
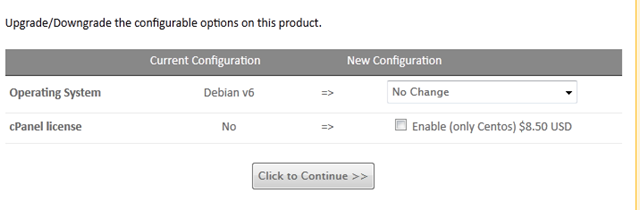
There is also a Upgrade/Downgrade options button for you to change the OS template as well as to get CPanel installed. This is much more convenient way to reload the VPS without actually logging into the control panel.
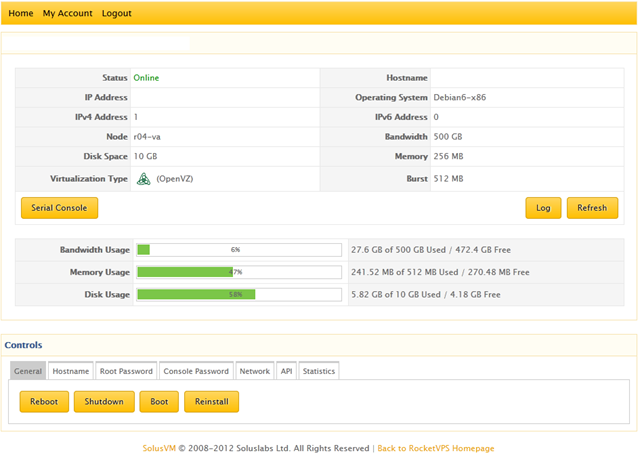
The SolusVM control panel is under HTTPS interface on port 5656, with a user name that is assigned to you. Once logged in, a pretty standard interface is shown:
There are many more OS templates available for install:
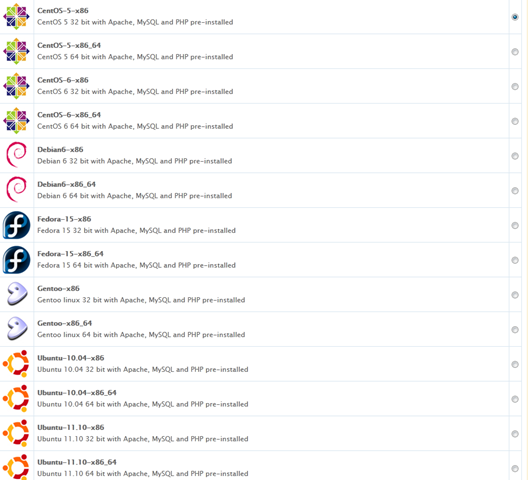
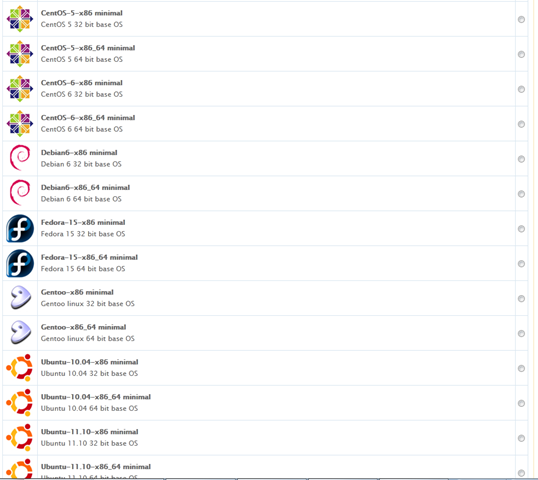
As you can see, they do have many Ubuntu templates available, as well as the latest Debian templates.
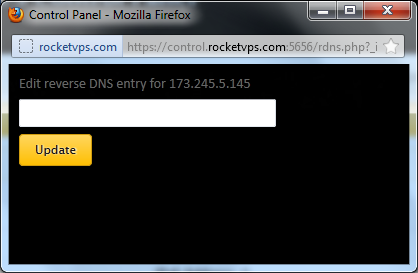
Instant rDNS is available as well, which is a big plus:
However, there is no central backup location as far as I can see.
Test on the VPS
As mentioned above, the VPS that I have signed up has 256MB of RAM (512MB burstable) and 10 GB of hard drive with 500GB of monthly bandwidth. The VPS is based in the net2EZ IAD 3 Data Center in Reston, Virginia according to their network page (thanks so much for making my life easier on trying to trace down the data centre) and I have installed Debian 6 32 bit (unfortunately the minimal template was not available when I set up the VPS) for testing purposes. Note that by default, the port speed is 10mbit, however you can always request a free bump up to 100mbit port once you order the service.
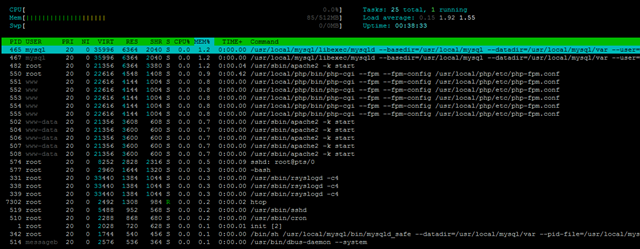
For this particular OS template, even after a fresh install, the resource usage is pretty high, due to the fact that it is actually running a complete LAMP stack rather than just a bare metal Debian 6 template.
As you can see, the free –m output is really high:
free -m
             total       used       free     shared    buffers     cached
Mem:           512        118        393          0          0         32
-/+ buffers/cache:         85        426
Swap:            0          0          0
Which made me initially almost thought there was “something wrong” with the OS template until I saw the processes running:
top - 00:15:28 up 38 min,  1 user,  load average: 0.21, 2.06, 1.58
Tasks:  24 total,   1 running,  23 sleeping,   0 stopped,   0 zombie
Cpu(s):  0.0%us,  0.0%sy,  0.0%ni,100.0%id,  0.0%wa,  0.0%hi,  0.0%si,  0.0%st
Mem:    524288k total,   121176k used,   403112k free,        0k buffers
Swap:        0k total,        0k used,        0k free,    33652k cached

  PID USER      PR  NI  VIRT  RES  SHR S %CPU %MEM    TIME+  COMMAND
  465 mysql     20   0 35996 6364 2040 S  0.0  1.2   0:00.00 mysqld
  482 root      20   0 21356 6364 3380 S  0.0  1.2   0:00.03 apache2
  550 root      20   0 22616 4548 1408 S  0.0  0.9   0:00.27 php-cgi
  551 www       20   0 22616 4144 1004 S  0.0  0.8   0:00.00 php-cgi
  552 www       20   0 22616 4144 1004 S  0.0  0.8   0:00.00 php-cgi
  553 www       20   0 22616 4144 1004 S  0.0  0.8   0:00.00 php-cgi
  554 www       20   0 22616 4144 1004 S  0.0  0.8   0:00.00 php-cgi
  555 www       20   0 22616 4144 1004 S  0.0  0.8   0:00.00 php-cgi
  502 www-data  20   0 21356 3608  608 S  0.0  0.7   0:00.00 apache2
  504 www-data  20   0 21356 3600  600 S  0.0  0.7   0:00.00 apache2
  506 www-data  20   0 21356 3600  600 S  0.0  0.7   0:00.00 apache2
  507 www-data  20   0 21356 3600  600 S  0.0  0.7   0:00.00 apache2
  508 www-data  20   0 21356 3600  600 S  0.0  0.7   0:00.00 apache2
  574 root      20   0  8252 2828 2316 S  0.0  0.5   0:00.07 sshd
  577 root      20   0  2960 1644 1320 S  0.0  0.3   0:00.00 bash
  331 root      20   0 33440 1384 1044 S  0.0  0.3   0:00.00 rsyslogd
 7301 root      20   0  2328 1096  900 R  0.0  0.2   0:00.00 top
And htop output for the htop fans:
And the disk space usage is a little higher than the “normal” Debian 6 template as well, sitting at close to 1GB of hard drive space:
 df -h
Filesystem            Size  Used Avail Use% Mounted on
/dev/simfs             10G  911M  9.2G   9% /
tmpfs                 256M     0  256M   0% /lib/init/rw
tmpfs                 256M     0  256M   0% /dev/shm
However, fortunately the INodes are set to pretty high values:
df -i
Filesystem            Inodes   IUsed   IFree IUse% Mounted on
/dev/simfs           5242880   35575 5207305    1% /
tmpfs                  65536       4   65532    1% /lib/init/rw
tmpfs                  65536       1   65535    1% /dev/shm
As this is a production VPS with websites running on it, I did not get to take an accurate reading of system resources after the LNMP stack was installed.
Uptime shows some pretty good numbers for this VPS:
 uptime
 22:42:58 up 51 days,  2:43,  1 user,  load average: 0.00, 0.01, 0.00
Which was confirmed again by the output of vmstat:
 vmstat
procs -----------memory---------- ---swap-- -----io---- -system-- ----cpu----
 r  b   swpd   free   buff  cache   si   so    bi    bo   in   cs us sy id wa
 0  0      0 251504      0  95608    0    0    10     9    0    3  3  1 96  0
Beancounters are set to some pretty reasonable values:
 cat /proc/user_beancounters
Version: 2.5
       uid  resource                     held              maxheld              barrier                limit              failcnt
      151:  kmemsize                 10686085            120496128           2147483646           2147483646                    0
            lockedpages                     0                    5               999999               999999                    0
            privvmpages                 59271                98646               131072               131072                    0
            shmpages                     1538                 8834                65536                65536                    0
            dummy                           0                    0                    0                    0                    0
            numproc                        29                  123               999999               999999                    0
            physpages                   68183               131551                    0               131072                    0
            vmguarpages                     0                    0                65536           2147483647                    0
            oomguarpages                41722                45998                65536           2147483647                    0
            numtcpsock                     15                   90              7999992              7999992                    0
            numflock                        1                   11               999999               999999                    0
            numpty                          2                    5               500000               500000                    0
            numsiginfo                      0                   66               999999               999999                    0
            tcpsndbuf                  322640             16489520            214748160            396774400                    0
            tcprcvbuf                  245760              6122768            214748160            396774400                    0
            othersockbuf                18496              4249240            214748160            396774400                    0
            dgramrcvbuf                     0                13080            214748160            396774400                    0
            numothersock                   78                  127              7999992              7999992                    0
            dcachesize                7122405            116001175           2147483646           2147483646                    0
            numfile                       483                  910             23999976             23999976                    0
            dummy                           0                    0                    0                    0                    0
            dummy                           0                    0                    0                    0                    0
            dummy                           0                    0                    0                    0                    0
            numiptent                      24                   24               999999               999999                    0
And there is no sign of overselling from the output of vzfree:
 vzfree
             Total     Used     Free
Kernel:   2048.00M   10.21M 2037.79M
Allocate:  512.00M  231.53M  280.47M (256M Guaranteed)
Commit:    256.00M  173.21M   82.79M (70.4% of Allocated)
Swap:              -339.50M          (-208.3% of Committed)
Note that however this is the first time I see the swap having a negative value, which is pretty interesting. Could someone explain to me why that is the case?
There is one CPU core assigned to this VPS, and it is not throttled:
 cat /proc/cpuinfo
processor       : 0
vendor_id       : GenuineIntel
cpu family      : 6
model           : 44
model name      : Intel(R) Xeon(R) CPU           E5645  @ 2.40GHz
stepping        : 2
cpu MHz         : 2400.185
cache size      : 12288 KB
physical id     : 0
siblings        : 12
core id         : 0
cpu cores       : 6
apicid          : 0
initial apicid  : 0
fpu             : yes
fpu_exception   : yes
cpuid level     : 11
wp              : yes
flags           : fpu vme de pse tsc msr pae mce cx8 apic mtrr pge mca cmov pat pse36 clflush dts acpi mmx fxsr sse sse2 ss ht tm pbe syscall nx pdpe1gb rdtscp lm constant_tsc arch_perfmon pebs bts rep_good xtopology nonstop_tsc aperfmperf pni dtes64 monitor ds_cpl vmx smx est tm2 ssse3 cx16 xtpr pdcm dca sse4_1 sse4_2 popcnt lahf_lm ida arat epb dts tpr_shadow vnmi flexpriority ept vpid
bogomips        : 4800.37
clflush size    : 64
cache_alignment : 64
address sizes   : 40 bits physical, 48 bits virtual
power management:
Meminfo output is a bit unsual:
cat /proc/meminfo
MemTotal:         524288 kB
MemFree:           16928 kB
Cached:           329844 kB
Active:           163228 kB
Inactive:         333632 kB
Active(anon):     130752 kB
Inactive(anon):    36264 kB
Active(file):      32476 kB
Inactive(file):   297368 kB
Unevictable:           0 kB
Mlocked:               0 kB
SwapTotal:             0 kB
SwapFree:              0 kB
Dirty:                 8 kB
AnonPages:        167016 kB
Shmem:              6152 kB
Slab:              10452 kB
SReclaimable:       6980 kB
SUnreclaim:         3472 kB
As you can see, the output is a bit shorter and I am not sure what things like Dirty and AnonPages represent.
And the output of time sync:
 time sync

real    0m0.136s
user    0m0.001s
sys     0m0.106s
The network is pretty good, I was able to get 13MB/s consistently while doing the download test, which is close to the line speed considering it is a 100mbit port.
wget cachefly.cachefly.net/100mb.test -O /dev/null
--2012-04-28 23:37:49--  http://cachefly.cachefly.net/100mb.test
Resolving cachefly.cachefly.net... 205.234.175.175
Connecting to cachefly.cachefly.net|205.234.175.175|:80... connected.
HTTP request sent, awaiting response... 200 OK
Length: 104857600 (100M) [application/octet-stream]
Saving to: `/dev/null'

100%[======================================>] 104,857,600 13.1M/s   in 7.9s

2012-04-28 23:37:57 (12.7 MB/s) - `/dev/null' saved [104857600/104857600]
Testing again showing similar results:
wget cachefly.cachefly.net/100mb.test -O /dev/null
--2012-04-28 23:38:24--  http://cachefly.cachefly.net/100mb.test
Resolving cachefly.cachefly.net... 205.234.175.175
Connecting to cachefly.cachefly.net|205.234.175.175|:80... connected.
HTTP request sent, awaiting response... 200 OK
Length: 104857600 (100M) [application/octet-stream]
Saving to: `/dev/null'

100%[======================================>] 104,857,600 13.0M/s   in 7.7s

2012-04-28 23:38:32 (13.0 MB/s) - `/dev/null' saved [104857600/104857600]
The upload speed is pretty good as well, with the best speed showing along the west coast:
First download test is done on a Quickweb VPS in Chicago, IL:
 wget 173.245.xxx.xxx/100mb.test -O /dev/null
--2012-04-28 23:56:00--  http://173.245.xxx.xxx/100mb.test
Connecting to 173.245.xxx.xxx:80... connected.
HTTP request sent, awaiting response... 200 OK
Length: 104857600 (100M) [application/octet-stream]
Saving to: `/dev/null'

100%[======================================>] 104,857,600 3.35M/s   in 31s

2012-04-28 23:56:31 (3.24 MB/s) - `/dev/null' saved [104857600/104857600]
Next is another Quickweb VPS in Los Angeles, CA
wget 173.245.xxx.xxx/100mb.test -O /dev/null
--2012-04-28 23:58:33--  http://173.245.xxx.xxx/100mb.test
Connecting to 173.245.xxx.xxx:80... connected.
HTTP request sent, awaiting response... 200 OK
Length: 104857600 (100M) [application/octet-stream]
Saving to: `/dev/null'

100%[======================================>] 104,857,600 7.19M/s   in 15s

2012-04-28 23:58:48 (6.51 MB/s) - `/dev/null' saved [104857600/104857600]
As you can see, the speed along the west coast almost doubled the upload speed along the east coast.
The last VPS used for testing is located in Maidenhead, UK, with XenVZ/OpenITC:
wget 173.245.xxx.xxx/100mb.test -O /dev/null
--2012-04-29 03:57:52--  http://173.245.xxx.xxx/100mb.test
Connecting to 173.245.xxx.xxx:80... connected.
HTTP request sent, awaiting response... 200 OK
Length: 104857600 (100M) [application/octet-stream]
Saving to: `/dev/null'

100%[======================================>] 104,857,600 4.33M/s   in 27s

2012-04-29 03:58:19 (3.68 MB/s) - `/dev/null' saved [104857600/104857600]
The disk I/O speed is really what is remarkable though, with some really good dd output:
dd if=/dev/zero of=test bs=64k count=16k conv=fdatasync
16384+0 records in
16384+0 records out
1073741824 bytes (1.1 GB) copied, 3.66166 s, 293 MB/s
As you can see, the disk I/O is close to 300MB/s, which is truly remarkable.
Testing again showing similar amazing results:
dd if=/dev/zero of=test bs=64k count=16k conv=fdatasync
16384+0 records in
16384+0 records out
1073741824 bytes (1.1 GB) copied, 4.21175 s, 255 MB/s
IOPing is really consistent as well, with the ioping time mostly around 0.1ms.
ioping -c 10 .
4096 bytes from . (simfs /vz/private/151): request=1 time=0.2 ms
4096 bytes from . (simfs /vz/private/151): request=2 time=0.1 ms
4096 bytes from . (simfs /vz/private/151): request=3 time=0.1 ms
4096 bytes from . (simfs /vz/private/151): request=4 time=0.1 ms
4096 bytes from . (simfs /vz/private/151): request=5 time=0.1 ms
4096 bytes from . (simfs /vz/private/151): request=6 time=0.1 ms
4096 bytes from . (simfs /vz/private/151): request=7 time=0.1 ms
4096 bytes from . (simfs /vz/private/151): request=8 time=0.1 ms
4096 bytes from . (simfs /vz/private/151): request=9 time=0.1 ms
4096 bytes from . (simfs /vz/private/151): request=10 time=0.1 ms

--- . (simfs /vz/private/151) ioping statistics ---
10 requests completed in 9002.2 ms, 8711 iops, 34.0 mb/s
min/avg/max/mdev = 0.1/0.1/0.2/0.0 ms
Testing again shows very consistent results as well:
ioping -c 10 .
4096 bytes from . (simfs /vz/private/151): request=1 time=0.1 ms
4096 bytes from . (simfs /vz/private/151): request=2 time=0.2 ms
4096 bytes from . (simfs /vz/private/151): request=3 time=0.1 ms
4096 bytes from . (simfs /vz/private/151): request=4 time=0.1 ms
4096 bytes from . (simfs /vz/private/151): request=5 time=0.1 ms
4096 bytes from . (simfs /vz/private/151): request=6 time=0.1 ms
4096 bytes from . (simfs /vz/private/151): request=7 time=0.2 ms
4096 bytes from . (simfs /vz/private/151): request=8 time=0.1 ms
4096 bytes from . (simfs /vz/private/151): request=9 time=0.1 ms
4096 bytes from . (simfs /vz/private/151): request=10 time=0.1 ms

--- . (simfs /vz/private/151) ioping statistics ---
10 requests completed in 9002.1 ms, 9756 iops, 38.1 mb/s
min/avg/max/mdev = 0.1/0.1/0.2/0.0 ms
Finally, the benchmark tests, with just one CPU core available, the VPS was unfortunately penalized a little during UnixBench tests.
   #    #  #    #  #  #    #          #####   ######  #    #   ####   #    #
   #    #  ##   #  #   #  #           #    #  #       ##   #  #    #  #    #
   #    #  # #  #  #    ##            #####   #####   # #  #  #       ######
   #    #  #  # #  #    ##            #    #  #       #  # #  #       #    #
   #    #  #   ##  #   #  #           #    #  #       #   ##  #    #  #    #
    ####   #    #  #  #    #          #####   ######  #    #   ####   #    #

   Version 5.1.3                      Based on the Byte Magazine Unix Benchmark

   Multi-CPU version                  Version 5 revisions by Ian Smith,
                                      Sunnyvale, CA, USA
   January 13, 2011                   johantheghost at yahoo period com

1 x Dhrystone 2 using register variables  1 2 3 4 5 6 7 8 9 10

1 x Double-Precision Whetstone  1 2 3 4 5 6 7 8 9 10

1 x Execl Throughput  1 2 3

1 x File Copy 1024 bufsize 2000 maxblocks  1 2 3

1 x File Copy 256 bufsize 500 maxblocks  1 2 3

1 x File Copy 4096 bufsize 8000 maxblocks  1 2 3

1 x Pipe Throughput  1 2 3 4 5 6 7 8 9 10

1 x Pipe-based Context Switching  1 2 3 4 5 6 7 8 9 10

1 x Process Creation  1 2 3

1 x System Call Overhead  1 2 3 4 5 6 7 8 9 10

1 x Shell Scripts (1 concurrent)  1 2 3

1 x Shell Scripts (8 concurrent)  1 2 3

========================================================================
   BYTE UNIX Benchmarks (Version 5.1.3)

   System: host: GNU/Linux
   OS: GNU/Linux -- 2.6.32-042stab049.6 -- #1 SMP Mon Feb 6 19:17:43 MSK 2012
   Machine: i686 (unknown)
   Language: en_US.utf8 (charmap="ANSI_X3.4-1968", collate="ANSI_X3.4-1968")
   CPU 0: Intel(R) Xeon(R) CPU E5645 @ 2.40GHz (4800.4 bogomips)
          Hyper-Threading, x86-64, MMX, Physical Address Ext, SYSCALL/SYSRET, Intel virtualization
   03:35:25 up  3:58,  1 user,  load average: 0.00, 0.00, 0.00; runlevel 2

------------------------------------------------------------------------
Benchmark Run: Wed Mar 07 2012 03:35:25 - 04:04:55
1 CPU in system; running 1 parallel copy of tests

Dhrystone 2 using register variables       12714562.3 lps   (10.0 s, 7 samples)
Double-Precision Whetstone                     2453.7 MWIPS (10.1 s, 7 samples)
Execl Throughput                               2551.5 lps   (29.7 s, 2 samples)
File Copy 1024 bufsize 2000 maxblocks        496953.6 KBps  (30.0 s, 2 samples)
File Copy 256 bufsize 500 maxblocks          131995.8 KBps  (30.0 s, 2 samples)
File Copy 4096 bufsize 8000 maxblocks       1265546.0 KBps  (30.0 s, 2 samples)
Pipe Throughput                              774787.0 lps   (10.0 s, 7 samples)
Pipe-based Context Switching                  90796.9 lps   (10.0 s, 7 samples)
Process Creation                               7366.8 lps   (30.0 s, 2 samples)
Shell Scripts (1 concurrent)                   4363.6 lpm   (60.0 s, 2 samples)
Shell Scripts (8 concurrent)                    561.5 lpm   (60.1 s, 2 samples)
System Call Overhead                         632849.0 lps   (10.0 s, 7 samples)

System Benchmarks Index Values               BASELINE       RESULT    INDEX
Dhrystone 2 using register variables         116700.0   12714562.3   1089.5
Double-Precision Whetstone                       55.0       2453.7    446.1
Execl Throughput                                 43.0       2551.5    593.4
File Copy 1024 bufsize 2000 maxblocks          3960.0     496953.6   1254.9
File Copy 256 bufsize 500 maxblocks            1655.0     131995.8    797.6
File Copy 4096 bufsize 8000 maxblocks          5800.0    1265546.0   2182.0
Pipe Throughput                               12440.0     774787.0    622.8
Pipe-based Context Switching                   4000.0      90796.9    227.0
Process Creation                                126.0       7366.8    584.7
Shell Scripts (1 concurrent)                     42.4       4363.6   1029.1
Shell Scripts (8 concurrent)                      6.0        561.5    935.8
System Call Overhead                          15000.0     632849.0    421.9
                                                                   ========
System Benchmarks Index Score                                         725.2
Testing again showed slightly better results as well:
   #    #  #    #  #  #    #          #####   ######  #    #   ####   #    #
   #    #  ##   #  #   #  #           #    #  #       ##   #  #    #  #    #
   #    #  # #  #  #    ##            #####   #####   # #  #  #       ######
   #    #  #  # #  #    ##            #    #  #       #  # #  #       #    #
   #    #  #   ##  #   #  #           #    #  #       #   ##  #    #  #    #
    ####   #    #  #  #    #          #####   ######  #    #   ####   #    #

   Version 5.1.3                      Based on the Byte Magazine Unix Benchmark

   Multi-CPU version                  Version 5 revisions by Ian Smith,
                                      Sunnyvale, CA, USA
   January 13, 2011                   johantheghost at yahoo period com

1 x Dhrystone 2 using register variables  1 2 3 4 5 6 7 8 9 10

1 x Double-Precision Whetstone  1 2 3 4 5 6 7 8 9 10

1 x Execl Throughput  1 2 3

1 x File Copy 1024 bufsize 2000 maxblocks  1 2 3

1 x File Copy 256 bufsize 500 maxblocks  1 2 3

1 x File Copy 4096 bufsize 8000 maxblocks  1 2 3

1 x Pipe Throughput  1 2 3 4 5 6 7 8 9 10

1 x Pipe-based Context Switching  1 2 3 4 5 6 7 8 9 10

1 x Process Creation  1 2 3

1 x System Call Overhead  1 2 3 4 5 6 7 8 9 10

1 x Shell Scripts (1 concurrent)  1 2 3

1 x Shell Scripts (8 concurrent)  1 2 3

========================================================================
   BYTE UNIX Benchmarks (Version 5.1.3)

   System: host: GNU/Linux
   OS: GNU/Linux -- 2.6.32-042stab049.6 -- #1 SMP Mon Feb 6 19:17:43 MSK 2012
   Machine: i686 (unknown)
   Language: en_US.utf8 (charmap="ANSI_X3.4-1968", collate="ANSI_X3.4-1968")
   CPU 0: Intel(R) Xeon(R) CPU E5645 @ 2.40GHz (4800.4 bogomips)
          Hyper-Threading, x86-64, MMX, Physical Address Ext, SYSCALL/SYSRET, Intel virtualization
   23:43:36 up 6 min,  1 user,  load average: 0.00, 0.00, 0.00; runlevel 2

------------------------------------------------------------------------
Benchmark Run: Tue Mar 06 2012 23:43:36 - 00:12:06
1 CPU in system; running 1 parallel copy of tests

Dhrystone 2 using register variables       12784701.4 lps   (10.0 s, 7 samples)
Double-Precision Whetstone                     2443.1 MWIPS (10.1 s, 7 samples)
Execl Throughput                               2542.1 lps   (29.8 s, 2 samples)
File Copy 1024 bufsize 2000 maxblocks        503010.0 KBps  (30.0 s, 2 samples)
File Copy 256 bufsize 500 maxblocks          133901.0 KBps  (30.0 s, 2 samples)
File Copy 4096 bufsize 8000 maxblocks       1329418.2 KBps  (30.0 s, 2 samples)
Pipe Throughput                              772465.5 lps   (10.0 s, 7 samples)
Pipe-based Context Switching                  92837.3 lps   (10.0 s, 7 samples)
Process Creation                               8521.7 lps   (30.0 s, 2 samples)
Shell Scripts (1 concurrent)                   4350.6 lpm   (60.0 s, 2 samples)
Shell Scripts (8 concurrent)                    557.7 lpm   (60.1 s, 2 samples)
System Call Overhead                         634346.4 lps   (10.0 s, 7 samples)

System Benchmarks Index Values               BASELINE       RESULT    INDEX
Dhrystone 2 using register variables         116700.0   12784701.4   1095.5
Double-Precision Whetstone                       55.0       2443.1    444.2
Execl Throughput                                 43.0       2542.1    591.2
File Copy 1024 bufsize 2000 maxblocks          3960.0     503010.0   1270.2
File Copy 256 bufsize 500 maxblocks            1655.0     133901.0    809.1
File Copy 4096 bufsize 8000 maxblocks          5800.0    1329418.2   2292.1
Pipe Throughput                               12440.0     772465.5    621.0
Pipe-based Context Switching                   4000.0      92837.3    232.1
Process Creation                                126.0       8521.7    676.3
Shell Scripts (1 concurrent)                     42.4       4350.6   1026.1
Shell Scripts (8 concurrent)                      6.0        557.7    929.5
System Call Overhead                          15000.0     634346.4    422.9
                                                                   ========
System Benchmarks Index Score                                         739.3
The Geekbench results shows a better picture:
System Information
  Platform:                  Linux x86 (32-bit)
  Compiler:                  GCC 4.1.2 20070925 (Red Hat 4.1.2-33)
  Operating System:          Linux 2.6.32-042stab049.6 i686
  Model:                     Linux PC (Intel(R) Xeon(R) CPU           E5645  @ 2.40GHz)
  Motherboard:               Unknown Motherboard
  Processor:                 Intel(R) Xeon(R) CPU           E5645  @ 2.40GHz
  Processor ID:              GenuineIntel Family 6 Model 44 Stepping 2
  Logical Processors:        1
  Physical Processors:       1
  Processor Frequency:       2.40 GHz
  L1 Instruction Cache:      0.00 B
  L1 Data Cache:             0.00 B
  L2 Cache:                  256 KB
  L3 Cache:                  0.00 B
  Bus Frequency:             0.00 Hz
  Memory:                    512 MB
  Memory Type:               N/A
  SIMD:                      1
  BIOS:                      N/A
  Processor Model:           Intel(R) Xeon(R) CPU           E5645  @ 2.40GHz
  Processor Cores:           1

Integer
  Blowfish
    single-threaded scalar    1684 ||||||
    multi-threaded scalar     2855 |||||||||||
  Text Compress
    single-threaded scalar    1865 |||||||
    multi-threaded scalar     1872 |||||||
  Text Decompress
    single-threaded scalar    1912 |||||||
    multi-threaded scalar     2039 ||||||||
  Image Compress
    single-threaded scalar    1581 ||||||
    multi-threaded scalar     3083 ||||||||||||
  Image Decompress
    single-threaded scalar    1478 |||||
    multi-threaded scalar     3000 ||||||||||||
  Lua
    single-threaded scalar    2952 |||||||||||
    multi-threaded scalar     3058 ||||||||||||

Floating Point
  Mandelbrot
    single-threaded scalar    2009 ||||||||
    multi-threaded scalar     2283 |||||||||
  Dot Product
    single-threaded scalar    3273 |||||||||||||
    multi-threaded scalar     4662 ||||||||||||||||||
    single-threaded vector    3889 |||||||||||||||
    multi-threaded vector     8921 |||||||||||||||||||||||||||||||||||
  LU Decomposition
    single-threaded scalar    2038 ||||||||
    multi-threaded scalar     4307 |||||||||||||||||
  Primality Test
    single-threaded scalar    3263 |||||||||||||
    multi-threaded scalar     2746 ||||||||||
  Sharpen Image
    single-threaded scalar    5502 ||||||||||||||||||||||
    multi-threaded scalar    10988 |||||||||||||||||||||||||||||||||||||||||||
  Blur Image
    single-threaded scalar    5012 ||||||||||||||||||||
    multi-threaded scalar     5695 ||||||||||||||||||||||

Memory
  Read Sequential
    single-threaded scalar    4873 |||||||||||||||||||
  Write Sequential
    single-threaded scalar    8285 |||||||||||||||||||||||||||||||||
  Stdlib Allocate
    single-threaded scalar    3660 ||||||||||||||
  Stdlib Write
    single-threaded scalar    3035 ||||||||||||
  Stdlib Copy
    single-threaded scalar    3295 |||||||||||||

Stream
  Stream Copy
    single-threaded scalar    5073 ||||||||||||||||||||
    single-threaded vector    6724 ||||||||||||||||||||||||||
  Stream Scale
    single-threaded scalar    3333 |||||||||||||
    single-threaded vector    4316 |||||||||||||||||
  Stream Add
    single-threaded scalar    4908 |||||||||||||||||||
    single-threaded vector    7496 |||||||||||||||||||||||||||||
  Stream Triad
    single-threaded scalar    5475 |||||||||||||||||||||
    single-threaded vector    5515 ||||||||||||||||||||||

Integer Score:                2281 |||||||||
Floating Point Score:         4613 ||||||||||||||||||
Memory Score:                 4629 ||||||||||||||||||
Stream Score:                 5355 |||||||||||||||||||||

Overall Geekbench Score:      3874 |||||||||||||||
With more than 3800 points on this little machine, I have to say it is pretty good.
Testing again shows similar results:
System Information
  Platform:                  Linux x86 (32-bit)
  Compiler:                  GCC 4.1.2 20070925 (Red Hat 4.1.2-33)
  Operating System:          Linux 2.6.32-042stab049.6 i686
  Model:                     Linux PC (Intel(R) Xeon(R) CPU           E5645  @ 2.40GHz)
  Motherboard:               Unknown Motherboard
  Processor:                 Intel(R) Xeon(R) CPU           E5645  @ 2.40GHz
  Processor ID:              GenuineIntel Family 6 Model 44 Stepping 2
  Logical Processors:        1
  Physical Processors:       1
  Processor Frequency:       2.40 GHz
  L1 Instruction Cache:      0.00 B
  L1 Data Cache:             0.00 B
  L2 Cache:                  256 KB
  L3 Cache:                  0.00 B
  Bus Frequency:             0.00 Hz
  Memory:                    512 MB
  Memory Type:               N/A
  SIMD:                      1
  BIOS:                      N/A
  Processor Model:           Intel(R) Xeon(R) CPU           E5645  @ 2.40GHz
  Processor Cores:           1

Integer
  Blowfish
    single-threaded scalar    1682 ||||||
    multi-threaded scalar     1895 |||||||
  Text Compress
    single-threaded scalar    1871 |||||||
    multi-threaded scalar     2033 ||||||||
  Text Decompress
    single-threaded scalar    1905 |||||||
    multi-threaded scalar     2082 ||||||||
  Image Compress
    single-threaded scalar    1585 ||||||
    multi-threaded scalar     3102 ||||||||||||
  Image Decompress
    single-threaded scalar    1485 |||||
    multi-threaded scalar     2993 |||||||||||
  Lua
    single-threaded scalar    2958 |||||||||||
    multi-threaded scalar     2970 |||||||||||

Floating Point
  Mandelbrot
    single-threaded scalar    2009 ||||||||
    multi-threaded scalar     2323 |||||||||
  Dot Product
    single-threaded scalar    3274 |||||||||||||
    multi-threaded scalar     4993 |||||||||||||||||||
    single-threaded vector    3897 |||||||||||||||
    multi-threaded vector     8989 |||||||||||||||||||||||||||||||||||
  LU Decomposition
    single-threaded scalar    2122 ||||||||
    multi-threaded scalar     4237 ||||||||||||||||
  Primality Test
    single-threaded scalar    3267 |||||||||||||
    multi-threaded scalar     2723 ||||||||||
  Sharpen Image
    single-threaded scalar    5490 |||||||||||||||||||||
    multi-threaded scalar     6805 |||||||||||||||||||||||||||
  Blur Image
    single-threaded scalar    4973 |||||||||||||||||||
    multi-threaded scalar     6193 ||||||||||||||||||||||||

Memory
  Read Sequential
    single-threaded scalar    4908 |||||||||||||||||||
  Write Sequential
    single-threaded scalar    6567 ||||||||||||||||||||||||||
  Stdlib Allocate
    single-threaded scalar    3631 ||||||||||||||
  Stdlib Write
    single-threaded scalar    3062 ||||||||||||
  Stdlib Copy
    single-threaded scalar    3429 |||||||||||||

Stream
  Stream Copy
    single-threaded scalar    3865 |||||||||||||||
    single-threaded vector    4466 |||||||||||||||||
  Stream Scale
    single-threaded scalar    3190 ||||||||||||
    single-threaded vector    4339 |||||||||||||||||
  Stream Add
    single-threaded scalar    3828 |||||||||||||||
    single-threaded vector    6083 ||||||||||||||||||||||||
  Stream Triad
    single-threaded scalar    3721 ||||||||||||||
    single-threaded vector    4492 |||||||||||||||||

Integer Score:                2213 ||||||||
Floating Point Score:         4378 |||||||||||||||||
Memory Score:                 4319 |||||||||||||||||
Stream Score:                 4248 ||||||||||||||||

Overall Geekbench Score:      3595 ||||||||||||||
Overall, the VPS has really good disk I/O as well as network connection speed. One CPU core might be a slight drawback on the VPS and as a results, the benchmark tests are not necessarily that great. However, overall I can definitely say this VPS is fast and stable as well.
Customer Service and Support
I do not really think I have had any problem with the VPS that warrants me to send in a ticket so far, and my only ticket sent to their technical support department was to ask about the port speed, the ticket was sent in at 8:23am and was responded by 8:25am, barely 2 minutes later, and best of all, when I confirmed I would like a port speed upgrade for free at 9:04am, the ticket was responded by both Paul and Vince from their technical support 2 minutes later at 9:06am. For an self-managed VPS service, I have to say their speed of support is definitely at the premium level.
Conclusion
Fast and stable VPS, together with really speedy support. I have to say that RocketVPS has continued the legacy of its parent company, Knownhost. I am pleased with the service so far with RocketVPS and have put up some of my production websites to this little VPS after testing them for a while (I have set up a UptimeRobot monitoring on the VPS and I have yet to receive any downtime alert on the VPS) . For a premium service at such low price, I definitely have the intention to stay with them for a long time.