
96MB Low End VPS Review Part 46 – Inception Hosting Take Three!
Anthony emailed me a long time ago before InceptionHosting even started to offer hosting in the continental US for a review on their Phoenix node, however I was too busy with all other stuff in life (if you have noticed recently, my posting rate on 96MB is decreasing drastically) until Anthony basically gave up waiting for me on that review (sorry Anthony!) and asked me to review the new node he set up in Netherlands. Unfortunately, although I have done the data collection work like months ago, I did not get a chance to write this review until now. Therefore, without further delay, let’s take a look at how the new service is doing.
Note that this won’t be a full review since Inception Hosting has been featured quite a few times on 96MB (more specifically here and here) and therefore I will only focus on the recent changes as well as the performance on this new node.
Basic Information and Set Up
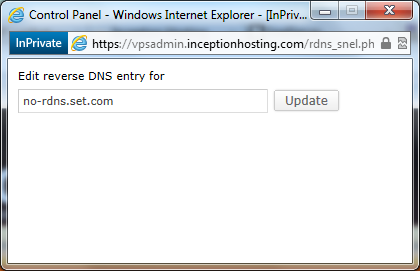
Since the last review, Inception Hosting has made quite a few changes. For one thing, instant rDNS is now available on their VPS! Finally no more ticketing to customer support whenever you need to make some changes to the rDNS. For someone like me, who enjoys trying and putting up different stuff on different servers just for fun, this is something that I appreciate.
As for the OS templates, there are still quite a few templates available, however I really hope Debian 4 could somehow have a 62 bit OS template for us to play around with (take a look at the bottom of the first screenshot below):

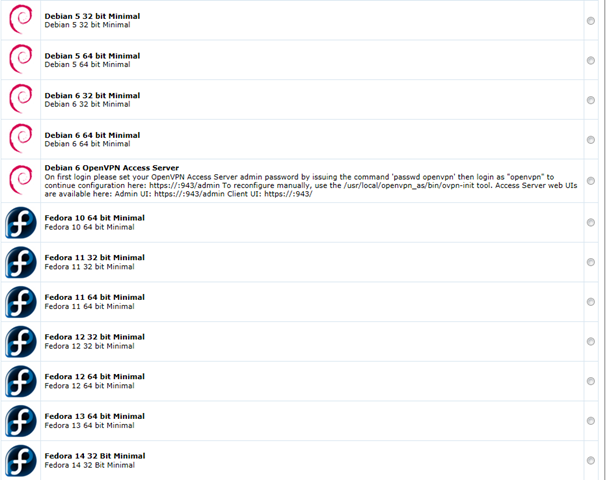
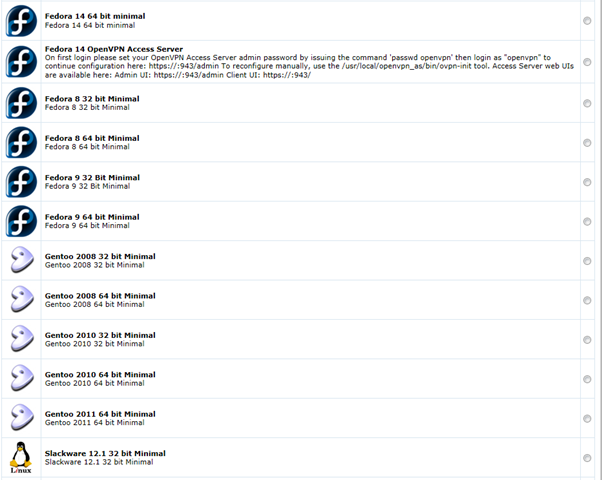

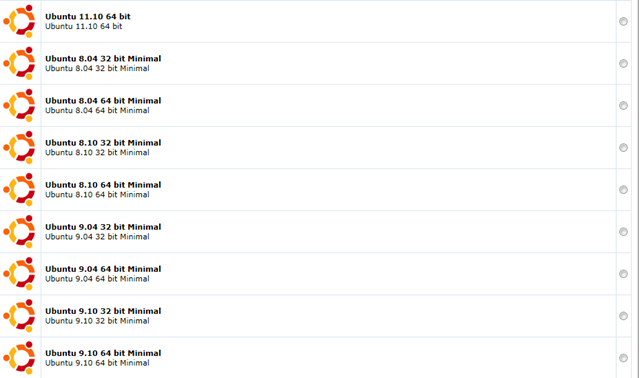
Jokes aside, I think it is a great idea that they have several OpenVPN access templates, since many people primarily use the low end boxes for VPS purposes, and it would be a great idea if people do not need to set up their own OpenVPN software, which could be pretty daunting to some Linux newbies. Also, the OpenVPN templates actually provided a pretty neat web GUI, which is definitely a plus.
Furthermore, they have now started to offer 5GB (which was mentioned here and in the Welcome email as well, although LowEndBox seems to mention that the backup space is 15GB according to the post here) of free backup space with every single VPS and all you need is to send in a ticket to ask.
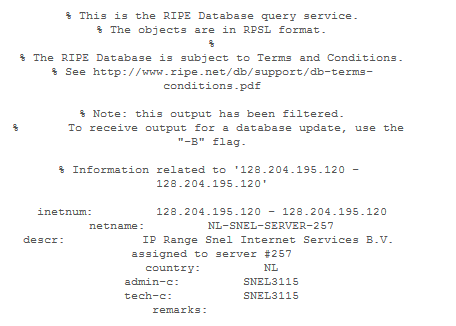
From the whois check on the test IP, it appears that they are still using the IP addresses from SnelServers in Netherlands and they have IPv6 addresses available as well.
There are a few things that remains the same though, provision is still instant, although the email has got a bit longer with quite a bit of information compare to a standard Welcome email sent from WHMCS:
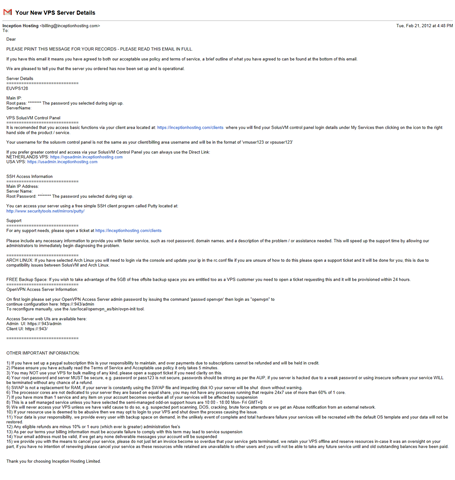
As you can see, first all the passwords were masked in the email and the only hint offered is “the password you used to sign up”, although you can retrieve those information from the control panel in WHMCS. Besides this, there is a session of the information email dedicated to OpenVPN server set up, which is pretty convenient for those who plan to use the box as an OpenVPN server. There is a line specifically for the ArchLinux users and one line on how to request for 5GB of backup space. Finally, there is a detailed fine print outlining several dos and don’ts of using their services. Finally, the way that they are starting to name the SolusVM users are pretty different than before as well, rather than vmuserxxxx, they now start to name them like nlvpsxxx, which has not been updated yet on the welcome email. The product names have been updated though, with those NL-based services named as EUVPS.
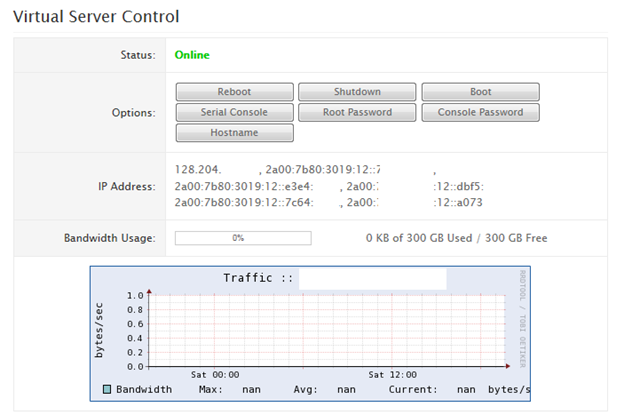
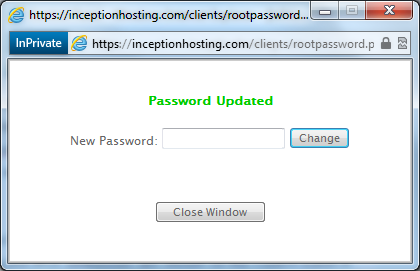
Both SolusVM control panel and the WHMCS system are using the secured HTTP access, which Anthony has fixed shortly after the first 96MB review on them. Right now both the IPv6 addresses and IPv4 addresses are shown on the control panel in WHMCS and the buttons on the control panel in WHMCS work fine as well (although you will always need to reboot the VPS after changing the root password):
Test on the VPS
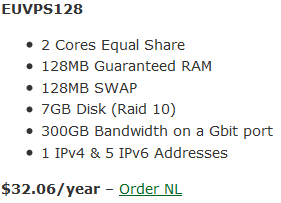
The VPS that I have received for testing, as per their advertisement on LowEndBox here, has 128MB of RAM, 7GB of hard drive space and 300GB of bandwidth, and it is based in SnelServers DC in Netherlands. Debian 6 32 bit minimal was used for testing purposes. Obviously, the VPS is using Xen virtulization technology, which is pretty much what every single VPS sold by Inception Hosting is using.
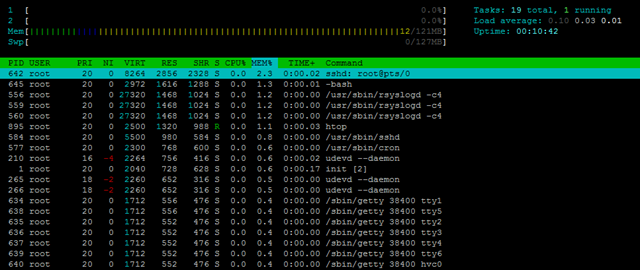
When the VPS was first set up, about 11MB of RAM was used:
free -m
             total       used       free     shared    buffers     cached
Mem:           121         94         26          0          4         78
-/+ buffers/cache:         11        109
Swap:          127          0        127
The corresponding top output:
top - 21:58:53 up 9 min,  1 user,  load average: 0.00, 0.00, 0.00
Tasks:  52 total,   1 running,  51 sleeping,   0 stopped,   0 zombie
Cpu(s):  0.0%us,  0.0%sy,  0.0%ni,100.0%id,  0.0%wa,  0.0%hi,  0.0%si,  0.0%st
Mem:    124256k total,    97348k used,    26908k free,     4504k buffers
Swap:   131064k total,        0k used,   131064k free,    80784k cached

  PID USER      PR  NI  VIRT  RES  SHR S %CPU %MEM    TIME+  COMMAND
  642 root      20   0  8264 2856 2328 S    0  2.3   0:00.01 sshd
  645 root      20   0  2972 1616 1288 S    0  1.3   0:00.01 bash
  556 root      20   0 27320 1480 1024 S    0  1.2   0:00.00 rsyslogd
  655 root      20   0  2340 1116  896 R    0  0.9   0:00.00 top
  584 root      20   0  5500  980  584 S    0  0.8   0:00.00 sshd
  577 root      20   0  2300  768  600 S    0  0.6   0:00.00 cron
  210 root      16  -4  2264  756  416 S    0  0.6   0:00.02 udevd
    1 root      20   0  2040  728  628 S    0  0.6   0:00.17 init
  265 root      18  -2  2260  652  316 S    0  0.5   0:00.00 udevd
  266 root      18  -2  2260  652  316 S    0  0.5   0:00.00 udevd
  634 root      20   0  1712  556  476 S    0  0.4   0:00.00 getty
  638 root      20   0  1712  556  476 S    0  0.4   0:00.00 getty
  635 root      20   0  1712  552  476 S    0  0.4   0:00.00 getty
  636 root      20   0  1712  552  476 S    0  0.4   0:00.00 getty
  637 root      20   0  1712  552  476 S    0  0.4   0:00.00 getty
  639 root      20   0  1712  552  476 S    0  0.4   0:00.00 getty
  640 root      20   0  1712  552  476 S    0  0.4   0:00.00 getty
As you can see, the usual Apache2 processes that are seen in a regular Debian 6 template is not there, which seems to indicate this template is really “clean”.
And htop output for htop fans:
About 850MB of hard drive space were taken:
df -h
Filesystem            Size  Used Avail Use% Mounted on
/dev/xvda1            6.9G  854M  5.8G  13% /
tmpfs                  61M     0   61M   0% /lib/init/rw
udev                   51M   24K   51M   1% /dev
tmpfs                  61M  4.0K   61M   1% /dev/shm
The iNodes are set to pretty decent values:
df -i
Filesystem            Inodes   IUsed   IFree IUse% Mounted on
/dev/xvda1            917504   21955  895549    3% /
tmpfs                  15532       4   15528    1% /lib/init/rw
udev                   12926     393   12533    4% /dev
tmpfs                  15532       3   15529    1% /dev/shm
Interestingly, when the full LNMP stack was set up, the VPS actually did not see a huge increase in the RAM usage and is, pretty amazingly, only used 28MB of RAM:
free -m
             total       used       free     shared    buffers     cached
Mem:           121        118          2          0          4         85
-/+ buffers/cache:         28         92
Swap:          127          4        123
As you can see, there is very little Swap space being used as well.
The corresponding top output showing all the processes running:
top - 07:53:53 up  2:04,  2 users,  load average: 0.04, 0.01, 0.00
Tasks:  64 total,   1 running,  63 sleeping,   0 stopped,   0 zombie
Cpu(s):  0.0%us,  0.0%sy,  0.0%ni,100.0%id,  0.0%wa,  0.0%hi,  0.0%si,  0.0%st
Mem:    124256k total,   121772k used,     2484k free,     4552k buffers
Swap:   131064k total,     4376k used,   126688k free,    87568k cached

  PID USER      PR  NI  VIRT  RES  SHR S %CPU %MEM    TIME+  COMMAND
 2069 www       20   0 15016  10m  440 S    0  8.9   0:00.00 nginx
 2060 root      20   0 22632 4556 1412 S    0  3.7   0:00.47 php-cgi
 2061 www       20   0 22632 4160 1016 S    0  3.3   0:00.00 php-cgi
 2062 www       20   0 22632 4160 1016 S    0  3.3   0:00.00 php-cgi
 2063 www       20   0 22632 4160 1016 S    0  3.3   0:00.00 php-cgi
 2064 www       20   0 22632 4160 1016 S    0  3.3   0:00.00 php-cgi
 2065 www       20   0 22632 4160 1016 S    0  3.3   0:00.00 php-cgi
 2113 root      20   0  8268 2888 2372 S    0  2.3   0:00.05 sshd
 2116 root      20   0  2976 1636 1308 S    0  1.3   0:00.00 bash
 2123 root      20   0  2344 1136  908 R    0  0.9   0:00.00 top
14593 mysql     20   0 33948 1048   36 S    0  0.8   0:00.00 mysqld
  642 root      20   0  8404  992  712 S    0  0.8   0:00.87 sshd
 2068 root      20   0  4804  732  272 S    0  0.6   0:00.00 nginx
  556 root      20   0 27320  696  464 S    0  0.6   0:00.02 rsyslogd
  645 root      20   0  2972  524  380 S    0  0.4   0:00.01 bash
14491 root      20   0  1760  484  480 S    0  0.4   0:00.00 mysqld_safe
  584 root      20   0  5500  324  224 S    0  0.3   0:00.00 sshd
Unfortunately I forgot to take a screenshot of the htop output and did not remember that until the VPS was cancelled, however I guess most of the information you need, if not all of them, are already shown in the top output. Apologies to the htop fans.
2.1GB of hard drive space was used:
Filesystem            Size  Used Avail Use% Mounted on
/dev/xvda1            6.9G  2.1G  4.6G  31% /
tmpfs                  61M     0   61M   0% /lib/init/rw
udev                   51M   24K   51M   1% /dev
tmpfs                  61M  4.0K   61M   1% /dev/shm
And about 8% of iNodes were taken:
 df -i
Filesystem            Inodes   IUsed   IFree IUse% Mounted on
/dev/xvda1            917504   69171  848333    8% /
tmpfs                  15532       4   15528    1% /lib/init/rw
udev                   12926     393   12533    4% /dev
tmpfs                  15532       3   15529    1% /dev/shm
Uptime shows the VPS is mostly idle:
uptime
 12:50:36 up  7:01,  2 users,  load average: 0.00, 0.00, 0.00
Which is confirmed by the output of vmstat:
vmstat
procs -----------memory---------- ---swap-- -----io---- -system-- ----cpu----
 r  b   swpd   free   buff  cache   si   so    bi    bo   in   cs us sy id wa
 0  0  21412   2848    992 100916    0    0    12    98  126  462  4  6 89  1
CPUinfo shows there are two CPU cores available, none of them are throttled:
cat /proc/cpuinfo
processor       : 0
vendor_id       : GenuineIntel
cpu family      : 6
model           : 42
model name      : Intel(R) Xeon(R) CPU E31270 @ 3.40GHz
stepping        : 7
cpu MHz         : 3392.332
cache size      : 8192 KB
fdiv_bug        : no
hlt_bug         : no
f00f_bug        : no
coma_bug        : no
fpu             : yes
fpu_exception   : yes
cpuid level     : 13
wp              : yes
flags           : fpu de tsc msr pae cx8 sep cmov pat clflush mmx fxsr sse sse2 ss ht nx constant_tsc aperfmperf pni pclmulqdq ssse3 sse4_1 sse4_2 x2apic popcnt hypervisor ida arat
bogomips        : 6784.66
clflush size    : 64
cache_alignment : 64
address sizes   : 36 bits physical, 48 bits virtual
power management:

processor       : 1
vendor_id       : GenuineIntel
cpu family      : 6
model           : 42
model name      : Intel(R) Xeon(R) CPU E31270 @ 3.40GHz
stepping        : 7
cpu MHz         : 3392.332
cache size      : 8192 KB
fdiv_bug        : no
hlt_bug         : no
f00f_bug        : no
coma_bug        : no
fpu             : yes
fpu_exception   : yes
cpuid level     : 13
wp              : yes
flags           : fpu de tsc msr pae cx8 sep cmov pat clflush mmx fxsr sse sse2 ss ht nx constant_tsc aperfmperf pni pclmulqdq ssse3 sse4_1 sse4_2 x2apic popcnt hypervisor ida arat
bogomips        : 6784.66
clflush size    : 64
cache_alignment : 64
address sizes   : 36 bits physical, 48 bits virtual
power management:
The CPU is E3-1270 at 3.4GHz, which is pretty fast and the fact that you could use it to the fullest extent is definitely something great.
The output of meminfo:
cat /proc/meminfo
MemTotal:         124256 kB
MemFree:            3936 kB
Buffers:            1584 kB
Cached:            86332 kB
SwapCached:         1372 kB
Active:            13768 kB
Inactive:          96996 kB
Active(anon):        164 kB
Inactive(anon):    22712 kB
Active(file):      13604 kB
Inactive(file):    74284 kB
Unevictable:           0 kB
Mlocked:               0 kB
HighTotal:             0 kB
HighFree:              0 kB
LowTotal:         124256 kB
LowFree:            3936 kB
SwapTotal:        131064 kB
SwapFree:         125776 kB
Dirty:               456 kB
Writeback:             0 kB
AnonPages:         21828 kB
Mapped:             7044 kB
Shmem:                12 kB
Slab:               6344 kB
SReclaimable:       3924 kB
SUnreclaim:         2420 kB
KernelStack:         528 kB
PageTables:          860 kB
NFS_Unstable:          0 kB
Bounce:                0 kB
WritebackTmp:          0 kB
CommitLimit:      193192 kB
Committed_AS:     105824 kB
VmallocTotal:     729080 kB
VmallocUsed:         932 kB
VmallocChunk:     727960 kB
HardwareCorrupted:     0 kB
HugePages_Total:       0
HugePages_Free:        0
HugePages_Rsvd:        0
HugePages_Surp:        0
Hugepagesize:       2048 kB
DirectMap4k:      131072 kB
DirectMap2M:           0 kB
As well as the output of time sync:
time sync

real    0m0.073s
user    0m0.004s
sys     0m0.000s
Network continues to be one of the most impressive area of Inception Hosting and I think their Gigabit ports are really one of their greatest selling points. For a Cachefly download test, I was able to get close to 50MB/s pretty easily:
 wget http://cachefly.cachefly.net/100mb.test -O /dev/null
--2012-02-22 08:59:26--  http://cachefly.cachefly.net/100mb.test
Resolving cachefly.cachefly.net... 205.234.175.175
Connecting to cachefly.cachefly.net|205.234.175.175|:80... connected.
HTTP request sent, awaiting response... 200 OK
Length: 104857600 (100M) [application/octet-stream]
Saving to: `/dev/null'

100%[======================================>] 104,857,600 44.7M/s   in 2.2s

2012-02-22 08:59:28 (44.7 MB/s) - `/dev/null' saved [104857600/104857600]
Testing again later on showed somewhat better results:
 wget cachefly.cachefly.net/100mb.test -O /dev/null
--2012-02-22 11:22:10--  http://cachefly.cachefly.net/100mb.test
Resolving cachefly.cachefly.net... 205.234.175.175
Connecting to cachefly.cachefly.net|205.234.175.175|:80... connected.
HTTP request sent, awaiting response... 200 OK
Length: 104857600 (100M) [application/octet-stream]
Saving to: `/dev/null'

100%[======================================>] 104,857,600 46.8M/s   in 2.1s

2012-02-22 11:22:13 (46.8 MB/s) - `/dev/null' saved [104857600/104857600]
Anthony has mentioned before for a Gbit port speed, the threaded wget is no longer a good test and hence I have used the aget (always need to apply a patch in Debian in order to get aget compiled, which is always a pain. Anybody knows a Debian repo where I can download aget pre-compiled?) and a 1GB test package to see how fast this VPS would run.
The first test is using a 1GB test file from ThinkBroadBand, which is located in London, UK:
aget -n10 http://ipv4.download.thinkbroadband.com/1GB.zip      Attempting to read log file aget-1GB.zip.log for resuming download job...
 Couldn't find log file for this download, starting a clean job...
 Head-Request Connection established
 Downloading /1GB.zip (1073741824 bytes) from site ipv4.download.thinkbroadband.com(80.249.99.148:80). Number of Threads: 10
..                                                 [4% completed]
.....                                              [9% completed]
.......                                            [14% completed]
..........                                         [19% completed]
..........                                         [19% completed]
............                                       [24% completed]
...............                                    [29% completed]
.................                                  [34% completed]
....................                               [39% completed]
......................                             [44% completed]
.........................                          [49% completed]
...........................                        [54% completed]
..............................                     [59% completed]
................................                   [64% completed]
...................................                [69% completed]
.....................................              .....................................              [74% completed]
[74% completed]
........................................           [79% completed]
..........................................         [84% completed]
....................................................................      [89% completed]
......................      [89% completed]
...............................................    [94% completed]
.................................................. [99% completed]
.................................................. [100% completed]
 Download completed, job completed in 42 seconds. (24966 Kb/sec)
 Shutting down...
As you can see, the job was completed with close to 25Mbit of speed, which is pretty good considering those ThinkBroadband files are normally downloaded pretty slowly.
I have also tried to use the test file from HostDime in Orlando, Florida, which is a bit slower but still reasonable considering it is on the other end of Atlantic Ocean:
aget -n10 http://72.29.87.105/%7Ephpinfot/1gbfile.tgz
 Attempting to read log file aget-1gbfile.tgz.log for resuming download job...
 Couldn't find log file for this download, starting a clean job...
 Head-Request Connection established
 Downloading /%7Ephpinfot/1gbfile.tgz (1073741824 bytes) from site 72.29.87.105(72.29.87.105:80). Number of Threads: 10
..                                                 [4% completed]
.....                                              [9% completed]
.......                                            [14% completed]
..........                                         [19% completed]
............                                       [24% completed]
...............                                    [29% completed]
.................                                  [34% completed]
....................                               [39% completed]
......................                             [44% completed]
.........................                          [49% completed]
...........................                        [54% completed]
..............................                     [59% completed]
................................                   [64% completed]
...................................                [69% completed]
.....................................              [74% completed]
........................................           [79% completed]
..........................................         [84% completed]
.............................................      [89% completed]
...............................................    [94% completed]
.................................................. [99% completed]
.................................................. [100% completed]
 Download completed, job completed in 196 seconds. (5349 Kb/sec)
 Shutting down...
Quite frankly speaking, I do not think I have even get close to hit the full port speed, however this is definitely a lot faster than many of the 100mbit lines that I have used before.
Upload speed are pretty stable to North America and much faster to the VPS in Europe, which is pretty consistent with what we are expecting.
First the VPS from BuffaloVPS in Chicago, IL:
 wget 128.204.195.120/100mb.test -O /dev/null
--2012-02-22 00:15:45--  http://128.204.195.120/100mb.test
Connecting to 128.204.195.120:80... connected.
HTTP request sent, awaiting response... 200 OK
Length: 104857600 (100M) [application/octet-stream]
Saving to: `/dev/null'

100%[======================================>] 104,857,600 1.31M/s   in 95s

2012-02-22 00:17:21 (1.05 MB/s) - `/dev/null' saved [104857600/104857600]
From my BuyVM VPS in San Jose, CA, the network speed is slightly better:
 wget 128.204.195.120/100mb.test -O /dev/null
--2012-02-22 00:28:09--  http://128.204.195.120/100mb.test
Connecting to 128.204.195.120:80... connected.
HTTP request sent, awaiting response... 200 OK
Length: 104857600 (100M) [application/octet-stream]
Saving to: `/dev/null'

100%[======================================>] 104,857,600 1.56M/s   in 90s

2012-02-22 00:29:39 (1.12 MB/s) - `/dev/null' saved [104857600/104857600]
And the connection to my XenVZ VPS in Maidenhead in UK:
 wget 128.204.195.120/100mb.test -O /dev/null
--2012-02-22 00:28:09--  http://128.204.195.120/100mb.test
Connecting to 128.204.195.120:80... connected.
HTTP request sent, awaiting response... 200 OK
Length: 104857600 (100M) [application/octet-stream]
Saving to: `/dev/null'

100%[======================================>] 104,857,600 1.56M/s   in 90s

2012-02-22 00:29:39 (1.12 MB/s) - `/dev/null' saved [104857600/104857600]
Disk I/O is quite impressive as well on RAID 10 config:
 dd if=/dev/zero of=test bs=64k count=16k conv=fdatasync
16384+0 records in
16384+0 records out
1073741824 bytes (1.1 GB) copied, 6.4797 s, 166 MB/s
As you can see, the I/O speed is again in the 3 digits range, which is quite good.
Test again showed similar results:
dd if=/dev/zero of=test bs=64k count=16k conv=fdatasync
16384+0 records in
16384+0 records out
1073741824 bytes (1.1 GB) copied, 5.67198 s, 189 MB/s
Yes, this is even better than before if the firt one is not too impressive.
Ioping tests, unfortunately, did not show the output to be that stable though:
 ioping -c 10 .
4096 bytes from . (ext3 /dev/xvda1): request=1 time=0.1 ms
4096 bytes from . (ext3 /dev/xvda1): request=2 time=0.2 ms
4096 bytes from . (ext3 /dev/xvda1): request=3 time=22.4 ms
4096 bytes from . (ext3 /dev/xvda1): request=4 time=17.7 ms
4096 bytes from . (ext3 /dev/xvda1): request=5 time=0.2 ms
4096 bytes from . (ext3 /dev/xvda1): request=6 time=0.2 ms
4096 bytes from . (ext3 /dev/xvda1): request=7 time=10.2 ms
4096 bytes from . (ext3 /dev/xvda1): request=8 time=33.3 ms
4096 bytes from . (ext3 /dev/xvda1): request=9 time=0.1 ms
4096 bytes from . (ext3 /dev/xvda1): request=10 time=0.2 ms

--- . (ext3 /dev/xvda1) ioping statistics ---
10 requests completed in 9086.3 ms, 118 iops, 0.5 mb/s
min/avg/max/mdev = 0.1/8.5/33.3/11.5 ms
Trying again basically showed similar results:
ioping -c 10 .
4096 bytes from . (ext3 /dev/xvda1): request=1 time=0.1 ms
4096 bytes from . (ext3 /dev/xvda1): request=2 time=0.2 ms
4096 bytes from . (ext3 /dev/xvda1): request=3 time=0.2 ms
4096 bytes from . (ext3 /dev/xvda1): request=4 time=0.2 ms
4096 bytes from . (ext3 /dev/xvda1): request=5 time=0.2 ms
4096 bytes from . (ext3 /dev/xvda1): request=6 time=3.8 ms
4096 bytes from . (ext3 /dev/xvda1): request=7 time=0.2 ms
4096 bytes from . (ext3 /dev/xvda1): request=8 time=14.0 ms
4096 bytes from . (ext3 /dev/xvda1): request=9 time=17.8 ms
4096 bytes from . (ext3 /dev/xvda1): request=10 time=0.1 ms

--- . (ext3 /dev/xvda1) ioping statistics ---
10 requests completed in 9038.4 ms, 271 iops, 1.1 mb/s
min/avg/max/mdev = 0.1/3.7/17.8/6.2 ms
As you can see, for each of the 10 readings, approximately 8 of them are really good with the remaining two showing rather high ioping values.
Update: As per Anthony’s request, I have re-ran the test on the VPS with 5000 iopings on another test VPS that Anthony gave me and here is the ioping stats:
--- . (ext3 /dev/xvda1) ioping statistics ---
5000 requests completed in 5005308.6 ms, 931 iops, 3.6 mb/s
min/avg/max/mdev = 0.0/1.1/205.0/4.7 ms
And try again:
--- . (ext3 /dev/xvda1) ioping statistics ---
5000 requests completed in 5005030.7 ms, 981 iops, 3.8 mb/s
min/avg/max/mdev = 0.0/1.0/79.3/3.9 ms
As you can see, overall the average ioping speed is pretty statisfactory at about 1ms.
Finally, the benchmarks. With just 2 CPU cores, quite frankly I told myself not to expect too much, however the VPS has achieved a pretty impressive score of more than 1300 points with UnixBench:
   #    #  #    #  #  #    #          #####   ######  #    #   ####   #    #
   #    #  ##   #  #   #  #           #    #  #       ##   #  #    #  #    #
   #    #  # #  #  #    ##            #####   #####   # #  #  #       ######
   #    #  #  # #  #    ##            #    #  #       #  # #  #       #    #
   #    #  #   ##  #   #  #           #    #  #       #   ##  #    #  #    #
    ####   #    #  #  #    #          #####   ######  #    #   ####   #    #

   Version 5.1.3                      Based on the Byte Magazine Unix Benchmark

   Multi-CPU version                  Version 5 revisions by Ian Smith,
                                      Sunnyvale, CA, USA
   January 13, 2011                   johantheghost at yahoo period com

1 x Dhrystone 2 using register variables  1 2 3 4 5 6 7 8 9 10

1 x Double-Precision Whetstone  1 2 3 4 5 6 7 8 9 10

1 x Execl Throughput  1 2 3

1 x File Copy 1024 bufsize 2000 maxblocks  1 2 3

1 x File Copy 256 bufsize 500 maxblocks  1 2 3

1 x File Copy 4096 bufsize 8000 maxblocks  1 2 3

1 x Pipe Throughput  1 2 3 4 5 6 7 8 9 10

1 x Pipe-based Context Switching  1 2 3 4 5 6 7 8 9 10

1 x Process Creation  1 2 3

1 x System Call Overhead  1 2 3 4 5 6 7 8 9 10

1 x Shell Scripts (1 concurrent)  1 2 3

1 x Shell Scripts (8 concurrent)  1 2 3

2 x Dhrystone 2 using register variables  1 2 3 4 5 6 7 8 9 10

2 x Double-Precision Whetstone  1 2 3 4 5 6 7 8 9 10

2 x Execl Throughput  1 2 3

2 x File Copy 1024 bufsize 2000 maxblocks  1 2 3

2 x File Copy 256 bufsize 500 maxblocks  1 2 3

2 x File Copy 4096 bufsize 8000 maxblocks  1 2 3

2 x Pipe Throughput  1 2 3 4 5 6 7 8 9 10

2 x Pipe-based Context Switching  1 2 3 4 5 6 7 8 9 10

2 x Process Creation  1 2 3

2 x System Call Overhead  1 2 3 4 5 6 7 8 9 10

2 x Shell Scripts (1 concurrent)  1 2 3

2 x Shell Scripts (8 concurrent)  1 2 3

========================================================================
   BYTE UNIX Benchmarks (Version 5.1.3)

   System: *******GNU/Linux
   OS: GNU/Linux -- 2.6.32-5-686-bigmem -- #1 SMP Wed Jan 12 04:40:25 UTC 2011
   Machine: i686 (unknown)
   Language: en_US.utf8 (charmap="UTF-8", collate="UTF-8")
   CPU 0: Intel(R) Xeon(R) CPU E31270 @ 3.40GHz (6784.7 bogomips)
          Hyper-Threading, MMX, Physical Address Ext, SYSENTER/SYSEXIT
   CPU 1: Intel(R) Xeon(R) CPU E31270 @ 3.40GHz (6784.7 bogomips)
          Hyper-Threading, MMX, Physical Address Ext, SYSENTER/SYSEXIT
   08:00:17 up  2:10,  2 users,  load average: 0.05, 0.03, 0.00; runlevel 2

------------------------------------------------------------------------
Benchmark Run: Wed Feb 22 2012 08:00:17 - 08:28:29
2 CPUs in system; running 1 parallel copy of tests

Dhrystone 2 using register variables       20212336.2 lps   (10.0 s, 7 samples)
Double-Precision Whetstone                     3269.8 MWIPS (10.0 s, 7 samples)
Execl Throughput                               2291.8 lps   (29.6 s, 2 samples)
File Copy 1024 bufsize 2000 maxblocks        470881.7 KBps  (30.0 s, 2 samples)
File Copy 256 bufsize 500 maxblocks          123071.7 KBps  (30.0 s, 2 samples)
File Copy 4096 bufsize 8000 maxblocks       1383682.4 KBps  (30.0 s, 2 samples)
Pipe Throughput                              733694.7 lps   (10.0 s, 7 samples)
Pipe-based Context Switching                  94064.1 lps   (10.0 s, 7 samples)
Process Creation                               4489.6 lps   (30.0 s, 2 samples)
Shell Scripts (1 concurrent)                   5650.1 lpm   (60.0 s, 2 samples)
Shell Scripts (8 concurrent)                   1097.9 lpm   (60.0 s, 2 samples)
System Call Overhead                         812166.6 lps   (10.0 s, 7 samples)

System Benchmarks Index Values               BASELINE       RESULT    INDEX
Dhrystone 2 using register variables         116700.0   20212336.2   1732.0
Double-Precision Whetstone                       55.0       3269.8    594.5
Execl Throughput                                 43.0       2291.8    533.0
File Copy 1024 bufsize 2000 maxblocks          3960.0     470881.7   1189.1
File Copy 256 bufsize 500 maxblocks            1655.0     123071.7    743.6
File Copy 4096 bufsize 8000 maxblocks          5800.0    1383682.4   2385.7
Pipe Throughput                               12440.0     733694.7    589.8
Pipe-based Context Switching                   4000.0      94064.1    235.2
Process Creation                                126.0       4489.6    356.3
Shell Scripts (1 concurrent)                     42.4       5650.1   1332.6
Shell Scripts (8 concurrent)                      6.0       1097.9   1829.8
System Call Overhead                          15000.0     812166.6    541.4
                                                                   ========
System Benchmarks Index Score                                         806.3

------------------------------------------------------------------------
Benchmark Run: Wed Feb 22 2012 08:28:29 - 08:56:42
2 CPUs in system; running 2 parallel copies of tests

Dhrystone 2 using register variables       39659790.4 lps   (10.0 s, 7 samples)
Double-Precision Whetstone                     6514.1 MWIPS (10.0 s, 7 samples)
Execl Throughput                               4587.0 lps   (30.0 s, 2 samples)
File Copy 1024 bufsize 2000 maxblocks        658848.9 KBps  (30.0 s, 2 samples)
File Copy 256 bufsize 500 maxblocks          170370.4 KBps  (30.0 s, 2 samples)
File Copy 4096 bufsize 8000 maxblocks       2083814.6 KBps  (30.0 s, 2 samples)
Pipe Throughput                             1441956.5 lps   (10.0 s, 7 samples)
Pipe-based Context Switching                 182238.9 lps   (10.0 s, 7 samples)
Process Creation                               8136.3 lps   (30.0 s, 2 samples)
Shell Scripts (1 concurrent)                   8447.7 lpm   (60.0 s, 2 samples)
Shell Scripts (8 concurrent)                   1118.2 lpm   (60.1 s, 2 samples)
System Call Overhead                        1529474.5 lps   (10.0 s, 7 samples)

System Benchmarks Index Values               BASELINE       RESULT    INDEX
Dhrystone 2 using register variables         116700.0   39659790.4   3398.4
Double-Precision Whetstone                       55.0       6514.1   1184.4
Execl Throughput                                 43.0       4587.0   1066.7
File Copy 1024 bufsize 2000 maxblocks          3960.0     658848.9   1663.8
File Copy 256 bufsize 500 maxblocks            1655.0     170370.4   1029.4
File Copy 4096 bufsize 8000 maxblocks          5800.0    2083814.6   3592.8
Pipe Throughput                               12440.0    1441956.5   1159.1
Pipe-based Context Switching                   4000.0     182238.9    455.6
Process Creation                                126.0       8136.3    645.7
Shell Scripts (1 concurrent)                     42.4       8447.7   1992.4
Shell Scripts (8 concurrent)                      6.0       1118.2   1863.7
System Call Overhead                          15000.0    1529474.5   1019.6
                                                                   ========
System Benchmarks Index Score                                        1342.0
Testing again showed almost the same score:
   #    #  #    #  #  #    #          #####   ######  #    #   ####   #    #
   #    #  ##   #  #   #  #           #    #  #       ##   #  #    #  #    #
   #    #  # #  #  #    ##            #####   #####   # #  #  #       ######
   #    #  #  # #  #    ##            #    #  #       #  # #  #       #    #
   #    #  #   ##  #   #  #           #    #  #       #   ##  #    #  #    #
    ####   #    #  #  #    #          #####   ######  #    #   ####   #    #

   Version 5.1.3                      Based on the Byte Magazine Unix Benchmark

   Multi-CPU version                  Version 5 revisions by Ian Smith,
                                      Sunnyvale, CA, USA
   January 13, 2011                   johantheghost at yahoo period com

1 x Dhrystone 2 using register variables  1 2 3 4 5 6 7 8 9 10

1 x Double-Precision Whetstone  1 2 3 4 5 6 7 8 9 10

1 x Execl Throughput  1 2 3

1 x File Copy 1024 bufsize 2000 maxblocks  1 2 3

1 x File Copy 256 bufsize 500 maxblocks  1 2 3

1 x File Copy 4096 bufsize 8000 maxblocks  1 2 3

1 x Pipe Throughput  1 2 3 4 5 6 7 8 9 10

1 x Pipe-based Context Switching  1 2 3 4 5 6 7 8 9 10

1 x Process Creation  1 2 3

1 x System Call Overhead  1 2 3 4 5 6 7 8 9 10

1 x Shell Scripts (1 concurrent)  1 2 3

1 x Shell Scripts (8 concurrent)  1 2 3

2 x Dhrystone 2 using register variables  1 2 3 4 5 6 7 8 9 10

2 x Double-Precision Whetstone  1 2 3 4 5 6 7 8 9 10

2 x Execl Throughput  1 2 3

2 x File Copy 1024 bufsize 2000 maxblocks  1 2 3

2 x File Copy 256 bufsize 500 maxblocks  1 2 3

2 x File Copy 4096 bufsize 8000 maxblocks  1 2 3

2 x Pipe Throughput  1 2 3 4 5 6 7 8 9 10

2 x Pipe-based Context Switching  1 2 3 4 5 6 7 8 9 10

2 x Process Creation  1 2 3

2 x System Call Overhead  1 2 3 4 5 6 7 8 9 10

2 x Shell Scripts (1 concurrent)  1 2 3

2 x Shell Scripts (8 concurrent)  1 2 3

========================================================================
   BYTE UNIX Benchmarks (Version 5.1.3)

   System: ******: GNU/Linux
   OS: GNU/Linux -- 2.6.32-5-686-bigmem -- #1 SMP Wed Jan 12 04:40:25 UTC 2011
   Machine: i686 (unknown)
   Language: en_US.utf8 (charmap="UTF-8", collate="UTF-8")
   CPU 0: Intel(R) Xeon(R) CPU E31270 @ 3.40GHz (6784.7 bogomips)
          Hyper-Threading, MMX, Physical Address Ext, SYSENTER/SYSEXIT
   CPU 1: Intel(R) Xeon(R) CPU E31270 @ 3.40GHz (6784.7 bogomips)
          Hyper-Threading, MMX, Physical Address Ext, SYSENTER/SYSEXIT
   09:10:22 up  3:20,  1 user,  load average: 0.00, 0.43, 1.42; runlevel 2

------------------------------------------------------------------------
Benchmark Run: Wed Feb 22 2012 09:10:22 - 09:38:35
2 CPUs in system; running 1 parallel copy of tests

Dhrystone 2 using register variables       20349758.2 lps   (10.0 s, 7 samples)
Double-Precision Whetstone                     3282.0 MWIPS (10.0 s, 7 samples)
Execl Throughput                               2324.2 lps   (30.0 s, 2 samples)
File Copy 1024 bufsize 2000 maxblocks        471254.0 KBps  (30.0 s, 2 samples)
File Copy 256 bufsize 500 maxblocks          123902.7 KBps  (30.0 s, 2 samples)
File Copy 4096 bufsize 8000 maxblocks       1374633.1 KBps  (30.0 s, 2 samples)
Pipe Throughput                              737768.7 lps   (10.0 s, 7 samples)
Pipe-based Context Switching                  93700.2 lps   (10.0 s, 7 samples)
Process Creation                               4681.5 lps   (30.0 s, 2 samples)
Shell Scripts (1 concurrent)                   5621.9 lpm   (60.0 s, 2 samples)
Shell Scripts (8 concurrent)                   1100.9 lpm   (60.0 s, 2 samples)
System Call Overhead                         810463.8 lps   (10.0 s, 7 samples)

System Benchmarks Index Values               BASELINE       RESULT    INDEX
Dhrystone 2 using register variables         116700.0   20349758.2   1743.8
Double-Precision Whetstone                       55.0       3282.0    596.7
Execl Throughput                                 43.0       2324.2    540.5
File Copy 1024 bufsize 2000 maxblocks          3960.0     471254.0   1190.0
File Copy 256 bufsize 500 maxblocks            1655.0     123902.7    748.7
File Copy 4096 bufsize 8000 maxblocks          5800.0    1374633.1   2370.1
Pipe Throughput                               12440.0     737768.7    593.1
Pipe-based Context Switching                   4000.0      93700.2    234.3
Process Creation                                126.0       4681.5    371.5
Shell Scripts (1 concurrent)                     42.4       5621.9   1325.9
Shell Scripts (8 concurrent)                      6.0       1100.9   1834.9
System Call Overhead                          15000.0     810463.8    540.3
                                                                   ========
System Benchmarks Index Score                                         810.7

------------------------------------------------------------------------
Benchmark Run: Wed Feb 22 2012 09:38:35 - 10:06:46
2 CPUs in system; running 2 parallel copies of tests

Dhrystone 2 using register variables       40063735.7 lps   (10.0 s, 7 samples)
Double-Precision Whetstone                     6542.4 MWIPS (10.0 s, 7 samples)
Execl Throughput                               4642.2 lps   (30.0 s, 2 samples)
File Copy 1024 bufsize 2000 maxblocks        673433.2 KBps  (30.0 s, 2 samples)
File Copy 256 bufsize 500 maxblocks          172740.2 KBps  (30.0 s, 2 samples)
File Copy 4096 bufsize 8000 maxblocks       2092494.4 KBps  (30.0 s, 2 samples)
Pipe Throughput                             1460650.1 lps   (10.0 s, 7 samples)
Pipe-based Context Switching                 184551.3 lps   (10.0 s, 7 samples)
Process Creation                               8563.8 lps   (30.0 s, 2 samples)
Shell Scripts (1 concurrent)                   8608.1 lpm   (60.0 s, 2 samples)
Shell Scripts (8 concurrent)                   1124.4 lpm   (60.0 s, 2 samples)
System Call Overhead                        1540154.0 lps   (10.0 s, 7 samples)

System Benchmarks Index Values               BASELINE       RESULT    INDEX
Dhrystone 2 using register variables         116700.0   40063735.7   3433.1
Double-Precision Whetstone                       55.0       6542.4   1189.5
Execl Throughput                                 43.0       4642.2   1079.6
File Copy 1024 bufsize 2000 maxblocks          3960.0     673433.2   1700.6
File Copy 256 bufsize 500 maxblocks            1655.0     172740.2   1043.7
File Copy 4096 bufsize 8000 maxblocks          5800.0    2092494.4   3607.7
Pipe Throughput                               12440.0    1460650.1   1174.2
Pipe-based Context Switching                   4000.0     184551.3    461.4
Process Creation                                126.0       8563.8    679.7
Shell Scripts (1 concurrent)                     42.4       8608.1   2030.2
Shell Scripts (8 concurrent)                      6.0       1124.4   1874.0
System Call Overhead                          15000.0    1540154.0   1026.8
                                                                   ========
System Benchmarks Index Score                                        1361.6
GeekBench results are also very encouraging, with scores above 6500 points:
System Information
  Platform:                  Linux x86 (32-bit)
  Compiler:                  GCC 4.1.2 20070925 (Red Hat 4.1.2-33)
  Operating System:          Linux 2.6.32-5-686-bigmem i686
  Model:                     Linux PC (Intel(R) Xeon(R) CPU E31270 @ 3.40GHz)
  Motherboard:               Unknown Motherboard
  Processor:                 Intel(R) Xeon(R) CPU E31270 @ 3.40GHz
  Processor ID:              GenuineIntel Family 6 Model 42 Stepping 7
  Logical Processors:        2
  Physical Processors:       1
  Processor Frequency:       3.39 GHz
  L1 Instruction Cache:      0.00 B
  L1 Data Cache:             0.00 B
  L2 Cache:                  256 KB
  L3 Cache:                  0.00 B
  Bus Frequency:             0.00 Hz
  Memory:                    121 MB
  Memory Type:               N/A
  SIMD:                      1
  BIOS:                      N/A
  Processor Model:                     Intel(R) Xeon(R) CPU E31270 @ 3.40GHz
  Processor Cores:           2

Integer
  Blowfish
    single-threaded scalar    2192 ||||||||
    multi-threaded scalar     4052 ||||||||||||||||
  Text Compress
    single-threaded scalar    2915 |||||||||||
    multi-threaded scalar     5353 |||||||||||||||||||||
  Text Decompress
    single-threaded scalar    3198 ||||||||||||
    multi-threaded scalar     6228 ||||||||||||||||||||||||
  Image Compress
    single-threaded scalar    2502 ||||||||||
    multi-threaded scalar     3557 ||||||||||||||
  Image Decompress
    single-threaded scalar    2322 |||||||||
    multi-threaded scalar     2900 |||||||||||
  Lua
    single-threaded scalar    4175 ||||||||||||||||
    multi-threaded scalar     7907 |||||||||||||||||||||||||||||||

Floating Point
  Mandelbrot
    single-threaded scalar    2824 |||||||||||
    multi-threaded scalar     5587 ||||||||||||||||||||||
  Dot Product
    single-threaded scalar    4631 ||||||||||||||||||
    multi-threaded scalar     8169 ||||||||||||||||||||||||||||||||
    single-threaded vector    5527 ||||||||||||||||||||||
    multi-threaded vector     8969 |||||||||||||||||||||||||||||||||||
  LU Decomposition
    single-threaded scalar    3539 ||||||||||||||
    multi-threaded scalar     3565 ||||||||||||||
  Primality Test
    single-threaded scalar    4912 |||||||||||||||||||
    multi-threaded scalar     7433 |||||||||||||||||||||||||||||
  Sharpen Image
    single-threaded scalar   10903 |||||||||||||||||||||||||||||||||||||||||||
    multi-threaded scalar    15191 ||||||||||||||||||||||||||||||||||||||||||||||||||||||||||||
  Blur Image
    single-threaded scalar    8531 ||||||||||||||||||||||||||||||||||
    multi-threaded scalar    15141 ||||||||||||||||||||||||||||||||||||||||||||||||||||||||||||

Memory
  Read Sequential
    single-threaded scalar    7484 |||||||||||||||||||||||||||||
  Write Sequential
    single-threaded scalar   11466 |||||||||||||||||||||||||||||||||||||||||||||
  Stdlib Allocate
    single-threaded scalar    4949 |||||||||||||||||||
  Stdlib Write
    single-threaded scalar    7966 |||||||||||||||||||||||||||||||
  Stdlib Copy
    single-threaded scalar   16052 ||||||||||||||||||||||||||||||||||||||||||||||||||||||||||||||||

Stream
  Stream Copy
    single-threaded scalar    6299 |||||||||||||||||||||||||
    single-threaded vector    7382 |||||||||||||||||||||||||||||
  Stream Scale
    single-threaded scalar    6842 |||||||||||||||||||||||||||
    single-threaded vector    7254 |||||||||||||||||||||||||||||
  Stream Add
    single-threaded scalar    6126 ||||||||||||||||||||||||
    single-threaded vector    6980 |||||||||||||||||||||||||||
  Stream Triad
    single-threaded scalar    6555 ||||||||||||||||||||||||||
    single-threaded vector    4742 ||||||||||||||||||

Integer Score:                3941 |||||||||||||||
Floating Point Score:         7494 |||||||||||||||||||||||||||||
Memory Score:                 9583 ||||||||||||||||||||||||||||||||||||||
Stream Score:                 6522 ||||||||||||||||||||||||||

Overall Geekbench Score:      6571 ||||||||||||||||||||||||||
Testing again showed similar results as well:
System Information
  Platform:                  Linux x86 (32-bit)
  Compiler:                  GCC 4.1.2 20070925 (Red Hat 4.1.2-33)
  Operating System:          Linux 2.6.32-5-686-bigmem i686
  Model:                     Linux PC (Intel(R) Xeon(R) CPU E31270 @ 3.40GHz)
  Motherboard:               Unknown Motherboard
  Processor:                 Intel(R) Xeon(R) CPU E31270 @ 3.40GHz
  Processor ID:              GenuineIntel Family 6 Model 42 Stepping 7
  Logical Processors:        2
  Physical Processors:       1
  Processor Frequency:       3.39 GHz
  L1 Instruction Cache:      0.00 B
  L1 Data Cache:             0.00 B
  L2 Cache:                  256 KB
  L3 Cache:                  0.00 B
  Bus Frequency:             0.00 Hz
  Memory:                    121 MB
  Memory Type:               N/A
  SIMD:                      1
  BIOS:                      N/A
  Processor Model:                     Intel(R) Xeon(R) CPU E31270 @ 3.40GHz
  Processor Cores:           2

Integer
  Blowfish
    single-threaded scalar    2195 ||||||||
    multi-threaded scalar     4187 ||||||||||||||||
  Text Compress
    single-threaded scalar    2962 |||||||||||
    multi-threaded scalar     5440 |||||||||||||||||||||
  Text Decompress
    single-threaded scalar    3198 ||||||||||||
    multi-threaded scalar     5931 |||||||||||||||||||||||
  Image Compress
    single-threaded scalar    2494 |||||||||
    multi-threaded scalar     3912 |||||||||||||||
  Image Decompress
    single-threaded scalar    2290 |||||||||
    multi-threaded scalar     2958 |||||||||||
  Lua
    single-threaded scalar    4173 ||||||||||||||||
    multi-threaded scalar     7870 |||||||||||||||||||||||||||||||

Floating Point
  Mandelbrot
    single-threaded scalar    2834 |||||||||||
    multi-threaded scalar     5023 ||||||||||||||||||||
  Dot Product
    single-threaded scalar    4670 ||||||||||||||||||
    multi-threaded scalar     8500 ||||||||||||||||||||||||||||||||||
    single-threaded vector    5485 |||||||||||||||||||||
    multi-threaded vector     8680 ||||||||||||||||||||||||||||||||||
  LU Decomposition
    single-threaded scalar    3550 ||||||||||||||
    multi-threaded scalar     3614 ||||||||||||||
  Primality Test
    single-threaded scalar    4944 |||||||||||||||||||
    multi-threaded scalar     7445 |||||||||||||||||||||||||||||
  Sharpen Image
    single-threaded scalar   10893 |||||||||||||||||||||||||||||||||||||||||||
    multi-threaded scalar    13451 |||||||||||||||||||||||||||||||||||||||||||||||||||||
  Blur Image
    single-threaded scalar    8775 |||||||||||||||||||||||||||||||||||
    multi-threaded scalar    15614 ||||||||||||||||||||||||||||||||||||||||||||||||||||||||||||||

Memory
  Read Sequential
    single-threaded scalar    7708 ||||||||||||||||||||||||||||||
  Write Sequential
    single-threaded scalar   11913 |||||||||||||||||||||||||||||||||||||||||||||||
  Stdlib Allocate
    single-threaded scalar    4956 |||||||||||||||||||
  Stdlib Write
    single-threaded scalar    8120 ||||||||||||||||||||||||||||||||
  Stdlib Copy
    single-threaded scalar   16164 ||||||||||||||||||||||||||||||||||||||||||||||||||||||||||||||||

Stream
  Stream Copy
    single-threaded scalar    6299 |||||||||||||||||||||||||
    single-threaded vector    7570 ||||||||||||||||||||||||||||||
  Stream Scale
    single-threaded scalar    6727 ||||||||||||||||||||||||||
    single-threaded vector    6907 |||||||||||||||||||||||||||
  Stream Add
    single-threaded scalar    6166 ||||||||||||||||||||||||
    single-threaded vector    6923 |||||||||||||||||||||||||||
  Stream Triad
    single-threaded scalar    6807 |||||||||||||||||||||||||||
    single-threaded vector    5186 ||||||||||||||||||||

Integer Score:                3967 |||||||||||||||
Floating Point Score:         7391 |||||||||||||||||||||||||||||
Memory Score:                 9772 |||||||||||||||||||||||||||||||||||||||
Stream Score:                 6573 ||||||||||||||||||||||||||

Overall Geekbench Score:      6586 ||||||||||||||||||||||||||
Customer Service and Support
As their About page has mentioned, they do not claim to have 24×7 support, and any non-urgent issues are responded within the regular working hours.

I actually sort of like this as I have seen way too many hosting companies offering 24×7 support, when what they actually meant is that you can log in a ticket 24×7 and we will only respond to the ticket when we are ready to come to work. For a budget VPS provider, it is understandable that we can not expect immediate response for every single ticket sent in. However, giving your customers realistic expectations rather than promising something that you can’t fulfill is always a good business strategy.
Conclusion
One thing that makes me always puzzling is why despite being a company that is not even comparable in size to many of the big players in the budget VPS market, Inception Hosting could quickly become a well-known brand within the community and getting many good comments whenever they are being featured on LowEndBox or elsewhere (yes, each of the word is a different link representing a comment left by a various happy customers of Inception Hosting). I guess besides running in a very unique business model, which they have specified in their About page:

The other important factor is that Anthony and his team are people who always have new ideas and always love to listen and improve. No one is really perfect with the first try, and quite honestly I can even find some flaws on their services while I was working on this particular review, however I am sure it is just a matter of time before Inception Hosting gets them resolved and be an even better brand in future.
Finally…
If you have found this post to be useful and has decided to try a VPS with Inception Hosting, I would appreciate if you could use this link for your purchase. Disclaimer: this is an affiliate link and Inception Hosting will give me a minor portion of your purchase to me as commission. However you will not be paying more than other customers and all discount coupons should work as normal.
If you prefer not to purchase through the affiliate link, here is the direct link to their website: http://inceptionhosting.com/. If you have clicked through the affiliate link by accident and is not comfortable of using it, please close your browser and delete all cookies, then go directly to their website.