
96MB Low End VPS Review Part 44 – IPXCore
I have to say that that although there are many providers which claimed to provide VPS with only 96MB of RAM, rarely any of them actually do provide a VPS for which 96MB is all you have as memory resources. Most of the OpenVZ providers actually provide at least another 96MB of burstable RAM, which means you are essentially running on a VPS with 192MB of RAM (although you can not do that all the time), which is really what all is needed to run an LNMP stack, plus many other basic functionalities. For Xen HVM providers, you even have the ability to add your own swap space, making the swap space to be as large as you like. That is why when IPXCore start to offer a true 96MB VPS (i.e. all you have is 96MB of memory and no burstable/swap RAM), it immediately turns out to be something rather interesting and I have decided to take one up myself to take a look.
Basic Information and Set Up
As per the post on LowEndBox.com, here is what you get for 1.25 USD per month:
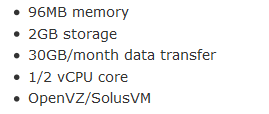
One really good part that I have found about this deal is it actually allows monthly payment. Sometimes with the ultra-low end VPS like this, people just want to sign up for one and “play around” a little without knowing if a VPS with such a low configuration is going to work out for them, although a provider definitely have to take more overhead since they will have Paypal eating up a share of the payment every month, it is definitely something that would attract customers who won’t be able to commit for a full year of payment ahead.
The sign up page is using secured HTTP connection and although when I signed up, the price was 1.25USD per month, it has definitely gone up recently (EDIT: I have just noticed this post on WHT before I publish this blog post, it seems that the TinyVPS plan right now comes with 96MB of burstable RAM as well, which could be one of the reasons for a higher price. And they are currently offering 15% off recurring discount, making the price to be 1.69USD per month, considering you get 96MB of burstable RAM for an extra 44 cents per month, it is actually a much better deal especially if you need more than just 96MB.)
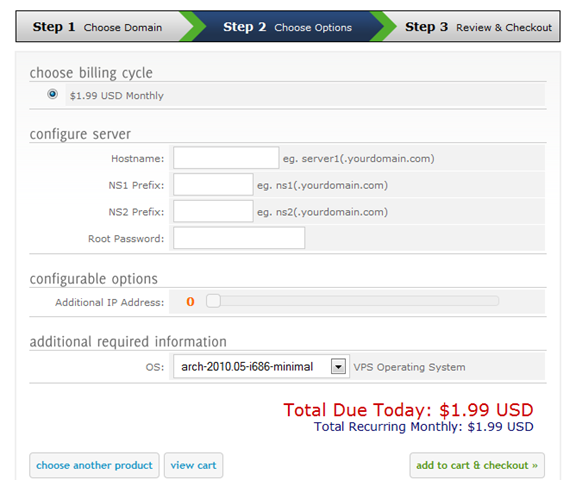
As you can see, there is actually no other payment cycle available, which means you can not commit for a year even if you want to! I guess IPXCore is really trying to make sure that you stay with them really if you want to.
Also, note that Step 1 is skipped as well, so that I do not have to input a domain name in there, which is great. Additional IP address cost 3 USD per month, which is more than the cost of 2 VPS when I originally signed up and is the cost of one and a half VPS using the price today, I guess they really want to make sure you do not put more than 1 IP address on the same box then. If you need 2 IP address, you can always proxy/VPN the VPS together although I do not think there is internal LAN address available.
Quite a few OS templates are made available during sign up process:
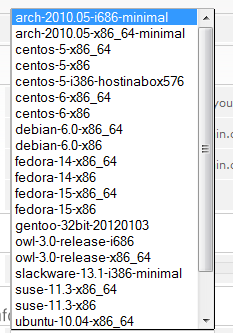

Although it is a little disappointing that they do not have any minimal templates for Ubuntu or Debian. Yes, I understand that after a fresh installation, Debian (particularly Debian 6) uses quite little memory, but I still hope that I could get a template that is trimmed down as much as possible.
Three payment methods are available, Google Checkout, Alert Pay and of course, Paypal, you can just make a one time payment and then log in every month to pay again every month as the invoice arrives or you can just subscribe to the payment and have Paypal to take care of things for you.
The creation of the VPS was instant and although I signed it up during Christmas Eve at 11:20pm (now you guys know what I did for Christmas), I received the emails with my VPS login information at the same time I have received the payment notification from Paypal. Unlike many other providers, I actually see 2 emails coming from them containing similar pieces of information. The first one was sent by Virtualizor from [email protected], which I guess is the email address of one of the support stuff, and contains something like this:

I was not sure what the URLs were for and it turns out to be the login URL to the Virtulizor control panel. One interesting detail was that when I tried to login to the secure HTTP interface, I actually got a certificate warning, which was due to the security certificate was issued to diamond.ipxcore.com rather than the IP address. I am curious as to why IPXcore would prefer to give the IP address in the email rather than the actual subdomain.
The second email looks more like the type of emails that I have received from almost every single VPS provider:

As you can see, the information contained there is pretty much the same as the first email, which makes the second email (or the first one) rather unnecessary.
Although there is a control panel for the VPS, I almost never logged into that. Besides the IP address is much harder for me to remember than the actual subdomain, the fact that the control panel in the client area is just as good is definitely a key reason.
Once logged into the Client Area from their home page and click on My Services, here is what you get to see:

Click on View Details tab and you are being presented with the following page:
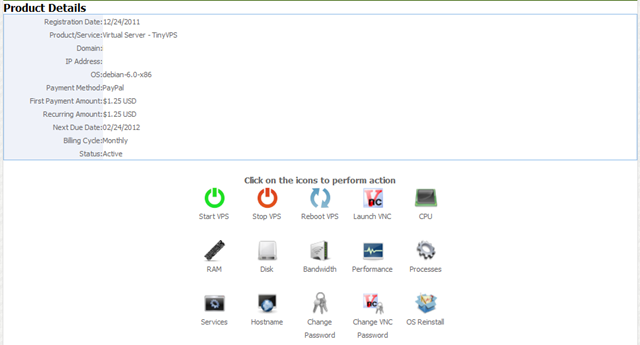
As you can see, this is actually a very detailed control panel, and contain almost everything of what I need with SolusVM, plus a few bonuses. The only part that I could not find and I wish to have is instant rDNS and centralized backup, however many of the providers using SolusVM are not turning them on anyways.
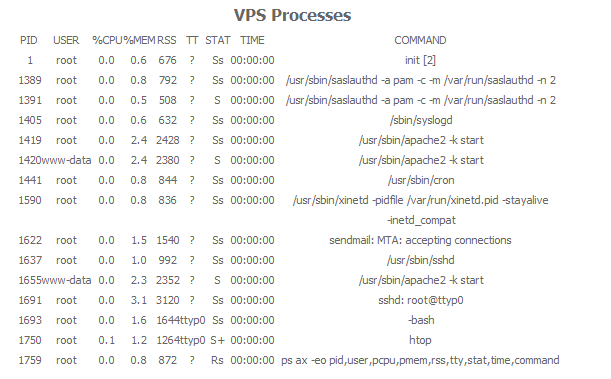
Some of the interesting functionalities that I have found including the ability to run something similar to the output of top when clicking on the Processes button:
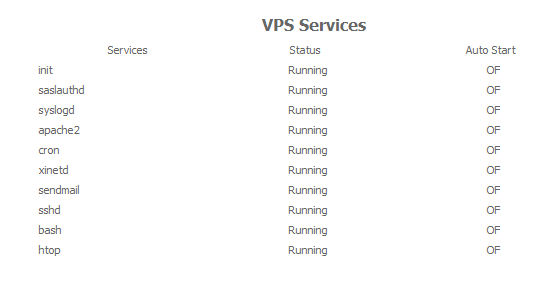
Or see the actual services running when click on the Services button:
However, not all features are turned on and one such example is the VNC/emergency recovery console:

This is something that I am not sure how to deal with since if I accidentally configured my Iptable to block the SSH traffic, the only way I can gain access to the VPS seems to be reinstalling the OS template, which is something that I prefer to do it as few times as possible.
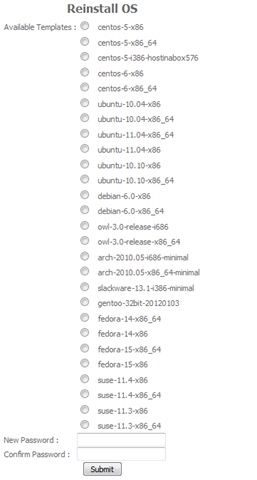
The OS templates available for reinstalling is pretty much the same as the templates available on the sign up page, and unfortunately again, there is no minimal template for Debian and Ubuntu (and CentOS for that matter as well). I was very tempted to try to get HostInABox running on the VPS with only 96MB of RAM and nothing else, but I guess I will hold on to the thoughts.
If you really really need to take a look at the control panel, which is something I probably have logged in less than 5 times in the past 3 months (and once just for writing this review), here is what you will see:

Click on the arrow in manage and you see a screen that is very similar to what is in the client area:
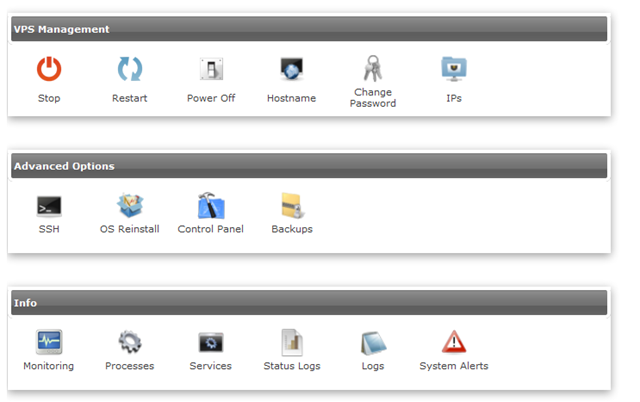
However, a few nice features that I was hoping to see in the client area now works in the control panel, for example, if you click on the SSH button, you actually see the emergency recovery console popping up:
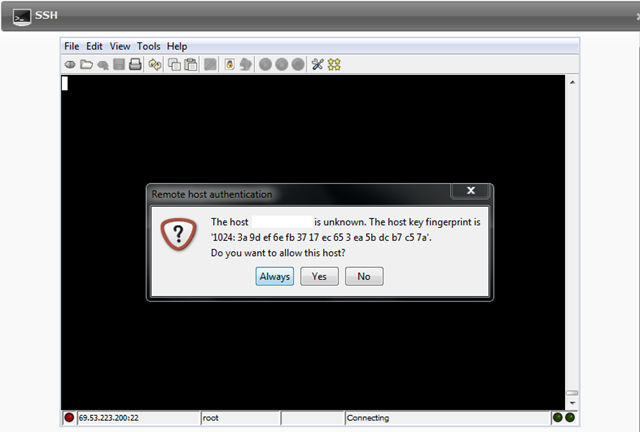
Want to create a backup of the VPS? Simply click on the Backup button and you are done:

And if you are looking to install control panels such a CPanel or Kloxo, they can be done easily with the click of a button in Control Panel as well:

Although I highly doubt if anyone would be able to get CPanel up and running on this VPS.
There is also a quite comprehensive performance monitoring functionalities available in the control panel, such as monitoring CPU, RAM and disk usage:
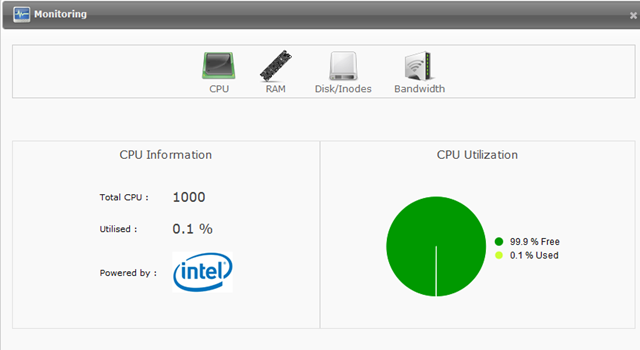
The interesting bit is the OS installation screen, which actually consists of different types/classifications according to the distribution:
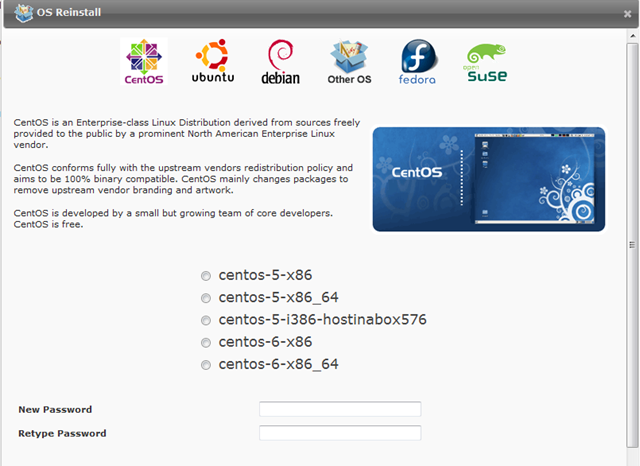
Note that every time the OS is reloaded, you are required to type in the new root password.
Test on the VPS
As mentioned above, the VPS contains 96MB of RAM, 2GB of disk space(and received another 2GB for free after I was trying to install an LNMP stack and was unsuccessful due to both memory and hard drive space restrictions), and it is located in Phoenix, AZ in US, I have, as usual, used Debian 6 OS template for testing purposes.
After a fresh reload of OS, the VPS took about 18 MB of RAM, which is almost the same as the “standard” RAM usage for a Debian 6 OS template:
 free -m
             total       used       free     shared    buffers     cached
Mem:            96         18         77          0          0          0
-/+ buffers/cache:         18         77
Swap:            0          0          0
Top output showing the processes running:
top - 23:14:02 up 12 min,  1 user,  load average: 0.00, 0.00, 0.00
Tasks:  15 total,   2 running,  13 sleeping,   0 stopped,   0 zombie
Cpu(s):  0.0%us,  0.0%sy,  0.0%ni,100.0%id,  0.0%wa,  0.0%hi,  0.0%si,  0.0%st
Mem:     98304k total,    18892k used,    79412k free,        0k buffers
Swap:        0k total,        0k used,        0k free,        0k cached

  PID USER      PR  NI  VIRT  RES  SHR S %CPU %MEM    TIME+  COMMAND
 1691 root      18   0  8756 3120 2468 R  0.0  3.2   0:00.22 sshd
 1419 root      15   0  5132 2428 1180 S  0.0  2.5   0:00.00 apache2
 1420 www-data  15   0  5272 2380 1084 S  0.0  2.4   0:00.00 apache2
 1655 www-data  15   0  5264 2352 1060 S  0.0  2.4   0:00.00 apache2
 1693 root      15   0  2956 1644 1316 S  0.0  1.7   0:00.01 bash
 1622 root      18   0  9988 1540  500 S  0.0  1.6   0:00.00 sendmail-mta
 1721 root      15   0  2324 1060  872 R  0.0  1.1   0:00.00 top
 1637 root      18   0  5484  992  600 S  0.0  1.0   0:00.00 sshd
 1441 root      18   0  2284  844  660 S  0.0  0.9   0:00.00 cron
 1590 root      25   0  2388  836  668 S  0.0  0.9   0:00.00 xinetd
 1389 root      18   0  8664  792  448 S  0.0  0.8   0:00.00 saslauthd
 1409 root      18   0  1888  780  648 S  0.0  0.8   0:00.00 anacron
    1 root      15   0  2024  676  584 S  0.0  0.7   0:00.21 init
 1405 root      15   0  1732  632  504 S  0.0  0.6   0:00.00 syslogd
 1391 root      18   0  8664  508  164 S  0.0  0.5   0:00.00 saslauthd
And the corresponding htop output:
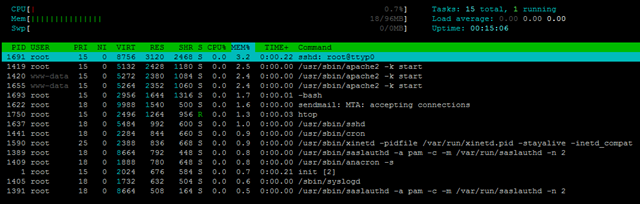
Approximately 444MB of hard drive space was taken after the OS template was reloaded:
 df -h
Filesystem            Size  Used Avail Use% Mounted on
/dev/simfs            4.0G  444M  3.6G  11% /
tmpfs                  48M     0   48M   0% /lib/init/rw
tmpfs                  48M     0   48M   0% /dev/shm
And the Inodes is set to a pretty nice value of 4000000, which I am not sure was due to the actual hard drive capacity that I have (4GB):
 df -i
Filesystem            Inodes   IUsed   IFree IUse% Mounted on
/dev/simfs           4000000   26162 3973838    1% /
tmpfs                  12288       4   12284    1% /lib/init/rw
tmpfs                  12288       1   12287    1% /dev/shm
Unfortunately I have had a bit of hard time trying to compile the LNMP stack from source due to the limited amount of memory that I have. Although IPXcore has been really kind and gave me 256MB of RAM for free temporarily to compile the programs, I think it is just unfair to include the memory and hard drive space usage after the LNMP stack was installed here.
However, after the LNMP stack was installed, about 2GB of hard drive space was used, which is pretty good:
df -h
Filesystem            Size  Used Avail Use% Mounted on
/dev/simfs            4.0G  2.0G  2.1G  50% /
tmpfs                  48M     0   48M   0% /lib/init/rw
tmpfs                  48M     0   48M   0% /dev/shm
And 3% of iNodes were used as well:
 df -i
Filesystem            Inodes   IUsed   IFree IUse% Mounted on
/dev/simfs           4000000   90831 3909169    3% /
tmpfs                  12288       3   12285    1% /lib/init/rw
tmpfs                  12288       1   12287    1% /dev/shm
Uptime shows the VPS is mostly unused:
uptime
 23:34:13 up 11:01,  2 users,  load average: 0.00, 0.00, 0.00
Which is again showed in the output of vmstat:
vmstat
procs -----------memory---------- ---swap-- -----io---- -system-- ----cpu----
 r  b   swpd   free   buff  cache   si   so    bi    bo   in   cs us sy id wa
 0  0      0  92508      0      0    0    0   127   399    0  318  2  2 96  0
Unlike the normal OpenVZ set up, the beancounters output is actually pretty weird:
cat /proc/user_beancounters
Version: 2.5
       uid  resource                     held              maxheld              barrier                limit              failcnt
      225:  kmemsize                  1392136              3902167           2147483647           2147483647                    0
            lockedpages                     0                  427               999999               999999                    0
            privvmpages                  1461                63588                24576                24576                90272
            shmpages                        0                 8332                24576                24576                    0
            dummy                           0                    0                    0                    0                    0
            numproc                        10                   35                32567                32567                    0
            physpages                     755                36148                    0           2147483647                    0
            vmguarpages                     0                    0                24576                24576                    0
            oomguarpages                  755                36148                24576                24576                    0
            numtcpsock                      2                   60              7999992              7999992                    0
            numflock                        3                   23               999999               999999                    0
            numpty                          1                    3                  255                  255                    0
            numsiginfo                      0                   24                 1024                 1024                    0
            tcpsndbuf                   37336              2300792            214748160            396774400                    0
            tcprcvbuf                   32768               983040            214748160            396774400                    0
            othersockbuf                 4656               431480            214748160            396774400                    0
            dgramrcvbuf                     0                26080            214748160            396774400                    0
            numothersock                    6                   90              7999992              7999992                    0
            dcachesize                      0                    0           2147483647           2147483647                    0
            numfile                       225                 1578             23999976             23999976                    0
            dummy                           0                    0                    0                    0                    0
            dummy                           0                    0                    0                    0                    0
            dummy                           0                    0                    0                    0                    0
            numiptent                      24                   24               999999               999999
                0
As you can see, although the held and maxheld values are more or less normal, barrier and limit seems to set to pretty outlandish values. Most interestingly, the failcnt value for privvmpages, which should always be 0, is actually having the value of more than 90000.
Since the vzfree output depends on the beancounters output, I have included them here:
vzfree
             Total     Used     Free
Kernel:   2048.00M    1.74M 2046.26M
Allocate:   96.00M   47.59M   48.41M (96M Guaranteed)
Commit:     96.00M   45.65M   50.35M (92.3% of Allocated)
Swap:                 0.00M          (0.0% of Committed)
As you can see, there is no sign of overselling involved.
Half a CPU core is advertised for the VPS, and indeed that means for a 3GHz CPU core, you will only be able to get 1.5GHz:
 cat /proc/cpuinfo
processor       : 0
vendor_id       : GenuineIntel
cpu family      : 15
model           : 4
model name      :                   Intel(R) Xeon(TM) CPU 3.00GHz
stepping        : 3
cpu MHz         : 1500.120
cache size      : 2048 KB
physical id     : 0
siblings        : 2
core id         : 0
cpu cores       : 1
apicid          : 0
fpu             : yes
fpu_exception   : yes
cpuid level     : 5
wp              : yes
flags           : fpu vme de pse tsc msr pae mce cx8 apic sep mtrr pge mca cmov                                                                                                  pat pse36 clflush dts acpi mmx fxsr sse sse2 ss ht tm syscall lm constant_tsc pn                                                                                                 i monitor ds_cpl cid cx16 xtpr
bogomips        : 6000.48
clflush size    : 64
cache_alignment : 128
address sizes   : 36 bits physical, 48 bits virtual
power management:
And the meminfo output:
cat /proc/meminfo
MemTotal:        98304 kB
MemFree:         49632 kB
Buffers:             0 kB
Cached:              0 kB
SwapCached:          0 kB
Active:              0 kB
Inactive:            0 kB
HighTotal:           0 kB
HighFree:            0 kB
LowTotal:        98304 kB
LowFree:         49632 kB
SwapTotal:           0 kB
SwapFree:            0 kB
Dirty:            2600 kB
Writeback:           0 kB
AnonPages:           0 kB
Mapped:              0 kB
Slab:                0 kB
PageTables:          0 kB
NFS_Unstable:        0 kB
Bounce:              0 kB
CommitLimit:         0 kB
Committed_AS:        0 kB
VmallocTotal:        0 kB
VmallocUsed:         0 kB
VmallocChunk:        0 kB
HugePages_Total:     0
HugePages_Free:      0
HugePages_Rsvd:      0
Hugepagesize:     2048 kB
And time sync as well:
time sync
    0.23s real     0.00s user     0.00s system
The disk I/O is not really impressive to be honest, with only slightly above 30MB/s of write speed, you can barely run anything useful:
dd if=/dev/zero of=test bs=64k count=16k conv=fdatasync
16384+0 records in
16384+0 records out
1073741824 bytes (1.1 GB) copied, 31.8149 s, 33.7 MB/s
Testing again basically showed similar results:
dd if=/dev/zero of=test bs=64k count=16k conv=fdatasync
16384+0 records in
16384+0 records out
1073741824 bytes (1.1 GB) copied, 32.9984 s, 32.5 MB/s
IOping results are pretty steady, however the values are not good, which means that the performance is at least pretty consistent:
ioping -c 10 .
4096 bytes from . (simfs /dev/simfs): request=1 time=15.4 ms
4096 bytes from . (simfs /dev/simfs): request=2 time=12.1 ms
4096 bytes from . (simfs /dev/simfs): request=3 time=27.1 ms
4096 bytes from . (simfs /dev/simfs): request=4 time=14.6 ms
4096 bytes from . (simfs /dev/simfs): request=5 time=2.4 ms
4096 bytes from . (simfs /dev/simfs): request=6 time=13.3 ms
4096 bytes from . (simfs /dev/simfs): request=7 time=0.4 ms
4096 bytes from . (simfs /dev/simfs): request=8 time=14.5 ms
4096 bytes from . (simfs /dev/simfs): request=9 time=0.4 ms
4096 bytes from . (simfs /dev/simfs): request=10 time=12.0 ms

--- . (simfs /dev/simfs) ioping statistics ---
10 requests completed in 9122.7 ms, 89 iops, 0.3 mb/s
min/avg/max/mdev = 0.4/11.2/27.1/7.8 ms
As you can see, the round trip time is normally well above 1ms, which seems to be what I normally see.
Testing again showed similar results:
ioping -c 10 .
4096 bytes from . (simfs /dev/simfs): request=1 time=13.8 ms
4096 bytes from . (simfs /dev/simfs): request=2 time=10.8 ms
4096 bytes from . (simfs /dev/simfs): request=3 time=10.1 ms
4096 bytes from . (simfs /dev/simfs): request=4 time=62.7 ms
4096 bytes from . (simfs /dev/simfs): request=5 time=10.2 ms
4096 bytes from . (simfs /dev/simfs): request=6 time=0.4 ms
4096 bytes from . (simfs /dev/simfs): request=7 time=0.4 ms
4096 bytes from . (simfs /dev/simfs): request=8 time=16.4 ms
4096 bytes from . (simfs /dev/simfs): request=9 time=8.0 ms
4096 bytes from . (simfs /dev/simfs): request=10 time=12.5 ms

--- . (simfs /dev/simfs) ioping statistics ---
10 requests completed in 9156.5 ms, 69 iops, 0.3 mb/s
min/avg/max/mdev = 0.4/14.5/62.7/16.8 ms
The network seems to be OK, although by no means impressive, I was be able to clock more than 2MB/s in the Cachefly download test:
 wget cachefly.cachefly.net/100mb.test -O /dev/null
--2012-02-22 03:01:06--  http://cachefly.cachefly.net/100mb.test
Resolving cachefly.cachefly.net... 205.234.175.175
Connecting to cachefly.cachefly.net|205.234.175.175|:80... connected.
HTTP request sent, awaiting response... 200 OK
Length: 104857600 (100M) [application/octet-stream]
Saving to: `/dev/null'

100%[======================================>] 104,857,600 2.25M/s   in 43s

2012-02-22 03:01:49 (2.31 MB/s) - `/dev/null' saved [104857600/104857600]
Testing again actually showed slightly better results:
wget cachefly.cachefly.net/100mb.test -O /dev/null
--2012-02-22 03:15:03--  http://cachefly.cachefly.net/100mb.test
Resolving cachefly.cachefly.net... 205.234.175.175
Connecting to cachefly.cachefly.net|205.234.175.175|:80... connected.
HTTP request sent, awaiting response... 200 OK
Length: 104857600 (100M) [application/octet-stream]
Saving to: `/dev/null'

100%[======================================>] 104,857,600 2.28M/s   in 43s

2012-02-22 03:15:46 (2.34 MB/s) - `/dev/null' saved [104857600/104857600]
Compare to download speed, the upload speed is far less impressive:
The first upload test is from a test VPS with BuffaloVPS in Chicago, IL:
wget 69.53.***.***/100mb.test -O /dev/null
--2012-02-21 14:07:44--  http://69.53.223.200/100mb.test
Connecting to 69.53.223.200:80... connected.
HTTP request sent, awaiting response... 200 OK
Length: 104857600 (100M) [application/octet-stream]
Saving to: `/dev/null'

100%[======================================>] 104,857,600 1.22M/s   in 77s

2012-02-21 14:09:01 (1.30 MB/s) - `/dev/null' saved [104857600/104857600]
The next one is with a BuyVM VPS in San Jose, CA:
 wget 69.53.***.***/100mb.test -O /dev/null
--2012-02-21 14:12:14--  http://69.53.223.200/100mb.test
Connecting to 69.53.223.200:80... connected.
HTTP request sent, awaiting response... 200 OK
Length: 104857600 (100M) [application/octet-stream]
Saving to: `/dev/null'

100%[======================================>] 104,857,600 2.19M/s   in 45s

2012-02-21 14:12:58 (2.24 MB/s) - `/dev/null' saved [104857600/104857600]
And finally, the test on a XenVZ VPS in Maidenhead, UK:
wget 69.53.***.***/100mb.test -O /dev/null
--2012-02-22 03:34:46--  http://69.53.223.200/100mb.test
Connecting to 69.53.223.200:80... connected.
HTTP request sent, awaiting response... 200 OK
Length: 104857600 (100M) [application/octet-stream]
Saving to: `/dev/null'

100%[======================================>] 104,857,600  127K/s   in 16m 48s

2012-02-22 03:51:34 (102 KB/s) - `/dev/null' saved [104857600/104857600]
As you can see, the upload speed from this VPS has never exceeded 2.5MB/s with the connection to Europe as slow as 102KB/s, which is not really something acceptable.
Finally, for the benchmarking, I have tried to run both UnixBench and Geekbench on the VPS, unfortunately, only UnixBench managed to run and GeekBench, even after I tried to shut down as many services as possible, still gave me an out of memory error:
System Information
  Platform:                  Linux x86 (32-bit)
  Compiler:                  GCC 4.1.2 20070925 (Red Hat 4.1.2-33)
  Operating System:          Linux 2.6.32-274.7.1.el5.028stab095.1 i686
  Model:                     Linux PC (Intel Xeon)
  Motherboard:               Unknown Motherboard
  Processor:                 Intel Xeon
  Processor ID:              GenuineIntel Family 15 Model 4 Stepping 3
  Logical Processors:        1
  Physical Processors:       1
  Processor Frequency:       1.50 GHz
  L1 Instruction Cache:      0.00 B
  L1 Data Cache:             0.00 B
  L2 Cache:                  2.00 MB
  L3 Cache:                  0.00 B
  Bus Frequency:             0.00 Hz
  Memory:                    2.94 GB
  Memory Type:               N/A
  SIMD:                      1
  BIOS:                      N/A
  Processor Model:                             Intel(R) Xeon(TM) CPU 3.00GHz
  Processor Cores:           1

Integer
  Blowfish
    single-threaded scalar    1983 |||||||
    multi-threaded scalar     1147 ||||
  Text Compress
    single-threaded scalar     649 ||
    multi-threaded scalar      629 ||
  Text Decompress
    single-threaded scalar     712 ||
    multi-threaded scalar      733 ||
  Image Compress
    single-threaded scalar     587 ||
    multi-threaded scalar      576 ||
  Image Decompress
    single-threaded scalar     724 ||
    multi-threaded scalar      618 ||
  Lua
    single-threaded scalar     903 |||
    multi-threaded scalar      866 |||

Floating Point
  Mandelbrot
    single-threaded scalar     560 ||
    multi-threaded scalar      553 ||
  Dot Product
    single-threaded scalar    1058 ||||
    multi-threaded scalar     1081 ||||
    single-threaded vector     809 |||
    multi-threaded vector      871 |||
  LU Decomposition
    single-threaded scalar    1031 ||||
    multi-threaded scalar     1049 ||||
  Primality Test
    single-threaded scalar     989 |||
    multi-threaded scalar      787 |||
  Sharpen Image
    single-threaded scalar    1898 |||||||
    multi-threaded scalar     1797 |||||||
  Blur Image
    single-threaded scalar    1549 ||||||
    multi-threaded scalar     1528 ||||||

Memory
  Read Sequential
    single-threaded scalar    1545 ||||||
  Write Sequential
    single-threaded scalar    1413 |||||
  Stdlib Allocate
    single-threaded scalar     716 ||
terminate called after throwing an instance of 'std::bad_alloc'
  what():  std::bad_alloc
Abort
Running again yielded similar results:
System Information
  Platform:                  Linux x86 (32-bit)
  Compiler:                  GCC 4.1.2 20070925 (Red Hat 4.1.2-33)
  Operating System:          Linux 2.6.32-274.7.1.el5.028stab095.1 i686
  Model:                     Linux PC (Intel Xeon)
  Motherboard:               Unknown Motherboard
  Processor:                 Intel Xeon
  Processor ID:              GenuineIntel Family 15 Model 4 Stepping 3
  Logical Processors:        1
  Physical Processors:       1
  Processor Frequency:       1.50 GHz
  L1 Instruction Cache:      0.00 B
  L1 Data Cache:             0.00 B
  L2 Cache:                  2.00 MB
  L3 Cache:                  0.00 B
  Bus Frequency:             0.00 Hz
  Memory:                    2.94 GB
  Memory Type:               N/A
  SIMD:                      1
  BIOS:                      N/A
  Processor Model:                             Intel(R) Xeon(TM) CPU 3.00GHz
  Processor Cores:           1

Integer
  Blowfish
    single-threaded scalar    1828 |||||||
    multi-threaded scalar     1038 ||||
  Text Compress
    single-threaded scalar     624 ||
    multi-threaded scalar      599 ||
  Text Decompress
    single-threaded scalar     703 ||
    multi-threaded scalar      716 ||
  Image Compress
    single-threaded scalar     586 ||
    multi-threaded scalar      577 ||
  Image Decompress
    single-threaded scalar     734 ||
    multi-threaded scalar      620 ||
  Lua
    single-threaded scalar     997 |||
    multi-threaded scalar      862 |||

Floating Point
  Mandelbrot
    single-threaded scalar     561 ||
    multi-threaded scalar      553 ||
  Dot Product
    single-threaded scalar    1059 ||||
    multi-threaded scalar     1082 ||||
    single-threaded vector     818 |||
    multi-threaded vector      868 |||
  LU Decomposition
    single-threaded scalar    1029 ||||
    multi-threaded scalar     1048 ||||
  Primality Test
    single-threaded scalar     991 |||
    multi-threaded scalar      790 |||
  Sharpen Image
    single-threaded scalar    1901 |||||||
    multi-threaded scalar     1787 |||||||
  Blur Image
    single-threaded scalar    1553 ||||||
    multi-threaded scalar     1527 ||||||

Memory
  Read Sequential
    single-threaded scalar    1523 ||||||
  Write Sequential
    single-threaded scalar    1395 |||||
  Stdlib Allocate
    single-threaded scalar     713 ||
terminate called after throwing an instance of 'std::bad_alloc'
  what():  std::bad_alloc
Abort
Even though the tests were not completed, as you can see from the subscores, the performance of the VPS is unlikely to be too impressive.
UnixBench actually confirmed the results from Geekbench, and perhaps for a VPS with only 96MB of RAM and half a CPU core, we really can’t expect too much:
   #    #  #    #  #  #    #          #####   ######  #    #   ####   #    #
   #    #  ##   #  #   #  #           #    #  #       ##   #  #    #  #    #
   #    #  # #  #  #    ##            #####   #####   # #  #  #       ######
   #    #  #  # #  #    ##            #    #  #       #  # #  #       #    #
   #    #  #   ##  #   #  #           #    #  #       #   ##  #    #  #    #
    ####   #    #  #  #    #          #####   ######  #    #   ####   #    #

   Version 5.1.3                      Based on the Byte Magazine Unix Benchmark

   Multi-CPU version                  Version 5 revisions by Ian Smith,
                                      Sunnyvale, CA, USA
   January 13, 2011                   johantheghost at yahoo period com


1 x Dhrystone 2 using register variables  1 2 3 4 5 6 7 8 9 10

1 x Double-Precision Whetstone  1 2 3 4 5 6 7 8 9 10

1 x Execl Throughput  1 2 3

1 x File Copy 1024 bufsize 2000 maxblocks  1 2 3

1 x File Copy 256 bufsize 500 maxblocks  1 2 3

1 x File Copy 4096 bufsize 8000 maxblocks  1 2 3

1 x Pipe Throughput  1 2 3 4 5 6 7 8 9 10

1 x Pipe-based Context Switching  1 2 3 4 5 6 7 8 9 10

1 x Process Creation  1 2 3

1 x System Call Overhead  1 2 3 4 5 6 7 8 9 10

1 x Shell Scripts (1 concurrent)  1 2 3

1 x Shell Scripts (8 concurrent)  1 2 3

========================================================================
   BYTE UNIX Benchmarks (Version 5.1.3)

   System: *******: GNU/Linux
   OS: GNU/Linux -- 2.6.32-274.7.1.el5.028stab095.1 -- #1 SMP Mon Oct 24 20:49:24 MSD 2011
   Machine: i686 (unknown)
   Language: en_US.utf8 (charmap="ANSI_X3.4-1968", collate="ANSI_X3.4-1968")
   CPU 0: Intel(R) Xeon(TM) CPU 3.00GHz (6000.5 bogomips)
          Hyper-Threading, x86-64, MMX, Physical Address Ext, SYSENTER/SYSEXIT, SYSCALL/SYSRET
   12:51:50 up 18 min,  2 users,  load average: 0.14, 0.03, 0.01; runlevel 2

------------------------------------------------------------------------
Benchmark Run: Sun Feb 19 2012 12:51:50 - 13:22:05
1 CPU in system; running 1 parallel copy of tests

Dhrystone 2 using register variables        3005640.9 lps   (10.0 s, 7 samples)
Double-Precision Whetstone                     1225.9 MWIPS (10.7 s, 7 samples)
Execl Throughput                               1008.3 lps   (29.6 s, 2 samples)
File Copy 1024 bufsize 2000 maxblocks        120777.2 KBps  (30.0 s, 2 samples)
File Copy 256 bufsize 500 maxblocks           35911.0 KBps  (30.0 s, 2 samples)
File Copy 4096 bufsize 8000 maxblocks        280149.2 KBps  (30.0 s, 2 samples)
Pipe Throughput                              237153.7 lps   (10.0 s, 7 samples)
Pipe-based Context Switching                  53424.4 lps   (10.0 s, 7 samples)
Process Creation                               3019.3 lps   (30.0 s, 2 samples)
Shell Scripts (1 concurrent)                   1467.0 lpm   (60.0 s, 2 samples)
Shell Scripts (8 concurrent)                    190.5 lpm   (60.2 s, 2 samples)
System Call Overhead                         193471.7 lps   (10.0 s, 7 samples)

System Benchmarks Index Values               BASELINE       RESULT    INDEX
Dhrystone 2 using register variables         116700.0    3005640.9    257.6
Double-Precision Whetstone                       55.0       1225.9    222.9
Execl Throughput                                 43.0       1008.3    234.5
File Copy 1024 bufsize 2000 maxblocks          3960.0     120777.2    305.0
File Copy 256 bufsize 500 maxblocks            1655.0      35911.0    217.0
File Copy 4096 bufsize 8000 maxblocks          5800.0     280149.2    483.0
Pipe Throughput                               12440.0     237153.7    190.6
Pipe-based Context Switching                   4000.0      53424.4    133.6
Process Creation                                126.0       3019.3    239.6
Shell Scripts (1 concurrent)                     42.4       1467.0    346.0
Shell Scripts (8 concurrent)                      6.0        190.5    317.5
System Call Overhead                          15000.0     193471.7    129.0
                                                                   ========
System Benchmarks Index Score                                         240.4
Testing again basically shows the same results:
   #    #  #    #  #  #    #          #####   ######  #    #   ####   #    #
   #    #  ##   #  #   #  #           #    #  #       ##   #  #    #  #    #
   #    #  # #  #  #    ##            #####   #####   # #  #  #       ######
   #    #  #  # #  #    ##            #    #  #       #  # #  #       #    #
   #    #  #   ##  #   #  #           #    #  #       #   ##  #    #  #    #
    ####   #    #  #  #    #          #####   ######  #    #   ####   #    #

   Version 5.1.3                      Based on the Byte Magazine Unix Benchmark

   Multi-CPU version                  Version 5 revisions by Ian Smith,
                                      Sunnyvale, CA, USA
   January 13, 2011                   johantheghost at yahoo period com


1 x Dhrystone 2 using register variables  1 2 3 4 5 6 7 8 9 10

1 x Double-Precision Whetstone  1 2 3 4 5 6 7 8 9 10

1 x Execl Throughput  1 2 3

1 x File Copy 1024 bufsize 2000 maxblocks  1 2 3

1 x File Copy 256 bufsize 500 maxblocks  1 2 3

1 x File Copy 4096 bufsize 8000 maxblocks  1 2 3

1 x Pipe Throughput  1 2 3 4 5 6 7 8 9 10

1 x Pipe-based Context Switching  1 2 3 4 5 6 7 8 9 10

1 x Process Creation  1 2 3

1 x System Call Overhead  1 2 3 4 5 6 7 8 9 10

1 x Shell Scripts (1 concurrent)  1 2 3

1 x Shell Scripts (8 concurrent)  1 2 3

========================================================================
   BYTE UNIX Benchmarks (Version 5.1.3)

   System: *******: GNU/Linux
   OS: GNU/Linux -- 2.6.32-274.7.1.el5.028stab095.1 -- #1 SMP Mon Oct 24 20:49:24 MSD 2011
   Machine: i686 (unknown)
   Language: en_US.utf8 (charmap="ANSI_X3.4-1968", collate="ANSI_X3.4-1968")
   CPU 0: Intel(R) Xeon(TM) CPU 3.00GHz (6000.5 bogomips)
          Hyper-Threading, x86-64, MMX, Physical Address Ext, SYSENTER/SYSEXIT, SYSCALL/SYSRET
   13:26:51 up 53 min,  2 users,  load average: 0.04, 1.23, 1.25; runlevel 2

------------------------------------------------------------------------
Benchmark Run: Sun Feb 19 2012 13:26:51 - 13:57:05
1 CPU in system; running 1 parallel copy of tests

Dhrystone 2 using register variables        2970548.5 lps   (10.0 s, 7 samples)
Double-Precision Whetstone                     1231.6 MWIPS (10.7 s, 7 samples)
Execl Throughput                               1005.2 lps   (29.7 s, 2 samples)
File Copy 1024 bufsize 2000 maxblocks        121829.5 KBps  (30.0 s, 2 samples)
File Copy 256 bufsize 500 maxblocks           35504.5 KBps  (30.0 s, 2 samples)
File Copy 4096 bufsize 8000 maxblocks        278184.5 KBps  (30.0 s, 2 samples)
Pipe Throughput                              238746.6 lps   (10.0 s, 7 samples)
Pipe-based Context Switching                  53359.2 lps   (10.0 s, 7 samples)
Process Creation                               3012.4 lps   (30.0 s, 2 samples)
Shell Scripts (1 concurrent)                   1483.1 lpm   (60.0 s, 2 samples)
Shell Scripts (8 concurrent)                    190.8 lpm   (60.2 s, 2 samples)
System Call Overhead                         193200.8 lps   (10.0 s, 7 samples)

System Benchmarks Index Values               BASELINE       RESULT    INDEX
Dhrystone 2 using register variables         116700.0    2970548.5    254.5
Double-Precision Whetstone                       55.0       1231.6    223.9
Execl Throughput                                 43.0       1005.2    233.8
File Copy 1024 bufsize 2000 maxblocks          3960.0     121829.5    307.7
File Copy 256 bufsize 500 maxblocks            1655.0      35504.5    214.5
File Copy 4096 bufsize 8000 maxblocks          5800.0     278184.5    479.6
Pipe Throughput                               12440.0     238746.6    191.9
Pipe-based Context Switching                   4000.0      53359.2    133.4
Process Creation                                126.0       3012.4    239.1
Shell Scripts (1 concurrent)                     42.4       1483.1    349.8
Shell Scripts (8 concurrent)                      6.0        190.8    318.1
System Call Overhead                          15000.0     193200.8    128.8
                                                                   ========
System Benchmarks Index Score                                         240.3
For 1.25 per month with monthly payment option, I guess this is probably the best deal you could find, however as you can see, almost no aspect of this VPS is powerful enough to do any heavy lifting, even the network speed is less than ideal.
Customer Service And Support
Compare to the relatively unimpressive performance of the VPS, customer service is actually really impressive, and is in fact one of the best customer service I have seen to date among the ultra-low-end VPS providers. Rarely any of the ticket I have submitted has gone unanswered for more than half an hour, in fact, most of the tickets were answered in 10 minutes. For example, a ticket I have logged in earlier today (Thursday) was sent in at 2:01pm EST and was answered by 2:07pm, an earlier ticket raised at 12:53AM on a Saturday was answered by 1:03AM, barely 10 minutes later.
On top of that, IPXcore clearly recognize the challenges to run such a tiny little box and was very generous in offering resources for help. I have requested twice to have more RAM temporarily to compile a LNMP stack, and the 2GB assigned to me initially were clearly not enough to compile everything from the source. Not only they have been really fast in responding, when I asked for RAM resources for only 4 hours, they have offered me 24 hours of 256MB of RAM and an additional 2GB of hard drive space was added to my VPS for free permanently. From that perspective, I have to say that IPXcore definitely offer their customers a great experience.
Conclusion
It is a great adventure for IPXcore to try to venture into the ultra-low-end VPS market by creating the first “real” 96MB VPS, and in particular, one of the very few providers, if not the only one, who could actually provide monthly payment option, which could be a big bonus for those who just need a tiny little box to play around with and not doing anything too serious. Granted that the server may not offering great performance, however with great user interface and very generous and timely customer service, this VPS is nonetheless a great toy to play around with for those who would like to venture into the ultra-low-end VPS world.
Thank you for the kind words. 🙂
Regarding disk i/o: the node that you’re on is scheduled to be replaced soon, due to poor disk i/o (as you noted) and poor system response. You were put on what’s pretty much our worst node 🙂
Regarding transfer: All individual connections are throttled to 20 megabit, however, you will be able to pull multiple concurrent 20 megabit connections. I can’t explain the poor Europe transfer, though.