
96MB Low End VPS Review Part XXXXIII – XenVZ revisited
As I was going back in time and reading about all the past 42 reviews I have done with the VPS providers and enjoy the fruit of my work, I can not stop wondering what happened to the providers of some of the oldest reviews. Obviously some of them are already closed (for example, IPAP.co and eNetSouth), however some of the others have thrived with the great VPS that they have provided. Today, we are going to take a look at XenVZ again, which is the VPS provider that I have wrote the first review and is what 96MB.com was originally sitting on. It has been a year since I have last reviewed them (and a year since 96MB.com was conceived!), how have they been doing?
Basic Information and Set Up
As per their advertisement on Webhostingtalk, here is what you get:

Although once you click on the order link, this is what you see:
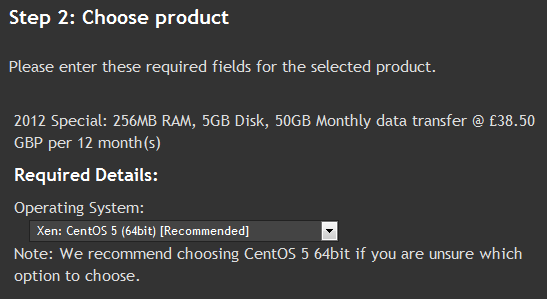
As you can see, the price is a little higher than advertised, presumably due the fact that the VPS was carrying a Special Christmas price then.
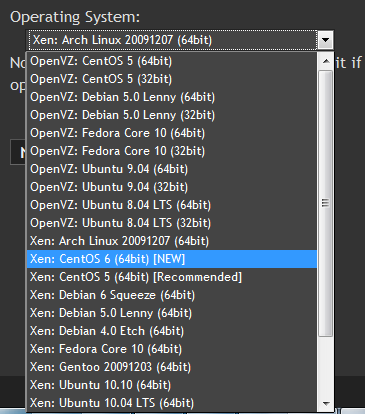
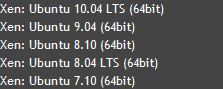
You can actually select both the type of virtualization as well as the operating system, note that for Xen virtualization, you only have the 64 bit OS due to security issues.
On the next screen, you can then select the addons:
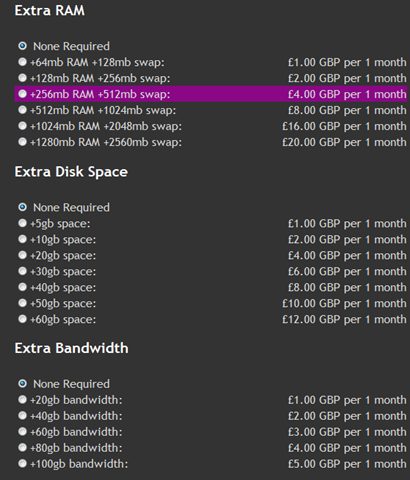
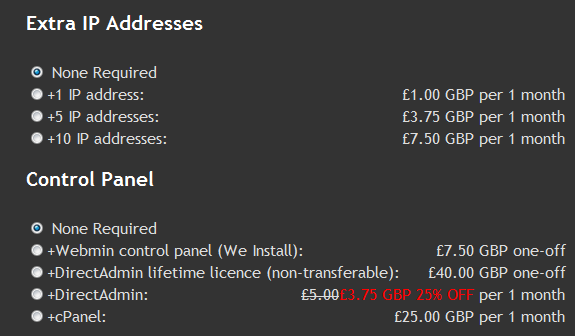
While other prices may seem to be all right, the cost for cPanel is 25 GBP per month, which is higher than the cost of obtaining a CPanel license from a reseller directly, this is something that indeed surprised me.
Once you have selected all the addons (or none of them), you are presented with a summary page for which you can then complete the order and fill up the billing details.
The activation of the VPS was instant, I received the following email the same minute when I received the Paypal payment confirmation:

Interestingly, XenVZ seems to use a credit-based system. This is something pretty interesting and innovative, compare to the providers who use WHMCS and SolusVM, where everything was chosen by the system based on the resources available on the host server.
Once logging into the custom control panel, you are being greeted by the following allocation summary, indicating the resources you are assigned to:
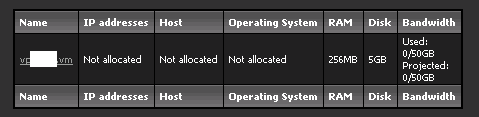
Note that IP address, host and OS are all not assigned, and you can choose it during the set up process yourself.
First step is to choose the type of OS as well as the virtualization system, which can be chosen. Xen and OpenVZ, as you have already seen when placing the order, was charged at the same price, which makes the Xen virtualization a much better deal unless you have to run the 32 bit OS. However, what I do not quite understand is that if I have to make the selection again here during the provision stage, what is the purpose of selecting virtualization and OS initially during sign up?
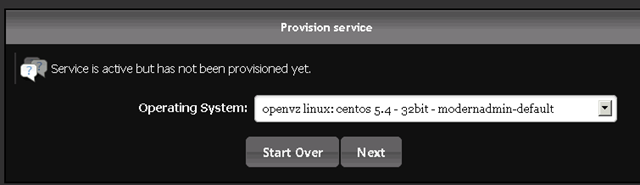
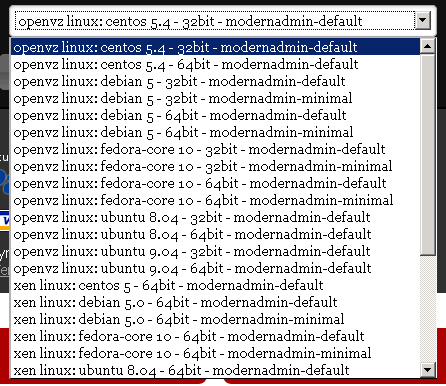
There are several templates available, and if you are using Xen, then only 64 bit OS is available, to a smaller VPS (e.g., like the 96MB VPS that they have offered before), this might be a concern since the 64 bit OS templates does take a little more memory space, however, for this particular VPS, since the allocation is 256MB, which is relatively “large” in the LEB standard, a 64 and 32 bit OS actually does not make that much differences.
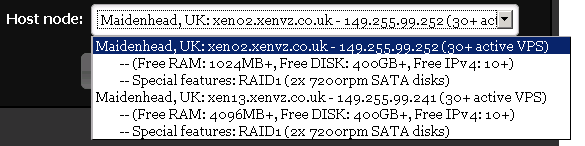
Once the virtualization and the OS template are selected, you are presented with the page to select the servers. Note that at least at the time when I was activating my VPS, the information contained on the page were incorrect and somehow the control panel thought there were more RAM or disk space left than what is actually there. As such, I chose the most crowded server (the only one with a RAID 10 set up) and the provision of the VPS kept failing. I had to email Sean on the issue, and after he reset my account, only 2 servers are left available for provisioning, both of which are using RAID 1 set up:
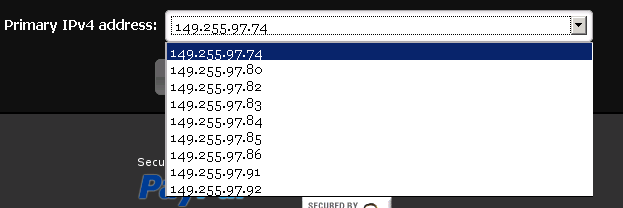
The part I like the most is the next page, where you actually get to choose the IP address. Although you can not exactly choose any IP address you like since only 9 IP addresses are made available, it is nonetheless some choices which will let you select a number closer to your lucky number. Personally I would prefer it to have a search box where you can just type in your lucky number and it will try to match the IP address with the number as closely as possible. However, it is really just a minor detail:
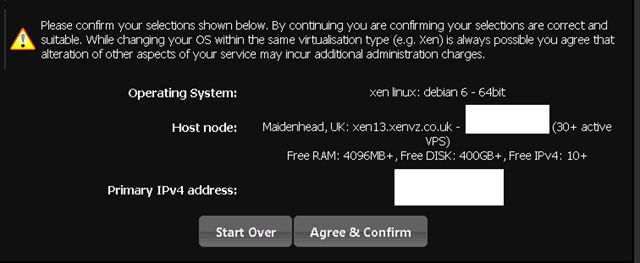
Finally, you get to the confirmation page where all the details are listed and if you click on Confirm, you will be provisioned with the VPS, note that there is possible “administration charge” if you decide to change certain aspects of the server later on.
The provision step will take a few minutes but once when the server is ready, here is what you see:

Note that when the server is automatically created, a random password is assigned to the VPS server as a root password, this is the only place that you will see this particular root password so make sure you note it somewhere unless you want to reset root password later on.
The control panel used by OpenITC/XenVZ is basically developed in house and they have just redeveloped the entire control panel late last year. It is not using AJAX and looks a lot more “modern” than the previous version of it:
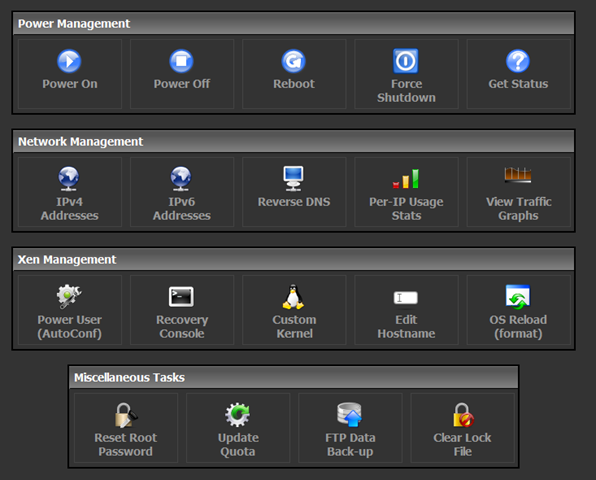
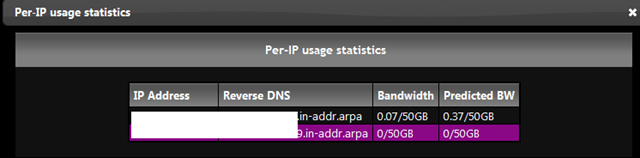
As you can see, this control panel basically provides many of the standard features of the SolusVM user interface, plus a lot more. For example, the control panel will show you the Per-IP usage which is similar to the graph below:
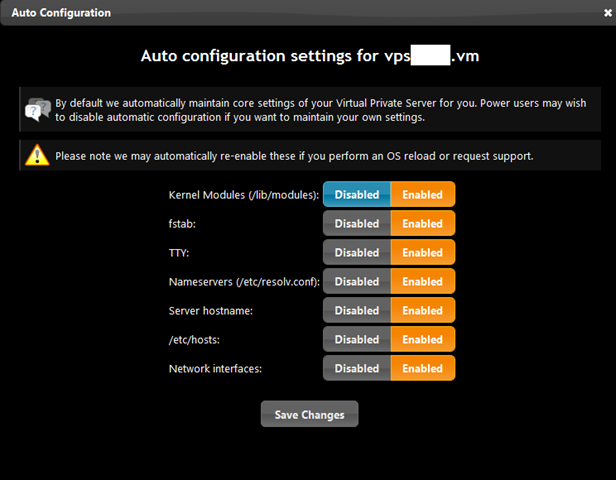
There are also options to run custom kernel and power user mode, which would be pretty interesting if you are someone would like to run your own stuff:
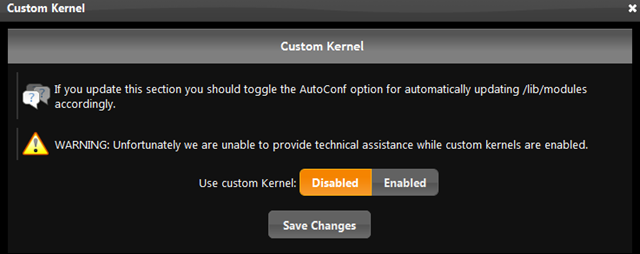
Note that there won’t be any support when the custom kernels are enabled:
One feature that I really like about their VPS is the lock file feature where if your VPS is currently performing an action which did not complete, the system will automatically prevent you from performing the next action until either the previous action is completed (and the lock file is removed) or manually removed the lock file. In fact, if you tried to perform an action without waiting for the previous one to complete, you get a warning like this:

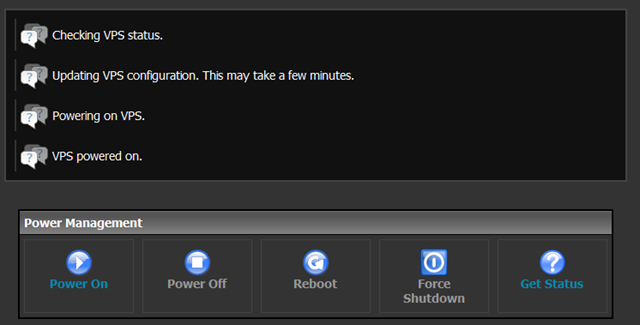
Powering on a VPS through the control panel does take a while, and is in fact a little longer than the amount of time taken to boot up the VPS in a standard SolusVM control panel, however, since the steps are being displayed, it actually makes me feel a lot “better” to watch things that are progressing.
The unfortunate bit with the VPS is that the ability to have create a FTP account for the VPS users to back up their VPS, is not available, and when you click on FTP Data Backup, here is what you see:

There is also no IPv6 address available for the VPS although the functionality is there:

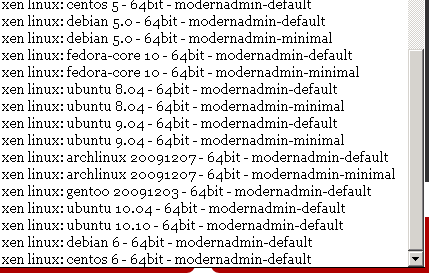
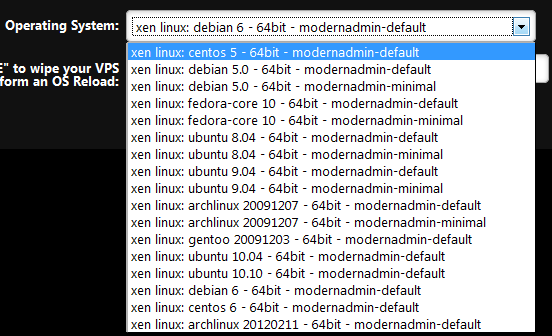
Finally, here is the list of OS templates available for Xen virtualization, note that only 64 bit OS are available and the only minimal installation for Debian is Debian 5.0 and there is no minimal templates for CentOS as well:
Test on the VPS
As mentioned above, the VPS has 256MB of RAM, 5GB of hard drive space and 50GB of monthly bandwidth, the VPS is located in Maidenhead, UK and I have installed Debian 6 64 bit (default) for testing purposes.
After performing a fresh installation, 13MB of RAM was used, which is pretty standard:
 free -m
             total       used       free     shared    buffers     cached
Mem:           244         30        213          0          0         16
-/+ buffers/cache:         13        230
Swap:          255          0        255
Top output showing the processes running:
top - 20:46:31 up 4 min,  1 user,  load average: 0.00, 0.01, 0.01
Tasks:  41 total,   1 running,  40 sleeping,   0 stopped,   0 zombie
Cpu(s):  0.0%us,  0.0%sy,  0.0%ni,100.0%id,  0.0%wa,  0.0%hi,  0.0%si,  0.0%st
Mem:    249944k total,    31828k used,   218116k free,      880k buffers
Swap:   262140k total,        0k used,   262140k free,    16504k cached

  PID USER      PR  NI  VIRT  RES  SHR S %CPU %MEM    TIME+  COMMAND
  704 root      20   0 70504 3320 2620 S    0  1.3   0:00.03 sshd
  707 root      20   0 17740 1868 1404 S    0  0.7   0:00.01 bash
  623 root      20   0 54204 1440 1072 S    0  0.6   0:00.01 rsyslogd
  716 root      20   0 18980 1176  916 R    0  0.5   0:00.01 top
  685 root      20   0 49216 1112  560 S    0  0.4   0:00.00 sshd
  656 root      20   0 20948  828  636 S    0  0.3   0:00.00 cron
    1 root      20   0  8400  768  640 S    0  0.3   0:00.06 init
  188 root      16  -4 16796  740  372 S    0  0.3   0:00.03 udevd
  256 root      18  -2 16792  664  296 S    0  0.3   0:00.00 udevd
  239 root      18  -2 16792  660  296 S    0  0.3   0:00.00 udevd
  703 root      20   0  5976  620  516 S    0  0.2   0:00.00 getty
  667 messageb  20   0 23308  420  204 S    0  0.2   0:00.00 dbus-daemon
    2 root      20   0     0    0    0 S    0  0.0   0:00.00 kthreadd
    3 root      20   0     0    0    0 S    0  0.0   0:00.00 ksoftirqd/0
    4 root      20   0     0    0    0 S    0  0.0   0:00.04 kworker/0:0
    5 root      20   0     0    0    0 S    0  0.0   0:00.00 kworker/u:0
    6 root      RT   0     0    0    0 S    0  0.0   0:00.00 migration/0
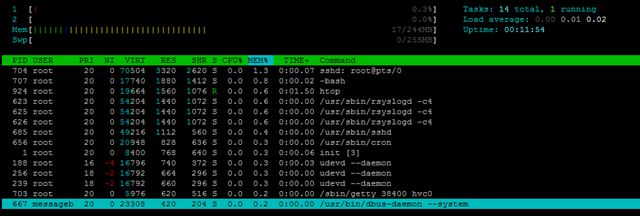
And the htop output as well:
About 576MB of hard drive space were used:
df -h
Filesystem            Size  Used Avail Use% Mounted on
/dev/xvda2            5.0G  576M  4.2G  13% /
tmpfs                 123M     0  123M   0% /lib/init/rw
udev                  119M  112K  119M   1% /dev
tmpfs                 123M     0  123M   0% /dev/shm
And the Inodes settings are pretty standard:
 df -i
Filesystem            Inodes   IUsed   IFree IUse% Mounted on
/dev/xvda2            655360   18241  637119    3% /
tmpfs                  31243       4   31239    1% /lib/init/rw
udev                   30426     488   29938    2% /dev
tmpfs                  31243       1   31242    1% /dev/shm
After the installation of the LNMP stack, the VPS uses about 89MB of RAM:
 free -m
             total       used       free     shared    buffers     cached
Mem:           244        238          5          0        101         47
-/+ buffers/cache:         89        155
Swap:          255          6        249
And 2GB of hard drive space was used:
df -h
Filesystem            Size  Used Avail Use% Mounted on
/dev/xvda2            5.0G  2.0G  2.8G  43% /
tmpfs                 123M     0  123M   0% /lib/init/rw
udev                  119M  112K  119M   1% /dev
tmpfs                 123M     0  123M   0% /dev/shm
Top output showing the stack running:
top - 07:14:33 up 9 days,  2:32,  2 users,  load average: 0.00, 0.01, 0.05
Tasks:  53 total,   1 running,  52 sleeping,   0 stopped,   0 zombie
Cpu(s):  0.0%us,  0.1%sy,  0.0%ni, 99.9%id,  0.0%wa,  0.0%hi,  0.0%si,  0.0%st
Mem:    249944k total,   244044k used,     5900k free,   104156k buffers
Swap:   262140k total,     6256k used,   255884k free,    48584k cached

  PID USER      PR  NI  VIRT  RES  SHR S %CPU %MEM    TIME+  COMMAND
 4468 www       20   0 50172  17m  720 S    0  7.3   0:00.13 nginx
 4462 www       20   0  104m 5412 1132 S    0  2.2   0:00.01 php-cgi
 4460 www       20   0  104m 5364 1120 S    0  2.1   0:00.01 php-cgi
 4461 www       20   0  104m 5264  984 S    0  2.1   0:00.01 php-cgi
 4463 www       20   0  104m 5260  984 S    0  2.1   0:00.01 php-cgi
 4459 root      20   0  104m 5252 1008 S    0  2.1   4:07.54 php-cgi
 4464 www       20   0  104m 5244  984 S    0  2.1   0:00.01 php-cgi
16944 mysql     20   0  115m 4308 1152 S    0  1.7   0:00.02 mysqld
12635 root      20   0 70544 3352 2652 S    0  1.3   0:00.03 sshd
12617 root      20   0 70544 3336 2652 S    0  1.3   0:00.04 sshd
12622 root      20   0 17748 1884 1420 S    0  0.8   0:00.01 bash
12638 root      20   0 17748 1880 1420 S    0  0.8   0:00.01 bash
12645 root      20   0 18988 1204  932 R    0  0.5   0:00.01 top
 4467 root      20   0 30160  880  180 S    0  0.4   0:00.00 nginx
  623 root      20   0  116m  656  548 S    0  0.3   0:27.88 rsyslogd
16842 root      20   0  4004  556  452 S    0  0.2   0:00.01 mysqld_safe
    1 root      20   0  8404  532  504 S    0  0.2   0:12.91 init
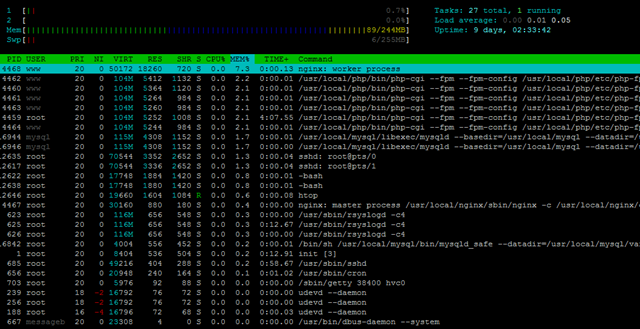
And the htop output for the htop fans:
Uptime shows the box is slightly used, however is fairly stable:
uptime
 07:16:13 up 9 days,  2:34,  2 users,  load average: 0.00, 0.01, 0.05
And vmstat shows the similar results:
 vmstat
procs -----------memory---------- ---swap-- -----io---- -system-- ----cpu----
 r  b   swpd   free   buff  cache   si   so    bi    bo   in   cs us sy id wa
 0  0   6256   5416 104172  48896    0    0     0     1   10    5  0  0 99  0
CPUInfo shows there are 2 cores available, both of which are not throttled:
cat /proc/cpuinfo
processor       : 0
vendor_id       : GenuineIntel
cpu family      : 6
model           : 23
model name      : Intel(R) Xeon(R) CPU           L5410  @ 2.33GHz
stepping        : 10
cpu MHz         : 2333.414
cache size      : 6144 KB
fpu             : yes
fpu_exception   : yes
cpuid level     : 13
wp              : yes
flags           : fpu tsc msr pae cx8 cmov pat clflush mmx fxsr sse sse2 ss ht syscall nx lm constant_tsc rep_good nopl aperfmperf pni vmx est ssse3 cx16 sse4_1 hypervisor lahf_lm dts tpr_shadow vnmi flexpriority
bogomips        : 4666.82
clflush size    : 64
cache_alignment : 64
address sizes   : 38 bits physical, 48 bits virtual
power management:

processor       : 1
vendor_id       : GenuineIntel
cpu family      : 6
model           : 23
model name      : Intel(R) Xeon(R) CPU           L5410  @ 2.33GHz
stepping        : 10
cpu MHz         : 2333.414
cache size      : 6144 KB
fpu             : yes
fpu_exception   : yes
cpuid level     : 13
wp              : yes
flags           : fpu tsc msr pae cx8 cmov pat clflush mmx fxsr sse sse2 ss ht syscall nx lm constant_tsc rep_good nopl aperfmperf pni vmx est ssse3 cx16 sse4_1 hypervisor lahf_lm dts tpr_shadow vnmi flexpriority
bogomips        : 4666.82
clflush size    : 64
cache_alignment : 64
address sizes   : 38 bits physical, 48 bits virtual
power management:
And the meminfo were displayed as follows:
cat /proc/meminfo
MemTotal:         249944 kB
MemFree:            5376 kB
Buffers:           47180 kB
Cached:           140884 kB
SwapCached:         4056 kB
Active:            76008 kB
Inactive:         146492 kB
Active(anon):      11660 kB
Inactive(anon):    22812 kB
Active(file):      64348 kB
Inactive(file):   123680 kB
Unevictable:           0 kB
Mlocked:               0 kB
SwapTotal:        262140 kB
SwapFree:         255872 kB
Dirty:                68 kB
Writeback:             0 kB
AnonPages:         30548 kB
Mapped:             4564 kB
Shmem:                16 kB
Slab:              14336 kB
SReclaimable:      10112 kB
SUnreclaim:         4224 kB
KernelStack:         448 kB
PageTables:         2560 kB
NFS_Unstable:          0 kB
Bounce:                0 kB
WritebackTmp:          0 kB
CommitLimit:      387112 kB
Committed_AS:     121212 kB
VmallocTotal:   34359738367 kB
VmallocUsed:        1152 kB
VmallocChunk:   34359737160 kB
HardwareCorrupted:     0 kB
HugePages_Total:       0
HugePages_Free:        0
HugePages_Rsvd:        0
HugePages_Surp:        0
Hugepagesize:       2048 kB
DirectMap4k:      262144 kB
DirectMap2M:           0 kB
And time sync results:
time sync

real    0m0.076s
user    0m0.000s
sys     0m0.000s
The disk I/O is pretty good at about 70MB/s:
dd if=/dev/zero of=test bs=64k count=16k conv=fdatasync
16384+0 records in
16384+0 records out
1073741824 bytes (1.1 GB) copied, 14.6398 s, 73.3 MB/s
Test again showed slightly worse results:
dd if=/dev/zero of=test bs=64k count=16k conv=fdatasync
16384+0 records in
16384+0 records out
1073741824 bytes (1.1 GB) copied, 15.3003 s, 70.2 MB/s
However,the IOping results seems to indicate the output is not very stable:
 ioping -c 10 .
4096 bytes from . (ext3 /dev/xvda2): request=1 time=0.2 ms
4096 bytes from . (ext3 /dev/xvda2): request=2 time=0.4 ms
4096 bytes from . (ext3 /dev/xvda2): request=3 time=94.1 ms
4096 bytes from . (ext3 /dev/xvda2): request=4 time=12.5 ms
4096 bytes from . (ext3 /dev/xvda2): request=5 time=0.3 ms
4096 bytes from . (ext3 /dev/xvda2): request=6 time=0.5 ms
4096 bytes from . (ext3 /dev/xvda2): request=7 time=0.3 ms
4096 bytes from . (ext3 /dev/xvda2): request=8 time=16.2 ms
4096 bytes from . (ext3 /dev/xvda2): request=9 time=18.2 ms
4096 bytes from . (ext3 /dev/xvda2): request=10 time=0.3 ms

--- . (ext3 /dev/xvda2) ioping statistics ---
10 requests completed in 9145.7 ms, 70 iops, 0.3 mb/s
min/avg/max/mdev = 0.2/14.3/94.1/27.5 ms
Testing again showed similar results:
ioping -c 10 .
4096 bytes from . (ext3 /dev/xvda2): request=1 time=28.0 ms
4096 bytes from . (ext3 /dev/xvda2): request=2 time=6.9 ms
4096 bytes from . (ext3 /dev/xvda2): request=3 time=0.3 ms
4096 bytes from . (ext3 /dev/xvda2): request=4 time=11.9 ms
4096 bytes from . (ext3 /dev/xvda2): request=5 time=15.8 ms
4096 bytes from . (ext3 /dev/xvda2): request=6 time=0.2 ms
4096 bytes from . (ext3 /dev/xvda2): request=7 time=17.3 ms
4096 bytes from . (ext3 /dev/xvda2): request=8 time=0.3 ms
4096 bytes from . (ext3 /dev/xvda2): request=9 time=22.5 ms
4096 bytes from . (ext3 /dev/xvda2): request=10 time=17.1 ms

--- . (ext3 /dev/xvda2) ioping statistics ---
10 requests completed in 9123.1 ms, 83 iops, 0.3 mb/s
min/avg/max/mdev = 0.2/12.0/28.0/9.3 ms
The network speed seems to be really good though, on the 100Mbit port, I was able to get close to 10MB/s in the Cachefly download test:
wget cachefly.cachefly.net/100mb.test -O /dev/null
--2012-02-13 07:20:02--  http://cachefly.cachefly.net/100mb.test
Resolving cachefly.cachefly.net... 205.234.175.175
Connecting to cachefly.cachefly.net|205.234.175.175|:80... connected.
HTTP request sent, awaiting response... 200 OK
Length: 104857600 (100M) [application/octet-stream]
Saving to: `/dev/null'

100%[=======================================================================================================================================>] 104,857,600 9.69M/s   in 10s

2012-02-13 07:20:12 (9.65 MB/s) - `/dev/null' saved [104857600/104857600]
Testing again actually showed similar results:
 wget cachefly.cachefly.net/100mb.test -O /dev/null
--2012-02-13 07:21:14--  http://cachefly.cachefly.net/100mb.test
Resolving cachefly.cachefly.net... 205.234.175.175
Connecting to cachefly.cachefly.net|205.234.175.175|:80... connected.
HTTP request sent, awaiting response... 200 OK
Length: 104857600 (100M) [application/octet-stream]
Saving to: `/dev/null'

100%[=======================================================================================================================================>] 104,857,600 10.1M/s   in 10s

2012-02-13 07:21:24 (9.84 MB/s) - `/dev/null' saved [104857600/104857600]
The upload speed is pretty impressive as well:
First is the test VPS from Buffalo VPS in Chicago, IL:
 wget http://149.xxx.xxx.xxx/100mb.test -O /dev/null
--2012-02-12 18:23:51--  http://149.xxx.xxx.xxx/100mb.test
Connecting to 149.xxx.xxx.xxx:80... connected.
HTTP request sent, awaiting response... 200 OK
Length: 104857600 (100M) [application/octet-stream]
Saving to: `/dev/null'

100%[======================================>] 104,857,600 5.43M/s   in 21s

2012-02-12 18:24:11 (4.84 MB/s) - `/dev/null' saved [104857600/104857600]
The next one would be from the BuyVM VPS in San Jose, CA:
 wget http://149.xxx.xxx.xxx/100mb.test -O /dev/null
--2012-02-12 23:24:41--  http://149.xxx.xxx.xxx/100mb.test
Connecting to 149.xxx.xxx.xxx:80... connected.
HTTP request sent, awaiting response... 200 OK
Length: 104857600 (100M) [application/octet-stream]
Saving to: `/dev/null'

100%[======================================>] 104,857,600 4.28M/s   in 25s

2012-02-12 23:25:06 (4.01 MB/s) - `/dev/null' saved [104857600/104857600]
Finally, as I have decided not to renew my contract with Quickweb on the VPS in London, UK (primarily due to cost reasons), I have decided to use the VPS from Inception Hosting as my new upload speed test server, and here is the results from the VPS in Amsterdam in the Netherlands , which has a 1Gbit incoming port:
wget http://149.xxx.xxx.xxx/100mb.test -O /dev/null
--2012-02-12 18:28:17--  http://149.xxx.xxx.xxx/100mb.test
Connecting to 149.xxx.xxx.xxx:80... connected.
HTTP request sent, awaiting response... 200 OK
Length: 104857600 (100M) [application/octet-stream]
Saving to: `/dev/null'

100%[======================================>] 104,857,600 8.22M/s   in 12s

2012-02-12 18:28:29 (8.08 MB/s) - `/dev/null' saved [104857600/104857600]
As you can see, the VPS has pretty stable network speed at along both east and west coast in US and really good speed in Europe.
For the benchmarks, unfortunately I was only able to run UnixBench as I do not have a paid version of GeekBench, which is required to run on the 64 bit operating systems.
   #    #  #    #  #  #    #          #####   ######  #    #   ####   #    #
   #    #  ##   #  #   #  #           #    #  #       ##   #  #    #  #    #
   #    #  # #  #  #    ##            #####   #####   # #  #  #       ######
   #    #  #  # #  #    ##            #    #  #       #  # #  #       #    #
   #    #  #   ##  #   #  #           #    #  #       #   ##  #    #  #    #
    ####   #    #  #  #    #          #####   ######  #    #   ####   #    #

   Version 5.1.3                      Based on the Byte Magazine Unix Benchmark

   Multi-CPU version                  Version 5 revisions by Ian Smith,
                                      Sunnyvale, CA, USA
   January 13, 2011                   johantheghost at yahoo period com


1 x Dhrystone 2 using register variables  1 2 3 4 5 6 7 8 9 10

1 x Double-Precision Whetstone  1 2 3 4 5 6 7 8 9 10

1 x Execl Throughput  1 2 3

1 x File Copy 1024 bufsize 2000 maxblocks  1 2 3

1 x File Copy 256 bufsize 500 maxblocks  1 2 3

1 x File Copy 4096 bufsize 8000 maxblocks  1 2 3

1 x Pipe Throughput  1 2 3 4 5 6 7 8 9 10

1 x Pipe-based Context Switching  1 2 3 4 5 6 7 8 9 10

1 x Process Creation  1 2 3

1 x System Call Overhead  1 2 3 4 5 6 7 8 9 10

1 x Shell Scripts (1 concurrent)  1 2 3

1 x Shell Scripts (8 concurrent)  1 2 3

2 x Dhrystone 2 using register variables  1 2 3 4 5 6 7 8 9 10

2 x Double-Precision Whetstone  1 2 3 4 5 6 7 8 9 10

2 x Execl Throughput  1 2 3

2 x File Copy 1024 bufsize 2000 maxblocks  1 2 3

2 x File Copy 256 bufsize 500 maxblocks  1 2 3

2 x File Copy 4096 bufsize 8000 maxblocks  1 2 3

2 x Pipe Throughput  1 2 3 4 5 6 7 8 9 10

2 x Pipe-based Context Switching  1 2 3 4 5 6 7 8 9 10

2 x Process Creation  1 2 3

2 x System Call Overhead  1 2 3 4 5 6 7 8 9 10

2 x Shell Scripts (1 concurrent)  1 2 3

2 x Shell Scripts (8 concurrent)  1 2 3

========================================================================
   BYTE UNIX Benchmarks (Version 5.1.3)

   System: ******: GNU/Linux
   OS: GNU/Linux -- 2.6.39.1-cs-domU -- #1 SMP Sun Jun 19 13:07:54 UTC 2011
   Machine: x86_64 (unknown)
   Language: en_US.utf8 (charmap="ANSI_X3.4-1968", collate="ANSI_X3.4-1968")
   CPU 0: Intel(R) Xeon(R) CPU L5410 @ 2.33GHz (4666.8 bogomips)
          Hyper-Threading, x86-64, MMX, Physical Address Ext, SYSCALL/SYSRET, Intel virtualization
   CPU 1: Intel(R) Xeon(R) CPU L5410 @ 2.33GHz (4666.8 bogomips)
          Hyper-Threading, x86-64, MMX, Physical Address Ext, SYSCALL/SYSRET, Intel virtualization
   05:38:31 up 56 min,  1 user,  load average: 0.00, 0.22, 0.43; runlevel 3

------------------------------------------------------------------------
Benchmark Run: Sat Feb 04 2012 05:38:31 - 06:06:48
2 CPUs in system; running 1 parallel copy of tests

Dhrystone 2 using register variables       21088764.4 lps   (10.0 s, 7 samples)
Double-Precision Whetstone                     2703.0 MWIPS (10.0 s, 7 samples)
Execl Throughput                               1333.2 lps   (29.9 s, 2 samples)
File Copy 1024 bufsize 2000 maxblocks        230191.0 KBps  (30.0 s, 2 samples)
File Copy 256 bufsize 500 maxblocks           65891.7 KBps  (30.0 s, 2 samples)
File Copy 4096 bufsize 8000 maxblocks        542027.3 KBps  (30.1 s, 2 samples)
Pipe Throughput                              404060.7 lps   (10.0 s, 7 samples)
Pipe-based Context Switching                  63195.8 lps   (10.0 s, 7 samples)
Process Creation                               2218.8 lps   (30.0 s, 2 samples)
Shell Scripts (1 concurrent)                   3392.9 lpm   (60.0 s, 2 samples)
Shell Scripts (8 concurrent)                    612.5 lpm   (60.0 s, 2 samples)
System Call Overhead                         402621.7 lps   (10.0 s, 7 samples)

System Benchmarks Index Values               BASELINE       RESULT    INDEX
Dhrystone 2 using register variables         116700.0   21088764.4   1807.1
Double-Precision Whetstone                       55.0       2703.0    491.4
Execl Throughput                                 43.0       1333.2    310.0
File Copy 1024 bufsize 2000 maxblocks          3960.0     230191.0    581.3
File Copy 256 bufsize 500 maxblocks            1655.0      65891.7    398.1
File Copy 4096 bufsize 8000 maxblocks          5800.0     542027.3    934.5
Pipe Throughput                               12440.0     404060.7    324.8
Pipe-based Context Switching                   4000.0      63195.8    158.0
Process Creation                                126.0       2218.8    176.1
Shell Scripts (1 concurrent)                     42.4       3392.9    800.2
Shell Scripts (8 concurrent)                      6.0        612.5   1020.8
System Call Overhead                          15000.0     402621.7    268.4
                                                                   ========
System Benchmarks Index Score                                         470.6

------------------------------------------------------------------------
Benchmark Run: Sat Feb 04 2012 06:06:48 - 06:35:06
2 CPUs in system; running 2 parallel copies of tests

Dhrystone 2 using register variables       41904406.6 lps   (10.0 s, 7 samples)
Double-Precision Whetstone                     5342.5 MWIPS (9.9 s, 7 samples)
Execl Throughput                               1995.3 lps   (29.9 s, 2 samples)
File Copy 1024 bufsize 2000 maxblocks        325560.3 KBps  (30.0 s, 2 samples)
File Copy 256 bufsize 500 maxblocks           92586.0 KBps  (30.0 s, 2 samples)
File Copy 4096 bufsize 8000 maxblocks        749332.0 KBps  (30.1 s, 2 samples)
Pipe Throughput                              798172.7 lps   (10.0 s, 7 samples)
Pipe-based Context Switching                 111972.5 lps   (10.0 s, 7 samples)
Process Creation                               3344.5 lps   (30.0 s, 2 samples)
Shell Scripts (1 concurrent)                   4667.8 lpm   (60.0 s, 2 samples)
Shell Scripts (8 concurrent)                    621.2 lpm   (60.1 s, 2 samples)
System Call Overhead                         728868.7 lps   (10.0 s, 7 samples)

System Benchmarks Index Values               BASELINE       RESULT    INDEX
Dhrystone 2 using register variables         116700.0   41904406.6   3590.8
Double-Precision Whetstone                       55.0       5342.5    971.4
Execl Throughput                                 43.0       1995.3    464.0
File Copy 1024 bufsize 2000 maxblocks          3960.0     325560.3    822.1
File Copy 256 bufsize 500 maxblocks            1655.0      92586.0    559.4
File Copy 4096 bufsize 8000 maxblocks          5800.0     749332.0   1292.0
Pipe Throughput                               12440.0     798172.7    641.6
Pipe-based Context Switching                   4000.0     111972.5    279.9
Process Creation                                126.0       3344.5    265.4
Shell Scripts (1 concurrent)                     42.4       4667.8   1100.9
Shell Scripts (8 concurrent)                      6.0        621.2   1035.3
System Call Overhead                          15000.0     728868.7    485.9
                                                                   ========
System Benchmarks Index Score                                         736.3
Testing again showed slightly worse but still acceptable results:
   #    #  #    #  #  #    #          #####   ######  #    #   ####   #    #
   #    #  ##   #  #   #  #           #    #  #       ##   #  #    #  #    #
   #    #  # #  #  #    ##            #####   #####   # #  #  #       ######
   #    #  #  # #  #    ##            #    #  #       #  # #  #       #    #
   #    #  #   ##  #   #  #           #    #  #       #   ##  #    #  #    #
    ####   #    #  #  #    #          #####   ######  #    #   ####   #    #

   Version 5.1.3                      Based on the Byte Magazine Unix Benchmark

   Multi-CPU version                  Version 5 revisions by Ian Smith,
                                      Sunnyvale, CA, USA
   January 13, 2011                   johantheghost at yahoo period com


1 x Dhrystone 2 using register variables  1 2 3 4 5 6 7 8 9 10

1 x Double-Precision Whetstone  1 2 3 4 5 6 7 8 9 10

1 x Execl Throughput  1 2 3

1 x File Copy 1024 bufsize 2000 maxblocks  1 2 3

1 x File Copy 256 bufsize 500 maxblocks  1 2 3

1 x File Copy 4096 bufsize 8000 maxblocks  1 2 3

1 x Pipe Throughput  1 2 3 4 5 6 7 8 9 10

1 x Pipe-based Context Switching  1 2 3 4 5 6 7 8 9 10

1 x Process Creation  1 2 3

1 x System Call Overhead  1 2 3 4 5 6 7 8 9 10

1 x Shell Scripts (1 concurrent)  1 2 3

1 x Shell Scripts (8 concurrent)  1 2 3

2 x Dhrystone 2 using register variables  1 2 3 4 5 6 7 8 9 10

2 x Double-Precision Whetstone  1 2 3 4 5 6 7 8 9 10

2 x Execl Throughput  1 2 3

2 x File Copy 1024 bufsize 2000 maxblocks  1 2 3

2 x File Copy 256 bufsize 500 maxblocks  1 2 3

2 x File Copy 4096 bufsize 8000 maxblocks  1 2 3

2 x Pipe Throughput  1 2 3 4 5 6 7 8 9 10

2 x Pipe-based Context Switching  1 2 3 4 5 6 7 8 9 10

2 x Process Creation  1 2 3

2 x System Call Overhead  1 2 3 4 5 6 7 8 9 10

2 x Shell Scripts (1 concurrent)  1 2 3

2 x Shell Scripts (8 concurrent)  1 2 3

========================================================================
   BYTE UNIX Benchmarks (Version 5.1.3)

   System: ****: GNU/Linux
   OS: GNU/Linux -- 2.6.39.1-cs-domU -- #1 SMP Sun Jun 19 13:07:54 UTC 2011
   Machine: x86_64 (unknown)
   Language: en_US.utf8 (charmap="ANSI_X3.4-1968", collate="ANSI_X3.4-1968")
   CPU 0: Intel(R) Xeon(R) CPU L5410 @ 2.33GHz (4666.8 bogomips)
          Hyper-Threading, x86-64, MMX, Physical Address Ext, SYSCALL/SYSRET, Intel virtualization
   CPU 1: Intel(R) Xeon(R) CPU L5410 @ 2.33GHz (4666.8 bogomips)
          Hyper-Threading, x86-64, MMX, Physical Address Ext, SYSCALL/SYSRET, Intel virtualization
   07:28:05 up 9 days,  2:46,  2 users,  load average: 0.00, 0.06, 0.09; runlevel 3

------------------------------------------------------------------------
Benchmark Run: Mon Feb 13 2012 07:28:05 - 07:56:22
2 CPUs in system; running 1 parallel copy of tests

Dhrystone 2 using register variables       20801035.9 lps   (10.0 s, 7 samples)
Double-Precision Whetstone                     2672.7 MWIPS (10.0 s, 7 samples)
Execl Throughput                               1312.9 lps   (29.8 s, 2 samples)
File Copy 1024 bufsize 2000 maxblocks        223143.3 KBps  (30.1 s, 2 samples)
File Copy 256 bufsize 500 maxblocks           64934.9 KBps  (30.0 s, 2 samples)
File Copy 4096 bufsize 8000 maxblocks        523131.8 KBps  (30.1 s, 2 samples)
Pipe Throughput                              394399.5 lps   (10.0 s, 7 samples)
Pipe-based Context Switching                  61868.1 lps   (10.0 s, 7 samples)
Process Creation                               2220.3 lps   (30.0 s, 2 samples)
Shell Scripts (1 concurrent)                   3325.2 lpm   (60.0 s, 2 samples)
Shell Scripts (8 concurrent)                    592.9 lpm   (60.1 s, 2 samples)
System Call Overhead                         398017.9 lps   (10.0 s, 7 samples)

System Benchmarks Index Values               BASELINE       RESULT    INDEX
Dhrystone 2 using register variables         116700.0   20801035.9   1782.4
Double-Precision Whetstone                       55.0       2672.7    485.9
Execl Throughput                                 43.0       1312.9    305.3
File Copy 1024 bufsize 2000 maxblocks          3960.0     223143.3    563.5
File Copy 256 bufsize 500 maxblocks            1655.0      64934.9    392.4
File Copy 4096 bufsize 8000 maxblocks          5800.0     523131.8    902.0
Pipe Throughput                               12440.0     394399.5    317.0
Pipe-based Context Switching                   4000.0      61868.1    154.7
Process Creation                                126.0       2220.3    176.2
Shell Scripts (1 concurrent)                     42.4       3325.2    784.3
Shell Scripts (8 concurrent)                      6.0        592.9    988.2
System Call Overhead                          15000.0     398017.9    265.3
                                                                   ========
System Benchmarks Index Score                                         461.7

------------------------------------------------------------------------
Benchmark Run: Mon Feb 13 2012 07:56:22 - 08:24:35
2 CPUs in system; running 2 parallel copies of tests

Dhrystone 2 using register variables       40952460.0 lps   (10.0 s, 7 samples)
Double-Precision Whetstone                     5212.4 MWIPS (10.0 s, 7 samples)
Execl Throughput                               2006.5 lps   (29.9 s, 2 samples)
File Copy 1024 bufsize 2000 maxblocks        322078.2 KBps  (30.0 s, 2 samples)
File Copy 256 bufsize 500 maxblocks           90502.1 KBps  (30.0 s, 2 samples)
File Copy 4096 bufsize 8000 maxblocks        711151.8 KBps  (30.1 s, 2 samples)
Pipe Throughput                              689154.5 lps   (10.0 s, 7 samples)
Pipe-based Context Switching                  99829.8 lps   (10.0 s, 7 samples)
Process Creation                               2961.7 lps   (30.0 s, 2 samples)
Shell Scripts (1 concurrent)                   4605.0 lpm   (60.0 s, 2 samples)
Shell Scripts (8 concurrent)                    602.7 lpm   (60.1 s, 2 samples)
System Call Overhead                         715324.9 lps   (10.0 s, 7 samples)

System Benchmarks Index Values               BASELINE       RESULT    INDEX
Dhrystone 2 using register variables         116700.0   40952460.0   3509.2
Double-Precision Whetstone                       55.0       5212.4    947.7
Execl Throughput                                 43.0       2006.5    466.6
File Copy 1024 bufsize 2000 maxblocks          3960.0     322078.2    813.3
File Copy 256 bufsize 500 maxblocks            1655.0      90502.1    546.8
File Copy 4096 bufsize 8000 maxblocks          5800.0     711151.8   1226.1
Pipe Throughput                               12440.0     689154.5    554.0
Pipe-based Context Switching                   4000.0      99829.8    249.6
Process Creation                                126.0       2961.7    235.1
Shell Scripts (1 concurrent)                     42.4       4605.0   1086.1
Shell Scripts (8 concurrent)                      6.0        602.7   1004.6
System Call Overhead                          15000.0     715324.9    476.9
                                                                   ========
System Benchmarks Index Score                                         701.9
For a VPS with 2 cores of CPU, this results seems to be rather impressive and is more than sufficient for majority of the users.
Customer Service and Support
The customer support channels for OpenITC has not been changed since my last review, basically there are 3 different ways to reach them: email (either using the contact form on the Contact Us page or email them directly), phone and mail (although I am wondering if anyone would send a mail to them asking why their servers are down):

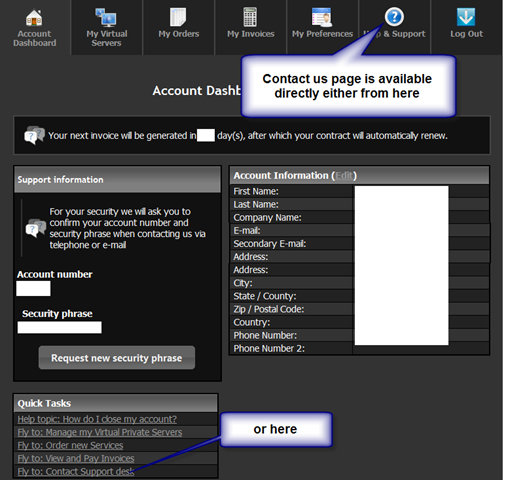
The contact us page can also be accessed directly from the control panel, as well as on one of the quick tasks listed on the account dashboard, which I think is a really great functionality.
For the most part, the response time from XenVZ/OpenITC has been a lot faster than before, and my request submitted to them on a Sunday at 5:57PM on the automatic provision issue was responded by 6:17PM, which is pretty fast and my reply to that email sent on 8:02PM was again answered by 9:22PM. In fact, when I participated on their beta testing offer for another VPS with them, Sean has actually emailed me on how to fix the provisioning issue before I even got a chance to email him about it! Really proactive support indeed.
Conclusion
Although Sean and David are running the entire operations just themselves, they have nonetheless done a very impressive job. The control panel is definitely very functional and the VPS itself has pretty stable network connection as well. Granted the control panel is yet to be perfect, particularly with the issue on automatic provisioning, and I would really hope they could set up a ticketing system rather than just direct email. However, overall the VPS is a good performing one and fairly stable and to me, that is perhaps the most important aspect of a good VPS provider.
Hello,
Thank you for the quality review!
However, our control panel *does* indeed have AJAX! I managed to track down your account and check – you have it disabled for some reason. You can enable it again under “My Preferences” 🙂
Regards,
Sean McRobbie
OpenITC.co.uk
@Sean: My bad, I have disabled AJAX as it is not compatible with my Firefox browser for some reason when I created the VPS, thanks a lot for checking things out!
I have one of the 128mb plans myself as a general sandpit, play with as and when a genius idea strikes me.
Its in Wildcard NE5 DC which is just down the road from me and as such is ideal.
The only thing that is lacking is the customer contact method while already logged in 99% of customers are used to having an integrated contact method, in my case it was for an upgrade not support and I was unable to complete the request because I did not have my security whatsits and hoojars to hand.
We are hoping to have our self-service upgrades system up and running in just a few days 🙂
In addition we will be bringing back our ticketing system soon. The problem is many people still e-mail in regardless.
I’d just go with something like Zendesk. That said, you do seem to have the skills in house to make some pretty nice web front ends!
@Robert: yes, I think in today’s world, having just a bare email account is pretty inefficient, having said that, I actually see quite a few providers providing rock-solid support with email accounts, however I guess you can never go wrong with a better support desk system. Thanks for your input!
I like the efforts you have put in this, appreciate it for all the great blog posts.