
96MB Low End VPS Review Part XXXX – DotVPS
Back in November, DotVPS was featured in LEB for a really sweet deal of getting a 512MB dedicated memory (1024MB burstable memory) VPS for under 5 USD per month. The best part? The Netherland location has a 1Gbps unmetered bandwidth. Yes, I have to say although I have not been in the Low End VPS community for a long time, this is, as far as I can remember, the first(second at most) time that I have seen a 512MB unmetered bandwidth VPS for under 5 USD per month. Little surprise that their stock vanished in just one day. Since then, there were several “incidents” happened to them, such as understaffed, and died hard disks at various times. Nonetheless, Jack has added a few more stocks in the days after the initial stock ran dry and I have decided to pick one up to see how well it works for me.
General Information and Set Up
As per LEB’s post, here is what you are getting for 4.98USD per month:
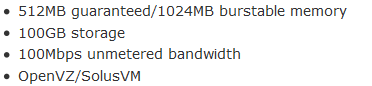
Note that only the Amsterdam location offers unmetered bandwidth at 1Gbit port, the Jacksonville, Florida location only offers 100Mbit port, but both have the same price tag (however the port speed was capped in several occasions due to abuse).
The WHMCS system is using the HTTPS protocol, and the set up was instant, I received the VPS login detail the moment I received the confirmation of payment from Paypal. Payment was made to Jack himself rather than the company. Personally I do not care who is receiving the money on the other end, however a company name and a business Paypal account would definitely be more professional-looking in this case.
The set up email was heavily customized and by no means it looks like the standard email that you will get from SolusVM:

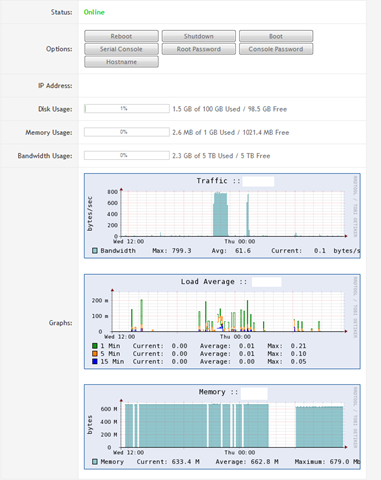
Once you have received the set up email, login into the WHMCS system and you get to see the control panel of the VPS under My Services. The three standard bars and graphs all appear to be working properly and the buttons to control the VPS appears to work as well, I was able to shutdown and boot the VPS, as well as change the root password, through the WHMCS interface, which was something convenient.
The URL of SolusVM was actually not listed on the welcome email directly, instead, a hyperlink link was provided and it is actually running on a standard port on HTTP interface. Yes, you read it correctly, they are actually running SolusVM on port 80! I am not sure why most of the VPS providers do not seems to like the idea of having the SolusVM control panel on port 80, is it really a lot of work to do? I have to say a lot of public Internet (such as the one I used in the airport last month) blocked out most of the non-standard port for safety reasons and having a SolusVM control panel that works on port 80 so that I can control my VPS even when I am running my laptop on public Internet would be really helpful.
In any case, once logged into the SolusVM control panel using the user name assigned by DotVPS, you are greeted by a pretty standard SolusVM interface. Note that there is no IPv6 address available at the moment as I was told that they are still waiting for the upstream to get IPv6 working. Furthermore, apparently you won’t be able to run SIT interface to make use of the IPv6 tunnel by Hurricanes Electric since the interface was not enabled.
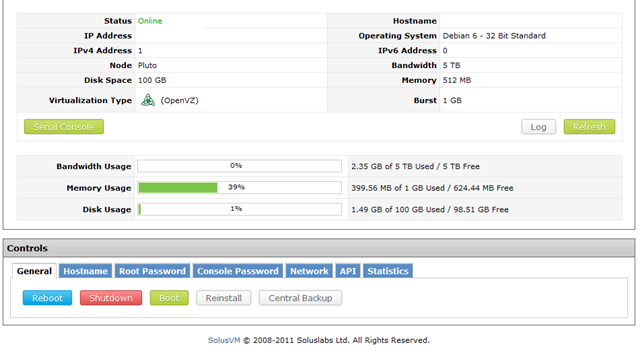
However, there is a highlight though, the Central Backup is enabled in the SolusVM control panel and DotVPS was generous enough to offer not just one, but two, central backup slots. Although this feature does require more hard drive space, which is a cost to the VPS providers, and many of us tend to have our own nightly cron jobs, it is still a feature that is really nice to have. Believe it or not, I am always unlucky enough to have a broken backup on my own NAS at home whenever I am having issue getting 96MB running. In fact, Anthony from InceptionHosting has already seen his comments removed twice due to such issues, and no, I do not hate anyone by the name Anthony.

Instant rDNS is not available though, although I would imagine that it takes just a ticket to get the rDNS set up and running.

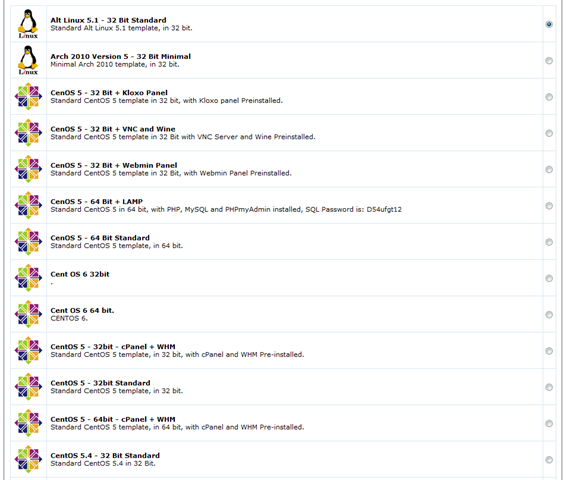
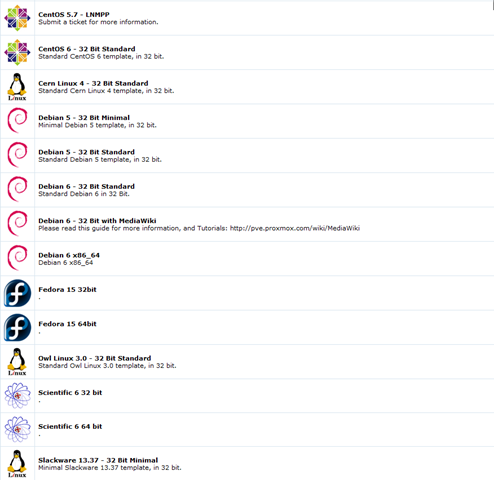
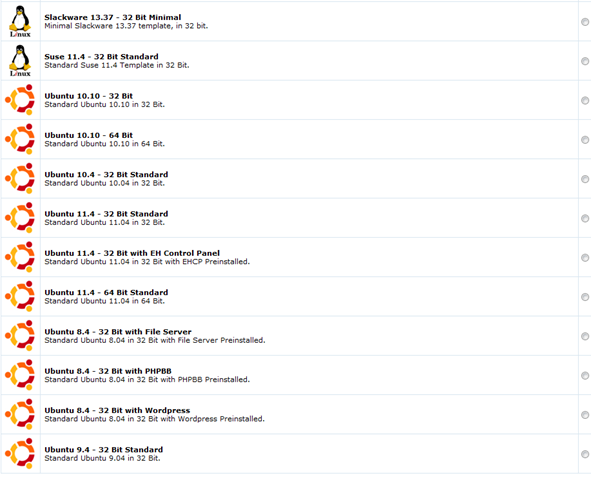
There are quite a few Linux OS distributions available for install, which covers pretty much all the relatively popular Linux distributions that I can think of, best of all, they have several Ubuntu templates with applications such as file server and PHPBB preinstalled, which is really convenient. However those are based on Ubuntu 8.4, which is rather outdated.
Test on the VPS
As mentioned above, the VPS that I have signed up for has 100GB of hard drive space, an amazing 100GB of hard drive space and it is based in Amsterdam, Netherlands, I have installed Debian 6 32 bit for testing purposes.
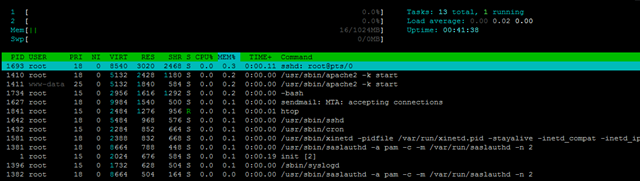
With the fresh OS installation, the VPS uses less than 20MB of memory, which is standard for the OpenVZ VPS.
 free -m
             total       used       free     shared    buffers     cached
Mem:          1024         17       1006          0          0          0
-/+ buffers/cache:         17       1006
Swap:            0          0          0
Top output showing the processes running:
top - 00:02:03 up 22 min,  1 user,  load average: 0.00, 0.00, 0.00
Tasks:  13 total,   1 running,  12 sleeping,   0 stopped,   0 zombie
Cpu(s):  0.0%us,  0.4%sy,  0.0%ni, 99.6%id,  0.0%wa,  0.0%hi,  0.0%si,  0.0%st
Mem:   1048576k total,    16944k used,  1031632k free,        0k buffers
Swap:        0k total,        0k used,        0k free,        0k cached

  PID USER      PR  NI  VIRT  RES  SHR S %CPU %MEM    TIME+  COMMAND
 1693 root      15   0  8540 3020 2468 S    0  0.3   0:00.08 sshd
 1410 root      15   0  5132 2428 1180 S    0  0.2   0:00.00 apache2
 1411 www-data  25   0  5132 1840  584 S    0  0.2   0:00.00 apache2
 1734 root      16   0  2956 1608 1288 S    0  0.2   0:00.00 bash
 1627 root      18   0  9984 1540  500 S    0  0.1   0:00.00 sendmail-mta
 1771 root      15   0  2324 1064  872 R    0  0.1   0:00.00 top
 1642 root      18   0  5484  968  576 S    0  0.1   0:00.00 sshd
 1432 root      15   0  2284  852  664 S    0  0.1   0:00.00 cron
 1581 root      18   0  2388  832  668 S    0  0.1   0:00.00 xinetd
 1381 root      18   0  8664  788  448 S    0  0.1   0:00.00 saslauthd
    1 root      15   0  2024  676  584 S    0  0.1   0:00.19 init
 1396 root      15   0  1732  628  504 S    0  0.1   0:00.00 syslogd
 1382 root      18   0  8664  504  164 S    0  0.0   0:00.00 saslauthd
And the htop output:
About 400MB of hard drive space was used after the fresh OS intallation:
df -h
Filesystem            Size  Used Avail Use% Mounted on
/dev/simfs            100G  413M  100G   1% /
tmpfs                 512M     0  512M   0% /lib/init/rw
tmpfs                 512M     0  512M   0% /dev/shm
And the iNodes values are set to pretty high as well:
df -i
Filesystem            Inodes   IUsed   IFree IUse% Mounted on
/dev/simfs           52428800   26125 52402675    1% /
tmpfs                 131072       4  131068    1% /lib/init/rw
tmpfs                 131072       1  131071    1% /dev/shm
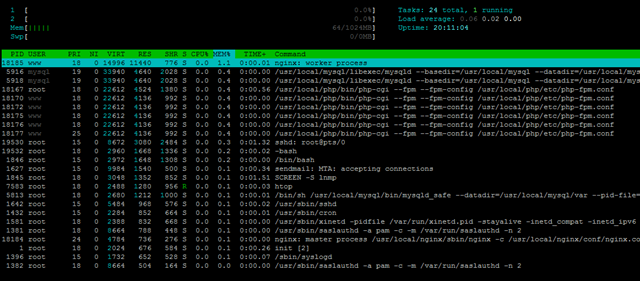
With the full LNMP stack installed, 64MB of RAM was used:
free -m
             total       used       free     shared    buffers     cached
Mem:          1024         64        959          0          0          0
-/+ buffers/cache:         64        959
Swap:            0          0          0
Top output showing the processes running:
top - 08:52:18 up 1 day,  4:12,  1 user,  load average: 0.00, 0.00, 0.00
Tasks:  23 total,   2 running,  21 sleeping,   0 stopped,   0 zombie
Cpu(s):  0.0%us,  0.0%sy,  0.0%ni,100.0%id,  0.0%wa,  0.0%hi,  0.0%si,  0.0%st
Mem:   1048576k total,    65836k used,   982740k free,        0k buffers
Swap:        0k total,        0k used,        0k free,        0k cached

  PID USER      PR  NI  VIRT  RES  SHR S %CPU %MEM    TIME+  COMMAND
18185 www       15   0 14996  11m  776 S    0  1.1   0:00.48 nginx
 5916 mysql     15   0 34236 4872 2216 S    0  0.5   0:00.00 mysqld
18167 root      15   0 22612 4524 1380 S    0  0.4   0:00.82 php-cgi
18170 www       18   0 22612 4136  992 S    0  0.4   0:00.00 php-cgi
18172 www       18   0 22612 4136  992 S    0  0.4   0:00.00 php-cgi
18175 www       18   0 22612 4136  992 S    0  0.4   0:00.00 php-cgi
18176 www       18   0 22612 4136  992 S    0  0.4   0:00.00 php-cgi
18177 www       25   0 22612 4136  992 S    0  0.4   0:00.00 php-cgi
11775 root      16   0  8540 3012 2468 R    0  0.3   0:00.09 sshd
 1846 root      15   0  2972 1648 1308 S    0  0.2   0:00.00 bash
11777 root      16   0  2956 1612 1288 S    0  0.2   0:00.00 bash
 1627 root      18   0  9984 1540  500 S    0  0.1   0:00.49 sendmail-mta
 1845 root      18   0  3048 1352  852 S    0  0.1   0:01.51 screen
 5813 root      18   0  2680 1212 1000 S    0  0.1   0:00.01 mysqld_safe
11783 root      15   0  2324 1068  876 R    0  0.1   0:00.00 top
 1642 root      15   0  5484  968  576 S    0  0.1   0:00.12 sshd
 1432 root      15   0  2284  852  664 S    0  0.1   0:00.02 cron
And the htop output:
2.7GB of hard drive space was used to run the stack:
df -h
Filesystem            Size  Used Avail Use% Mounted on
/dev/simfs            100G  2.7G   98G   3% /
tmpfs                 512M     0  512M   0% /lib/init/rw
tmpfs                 512M     0  512M   0% /dev/shm
Vmstat shows the box is mostly idle:
vmstat
procs -----------memory---------- ---swap-- -----io---- -system-- ----cpu----
 r  b   swpd   free   buff  cache   si   so    bi    bo   in   cs us sy id wa
 0  0      0 1031596      0      0    0    0     0     0    0 5432  0  0 100  0
As well as the uptime output:
 uptime
 10:04:21 up  5:24,  1 user,  load average: 0.00, 0.00, 0.00
Beancounters were set to pretty high values:
cat /proc/user_beancounters
Version: 2.5
       uid  resource                     held              maxheld              barrier                limit              failcnt
      793:  kmemsize                  3064566              3158165           2147483646           2147483646                    0
            lockedpages                     0                    0               999999               999999                    0
            privvmpages                 16720                16696               262144               262144                    0
            shmpages                      642                  658               131072               131072                    0
            dummy                           0                    0                    0                    0                    0
            numproc                        25                   26               999999               999999                    0
            physpages                    7210                 7671                    0           2147483647                    0
            vmguarpages                     0                    0               131072           2147483647                    0
            oomguarpages                 7210                 7671               131072           2147483647                    0
            numtcpsock                      7                    7              7999992              7999992                    0
            numflock                        5                    6               999999               999999                    0
            numpty                          2                    2               500000               500000                    0
            numsiginfo                      0                    2               999999               999999                    0
            tcpsndbuf                  124856               124856            214748160            396774400                    0
            tcprcvbuf                  114688               114688            214748160            396774400                    0
            othersockbuf                11640                29096            214748160            396774400                    0
            dgramrcvbuf                     0                 8472            214748160            396774400                    0
            numothersock                   15                   18              7999992              7999992                    0
            dcachesize                      0                    0           2147483646           2147483646                    0
            numfile                       568                  594             23999976             23999976                    0
            dummy                           0                    0                    0                    0                    0
            dummy                           0                    0                    0                    0                    0
            dummy                           0                    0                    0                    0                    0
            numiptent                      24                   24               999999               999999                    0
CPUInfo shows there are two Xeon E5506 cores assigned to the VPS and none of them are throttled:
cat /proc/cpuinfo
processor       : 0
vendor_id       : GenuineIntel
cpu family      : 6
model           : 26
model name      : Intel(R) Xeon(R) CPU           E5506  @ 2.13GHz
stepping        : 5
cpu MHz         : 2133.463
cache size      : 4096 KB
physical id     : 0
siblings        : 4
core id         : 0
cpu cores       : 4
apicid          : 0
fpu             : yes
fpu_exception   : yes
cpuid level     : 11
wp              : yes
flags           : fpu vme de pse tsc msr pae mce cx8 apic sep mtrr pge mca cmov pat pse36 clflush dts acpi mmx fxsr sse sse2 ss ht tm syscall nx rdtscp lm constant_tsc nonstop_tsc pni monitor ds_cpl vmx est tm2 ssse3 cx16 xtpr sse4_1 sse4_2 popcnt lahf_lm
bogomips        : 4266.92
clflush size    : 64
cache_alignment : 64
address sizes   : 40 bits physical, 48 bits virtual
power management: [8]

processor       : 1
vendor_id       : GenuineIntel
cpu family      : 6
model           : 26
model name      : Intel(R) Xeon(R) CPU           E5506  @ 2.13GHz
stepping        : 5
cpu MHz         : 2133.463
cache size      : 4096 KB
physical id     : 0
siblings        : 4
core id         : 1
cpu cores       : 4
apicid          : 2
fpu             : yes
fpu_exception   : yes
cpuid level     : 11
wp              : yes
flags           : fpu vme de pse tsc msr pae mce cx8 apic sep mtrr pge mca cmov pat pse36 clflush dts acpi mmx fxsr sse sse2 ss ht tm syscall nx rdtscp lm constant_tsc nonstop_tsc pni monitor ds_cpl vmx est tm2 ssse3 cx16 xtpr sse4_1 sse4_2 popcnt lahf_lm
bogomips        : 4312.64
clflush size    : 64
cache_alignment : 64
address sizes   : 40 bits physical, 48 bits virtual
power management: [8]
The output of meminfo does not show anything new:
cat /proc/meminfo
MemTotal:      1048576 kB
MemFree:        982864 kB
Buffers:             0 kB
Cached:              0 kB
SwapCached:          0 kB
Active:              0 kB
Inactive:            0 kB
HighTotal:           0 kB
HighFree:            0 kB
LowTotal:      1048576 kB
LowFree:        982864 kB
SwapTotal:           0 kB
SwapFree:            0 kB
Dirty:            1040 kB
Writeback:           0 kB
AnonPages:           0 kB
Mapped:              0 kB
Slab:                0 kB
PageTables:          0 kB
NFS_Unstable:        0 kB
Bounce:              0 kB
CommitLimit:         0 kB
Committed_AS:        0 kB
VmallocTotal:        0 kB
VmallocUsed:         0 kB
VmallocChunk:        0 kB
HugePages_Total:     0
HugePages_Free:      0
HugePages_Rsvd:      0
Hugepagesize:     2048 kB
And vzfree, which I belive is derived from the beancounters, does not show any signs of memory overselling:
vzfree
             Total     Used     Free
Kernel:   2048.00M    2.92M 2045.08M
Allocate: 1024.00M   64.20M  959.80M (512M Guaranteed)
Commit:    512.00M   32.05M  479.95M (45.4% of Allocated)
Swap:                 0.00M          (0.0% of Committed)
Time sync output is pretty “normal” as well:
time sync

real    0m0.101s
user    0m0.000s
sys     0m0.004s
Disk I/O is actually pretty low, however still within the usable range:
dd if=/dev/zero of=test bs=64k count=16k conv=fdatasync
16384+0 records in
16384+0 records out
1073741824 bytes (1.1 GB) copied, 29.5791 s, 36.3 MB/s
Testing again has once again disappointed me, especially when the disk I/O was in three digit range in the last review:
dd if=/dev/zero of=test bs=64k count=16k conv=fdatasync
16384+0 records in
16384+0 records out
1073741824 bytes (1.1 GB) copied, 26.9211 s, 39.9 MB/s
The ioping is similar to the dd output as well, which shows a long roundtrip time and very unstable readings:
ioping -c 10 .
4096 bytes from . (simfs /dev/simfs): request=1 time=97.4 ms
4096 bytes from . (simfs /dev/simfs): request=2 time=197.6 ms
4096 bytes from . (simfs /dev/simfs): request=3 time=33.9 ms
4096 bytes from . (simfs /dev/simfs): request=4 time=144.4 ms
4096 bytes from . (simfs /dev/simfs): request=5 time=78.5 ms
4096 bytes from . (simfs /dev/simfs): request=6 time=79.2 ms
4096 bytes from . (simfs /dev/simfs): request=7 time=81.9 ms
4096 bytes from . (simfs /dev/simfs): request=8 time=59.4 ms
4096 bytes from . (simfs /dev/simfs): request=9 time=84.2 ms
4096 bytes from . (simfs /dev/simfs): request=10 time=18.0 ms

--- . (simfs /dev/simfs) ioping statistics ---
10 requests completed in 9881.4 ms, 11 iops, 0.0 mb/s
min/avg/max/mdev = 18.0/87.4/197.6/49.1 ms
Testing again did not show anything better:
ioping -c 10 .
4096 bytes from . (simfs /dev/simfs): request=1 time=43.7 ms
4096 bytes from . (simfs /dev/simfs): request=2 time=76.9 ms
4096 bytes from . (simfs /dev/simfs): request=3 time=109.4 ms
4096 bytes from . (simfs /dev/simfs): request=4 time=124.2 ms
4096 bytes from . (simfs /dev/simfs): request=5 time=71.2 ms
4096 bytes from . (simfs /dev/simfs): request=6 time=154.5 ms
4096 bytes from . (simfs /dev/simfs): request=7 time=226.8 ms
4096 bytes from . (simfs /dev/simfs): request=8 time=216.3 ms
4096 bytes from . (simfs /dev/simfs): request=9 time=204.0 ms
4096 bytes from . (simfs /dev/simfs): request=10 time=154.9 ms

--- . (simfs /dev/simfs) ioping statistics ---
10 requests completed in 10387.8 ms, 7 iops, 0.0 mb/s
min/avg/max/mdev = 43.7/138.2/226.8/60.9 ms
The network speed is pretty unstable as well, although I do not really see it is on the Gbit port from the Cachefly download test:
wget cachefly.cachefly.net/100mb.test -O /dev/null
--2011-12-30 11:17:54--  http://cachefly.cachefly.net/100mb.test
Resolving cachefly.cachefly.net... 205.234.175.175
Connecting to cachefly.cachefly.net|205.234.175.175|:80... connected.
HTTP request sent, awaiting response... 200 OK
Length: 104857600 (100M) [application/octet-stream]
Saving to: `/dev/null'

100%[======================================>] 104,857,600 3.18M/s   in 16s

2011-12-30 11:18:10 (6.31 MB/s) - `/dev/null' saved [104857600/104857600]
Testing again, and the results is more or less similar.
 wget cachefly.cachefly.net/100mb.test -O /dev/null
--2011-12-30 11:23:37--  http://cachefly.cachefly.net/100mb.test
Resolving cachefly.cachefly.net... 205.234.175.175
Connecting to cachefly.cachefly.net|205.234.175.175|:80... connected.
HTTP request sent, awaiting response... 200 OK
Length: 104857600 (100M) [application/octet-stream]
Saving to: `/dev/null'

100%[======================================>] 104,857,600 9.46M/s   in 25s

2011-12-30 11:24:02 (4.03 MB/s) - `/dev/null' saved [104857600/104857600]
Quite frankly speaking, it looks to me more like a 100mbit port than a 1Gbit port.
Uploading tests hardly show anyting impressive as well, first from BuffaloVPS in Chicago,IL:
 wget 94.102.55.170/100mb.test -O /dev/null
--2011-12-30 14:58:28--  http://94.102.55.170/100mb.test
Connecting to 94.102.55.170:80... connected.
HTTP request sent, awaiting response... 200 OK
Length: 104857600 (100M) [application/octet-stream]
Saving to: `/dev/null'

100%[======================================>] 104,857,600 2.52M/s   in 33s

2011-12-30 14:59:02 (3.03 MB/s) - `/dev/null' saved [104857600/104857600]
Next, BuyVM in San Jose, CA:
wget 94.102.55.170/100mb.test -O /dev/null
--2011-12-30 19:26:30--  http://94.102.55.170/100mb.test
Connecting to 94.102.55.170:80... connected.
HTTP request sent, awaiting response... 200 OK
Length: 104857600 (100M) [application/octet-stream]
Saving to: `/dev/null'

100%[======================================>] 104,857,600 2.25M/s   in 38s

2011-12-30 19:27:08 (2.66 MB/s) - `/dev/null' saved [104857600/104857600]
Finally, Quickweb in London, UK:
wget 94.102.55.170/100mb.test -O /dev/null
--2011-12-30 19:48:19--  http://94.102.55.170/100mb.test
Connecting to 94.102.55.170:80... connected.
HTTP request sent, awaiting response... 200 OK
Length: 104857600 (100M) [application/octet-stream]
Saving to: `/dev/null'

100%[======================================>] 104,857,600 3.35M/s   in 30s

2011-12-30 19:48:49 (3.33 MB/s) - `/dev/null' saved [104857600/104857600]
As you can see, none of them was more than 4MB/s, which is pretty bad.
Finally, the UnixBench tests, even with two CPU cores that are pretty powerful, barely managed to climb through 1000 points:
   #    #  #    #  #  #    #          #####   ######  #    #   ####   #    #
   #    #  ##   #  #   #  #           #    #  #       ##   #  #    #  #    #
   #    #  # #  #  #    ##            #####   #####   # #  #  #       ######
   #    #  #  # #  #    ##            #    #  #       #  # #  #       #    #
   #    #  #   ##  #   #  #           #    #  #       #   ##  #    #  #    #
    ####   #    #  #  #    #          #####   ######  #    #   ####   #    #

   Version 5.1.3                      Based on the Byte Magazine Unix Benchmark

   Multi-CPU version                  Version 5 revisions by Ian Smith,
                                      Sunnyvale, CA, USA
   January 13, 2011                   johantheghost at yahoo period com


1 x Dhrystone 2 using register variables  1 2 3 4 5 6 7 8 9 10

1 x Double-Precision Whetstone  1 2 3 4 5 6 7 8 9 10

1 x Execl Throughput  1 2 3

1 x File Copy 1024 bufsize 2000 maxblocks  1 2 3

1 x File Copy 256 bufsize 500 maxblocks  1 2 3

1 x File Copy 4096 bufsize 8000 maxblocks  1 2 3

1 x Pipe Throughput  1 2 3 4 5 6 7 8 9 10

1 x Pipe-based Context Switching  1 2 3 4 5 6 7 8 9 10

1 x Process Creation  1 2 3

1 x System Call Overhead  1 2 3 4 5 6 7 8 9 10

1 x Shell Scripts (1 concurrent)  1 2 3

1 x Shell Scripts (8 concurrent)  1 2 3

2 x Dhrystone 2 using register variables  1 2 3 4 5 6 7 8 9 10

2 x Double-Precision Whetstone  1 2 3 4 5 6 7 8 9 10

2 x Execl Throughput  1 2 3

2 x File Copy 1024 bufsize 2000 maxblocks  1 2 3

2 x File Copy 256 bufsize 500 maxblocks  1 2 3

2 x File Copy 4096 bufsize 8000 maxblocks  1 2 3

2 x Pipe Throughput  1 2 3 4 5 6 7 8 9 10

2 x Pipe-based Context Switching  1 2 3 4 5 6 7 8 9 10

2 x Process Creation  1 2 3

2 x System Call Overhead  1 2 3 4 5 6 7 8 9 10

2 x Shell Scripts (1 concurrent)  1 2 3

2 x Shell Scripts (8 concurrent)  1 2 3

========================================================================
   BYTE UNIX Benchmarks (Version 5.1.3)

   System: ******: GNU/Linux
   OS: GNU/Linux -- 2.6.32-274.7.1.el5.028stab095.1 -- #1 SMP Mon Oct 24 20:49:24 MSD 2011
   Machine: i686 (unknown)
   Language: en_US.utf8 (charmap="ANSI_X3.4-1968", collate="ANSI_X3.4-1968")
   CPU 0: Intel(R) Xeon(R) CPU E5506 @ 2.13GHz (4266.9 bogomips)
          Hyper-Threading, x86-64, MMX, Physical Address Ext, SYSENTER/SYSEXIT, SYSCALL/SYSRET, Intel virtualization
   CPU 1: Intel(R) Xeon(R) CPU E5506 @ 2.13GHz (4312.6 bogomips)
          Hyper-Threading, x86-64, MMX, Physical Address Ext, SYSENTER/SYSEXIT, SYSCALL/SYSRET, Intel virtualization
   11:28:14 up  6:48,  1 user,  load average: 0.16, 0.05, 0.01; runlevel 2

------------------------------------------------------------------------
Benchmark Run: Fri Dec 30 2011 11:28:14 - 11:56:57
2 CPUs in system; running 1 parallel copy of tests

Dhrystone 2 using register variables       11262162.4 lps   (10.0 s, 7 samples)
Double-Precision Whetstone                     2206.2 MWIPS (10.2 s, 7 samples)
Execl Throughput                               3242.5 lps   (29.9 s, 2 samples)
File Copy 1024 bufsize 2000 maxblocks        381729.5 KBps  (30.0 s, 2 samples)
File Copy 256 bufsize 500 maxblocks          111409.4 KBps  (30.0 s, 2 samples)
File Copy 4096 bufsize 8000 maxblocks        826808.5 KBps  (30.0 s, 2 samples)
Pipe Throughput                              743841.7 lps   (10.0 s, 7 samples)
Pipe-based Context Switching                 130842.9 lps   (10.0 s, 7 samples)
Process Creation                              10409.7 lps   (30.0 s, 2 samples)
Shell Scripts (1 concurrent)                   4130.5 lpm   (60.1 s, 2 samples)
Shell Scripts (8 concurrent)                    842.5 lpm   (60.0 s, 2 samples)
System Call Overhead                         554891.2 lps   (10.0 s, 7 samples)

System Benchmarks Index Values               BASELINE       RESULT    INDEX
Dhrystone 2 using register variables         116700.0   11262162.4    965.1
Double-Precision Whetstone                       55.0       2206.2    401.1
Execl Throughput                                 43.0       3242.5    754.1
File Copy 1024 bufsize 2000 maxblocks          3960.0     381729.5    964.0
File Copy 256 bufsize 500 maxblocks            1655.0     111409.4    673.2
File Copy 4096 bufsize 8000 maxblocks          5800.0     826808.5   1425.5
Pipe Throughput                               12440.0     743841.7    597.9
Pipe-based Context Switching                   4000.0     130842.9    327.1
Process Creation                                126.0      10409.7    826.2
Shell Scripts (1 concurrent)                     42.4       4130.5    974.2
Shell Scripts (8 concurrent)                      6.0        842.5   1404.2
System Call Overhead                          15000.0     554891.2    369.9
                                                                   ========
System Benchmarks Index Score                                         727.8

------------------------------------------------------------------------
Benchmark Run: Fri Dec 30 2011 11:56:57 - 12:25:23
2 CPUs in system; running 2 parallel copies of tests

Dhrystone 2 using register variables       22238872.5 lps   (10.0 s, 7 samples)
Double-Precision Whetstone                     4414.8 MWIPS (10.2 s, 7 samples)
Execl Throughput                               4317.7 lps   (29.7 s, 2 samples)
File Copy 1024 bufsize 2000 maxblocks        215584.6 KBps  (30.0 s, 2 samples)
File Copy 256 bufsize 500 maxblocks           75353.7 KBps  (30.0 s, 2 samples)
File Copy 4096 bufsize 8000 maxblocks        551178.7 KBps  (30.0 s, 2 samples)
Pipe Throughput                             1476554.1 lps   (10.0 s, 7 samples)
Pipe-based Context Switching                 458690.7 lps   (10.0 s, 7 samples)
Process Creation                              19649.3 lps   (30.0 s, 2 samples)
Shell Scripts (1 concurrent)                   6299.2 lpm   (60.1 s, 2 samples)
Shell Scripts (8 concurrent)                    885.5 lpm   (60.0 s, 2 samples)
System Call Overhead                        1089185.8 lps   (10.0 s, 7 samples)

System Benchmarks Index Values               BASELINE       RESULT    INDEX
Dhrystone 2 using register variables         116700.0   22238872.5   1905.6
Double-Precision Whetstone                       55.0       4414.8    802.7
Execl Throughput                                 43.0       4317.7   1004.1
File Copy 1024 bufsize 2000 maxblocks          3960.0     215584.6    544.4
File Copy 256 bufsize 500 maxblocks            1655.0      75353.7    455.3
File Copy 4096 bufsize 8000 maxblocks          5800.0     551178.7    950.3
Pipe Throughput                               12440.0    1476554.1   1186.9
Pipe-based Context Switching                   4000.0     458690.7   1146.7
Process Creation                                126.0      19649.3   1559.5
Shell Scripts (1 concurrent)                     42.4       6299.2   1485.7
Shell Scripts (8 concurrent)                      6.0        885.5   1475.9
System Call Overhead                          15000.0    1089185.8    726.1
                                                                   ========
System Benchmarks Index Score                                        1016.9
Testing again is only slightly better:
   #    #  #    #  #  #    #          #####   ######  #    #   ####   #    #
   #    #  ##   #  #   #  #           #    #  #       ##   #  #    #  #    #
   #    #  # #  #  #    ##            #####   #####   # #  #  #       ######
   #    #  #  # #  #    ##            #    #  #       #  # #  #       #    #
   #    #  #   ##  #   #  #           #    #  #       #   ##  #    #  #    #
    ####   #    #  #  #    #          #####   ######  #    #   ####   #    #

   Version 5.1.3                      Based on the Byte Magazine Unix Benchmark

   Multi-CPU version                  Version 5 revisions by Ian Smith,
                                      Sunnyvale, CA, USA
   January 13, 2011                   johantheghost at yahoo period com


1 x Dhrystone 2 using register variables  1 2 3 4 5 6 7 8 9 10

1 x Double-Precision Whetstone  1 2 3 4 5 6 7 8 9 10

1 x Execl Throughput  1 2 3

1 x File Copy 1024 bufsize 2000 maxblocks  1 2 3

1 x File Copy 256 bufsize 500 maxblocks  1 2 3

1 x File Copy 4096 bufsize 8000 maxblocks  1 2 3

1 x Pipe Throughput  1 2 3 4 5 6 7 8 9 10

1 x Pipe-based Context Switching  1 2 3 4 5 6 7 8 9 10

1 x Process Creation  1 2 3

1 x System Call Overhead  1 2 3 4 5 6 7 8 9 10

1 x Shell Scripts (1 concurrent)  1 2 3

1 x Shell Scripts (8 concurrent)  1 2 3

2 x Dhrystone 2 using register variables  1 2 3 4 5 6 7 8 9 10

2 x Double-Precision Whetstone  1 2 3 4 5 6 7 8 9 10

2 x Execl Throughput  1 2 3

2 x File Copy 1024 bufsize 2000 maxblocks  1 2 3

2 x File Copy 256 bufsize 500 maxblocks  1 2 3

2 x File Copy 4096 bufsize 8000 maxblocks  1 2 3

2 x Pipe Throughput  1 2 3 4 5 6 7 8 9 10

2 x Pipe-based Context Switching  1 2 3 4 5 6 7 8 9 10

2 x Process Creation  1 2 3

2 x System Call Overhead  1 2 3 4 5 6 7 8 9 10

2 x Shell Scripts (1 concurrent)  1 2 3

2 x Shell Scripts (8 concurrent)  1 2 3

========================================================================
   BYTE UNIX Benchmarks (Version 5.1.3)

   System: *****: GNU/Linux
   OS: GNU/Linux -- 2.6.32-274.7.1.el5.028stab095.1 -- #1 SMP Mon Oct 24 20:49:24 MSD 2011
   Machine: i686 (unknown)
   Language: en_US.utf8 (charmap="ANSI_X3.4-1968", collate="ANSI_X3.4-1968")
   CPU 0: Intel(R) Xeon(R) CPU E5506 @ 2.13GHz (4266.9 bogomips)
          Hyper-Threading, x86-64, MMX, Physical Address Ext, SYSENTER/SYSEXIT, SYSCALL/SYSRET, Intel virtualization
   CPU 1: Intel(R) Xeon(R) CPU E5506 @ 2.13GHz (4312.6 bogomips)
          Hyper-Threading, x86-64, MMX, Physical Address Ext, SYSENTER/SYSEXIT, SYSCALL/SYSRET, Intel virtualization
   12:26:12 up  7:46,  1 user,  load average: 5.03, 5.84, 3.68; runlevel 2

------------------------------------------------------------------------
Benchmark Run: Fri Dec 30 2011 12:26:12 - 12:54:30
2 CPUs in system; running 1 parallel copy of tests

Dhrystone 2 using register variables       11203884.1 lps   (10.0 s, 7 samples)
Double-Precision Whetstone                     2207.7 MWIPS (10.2 s, 7 samples)
Execl Throughput                               3232.6 lps   (29.8 s, 2 samples)
File Copy 1024 bufsize 2000 maxblocks        374614.7 KBps  (30.0 s, 2 samples)
File Copy 256 bufsize 500 maxblocks          116016.1 KBps  (30.0 s, 2 samples)
File Copy 4096 bufsize 8000 maxblocks        891727.3 KBps  (30.0 s, 2 samples)
Pipe Throughput                              736536.7 lps   (10.0 s, 7 samples)
Pipe-based Context Switching                 133382.9 lps   (10.0 s, 7 samples)
Process Creation                              10051.6 lps   (30.0 s, 2 samples)
Shell Scripts (1 concurrent)                   4051.1 lpm   (60.0 s, 2 samples)
Shell Scripts (8 concurrent)                    849.2 lpm   (60.1 s, 2 samples)
System Call Overhead                         579163.2 lps   (10.0 s, 7 samples)

System Benchmarks Index Values               BASELINE       RESULT    INDEX
Dhrystone 2 using register variables         116700.0   11203884.1    960.1
Double-Precision Whetstone                       55.0       2207.7    401.4
Execl Throughput                                 43.0       3232.6    751.8
File Copy 1024 bufsize 2000 maxblocks          3960.0     374614.7    946.0
File Copy 256 bufsize 500 maxblocks            1655.0     116016.1    701.0
File Copy 4096 bufsize 8000 maxblocks          5800.0     891727.3   1537.5
Pipe Throughput                               12440.0     736536.7    592.1
Pipe-based Context Switching                   4000.0     133382.9    333.5
Process Creation                                126.0      10051.6    797.7
Shell Scripts (1 concurrent)                     42.4       4051.1    955.4
Shell Scripts (8 concurrent)                      6.0        849.2   1415.3
System Call Overhead                          15000.0     579163.2    386.1
                                                                   ========
System Benchmarks Index Score                                         733.6

------------------------------------------------------------------------
Benchmark Run: Fri Dec 30 2011 12:54:30 - 13:22:34
2 CPUs in system; running 2 parallel copies of tests

Dhrystone 2 using register variables       21707006.5 lps   (10.0 s, 7 samples)
Double-Precision Whetstone                     4410.9 MWIPS (10.2 s, 7 samples)
Execl Throughput                               4164.8 lps   (29.9 s, 2 samples)
File Copy 1024 bufsize 2000 maxblocks        236158.3 KBps  (30.1 s, 2 samples)
File Copy 256 bufsize 500 maxblocks           76955.1 KBps  (30.0 s, 2 samples)
File Copy 4096 bufsize 8000 maxblocks        590499.2 KBps  (30.0 s, 2 samples)
Pipe Throughput                             1447286.5 lps   (10.0 s, 7 samples)
Pipe-based Context Switching                 466715.7 lps   (10.0 s, 7 samples)
Process Creation                              19115.1 lps   (30.0 s, 2 samples)
Shell Scripts (1 concurrent)                   6564.6 lpm   (60.0 s, 2 samples)
Shell Scripts (8 concurrent)                    949.6 lpm   (60.1 s, 2 samples)
System Call Overhead                        1085338.3 lps   (10.0 s, 7 samples)

System Benchmarks Index Values               BASELINE       RESULT    INDEX
Dhrystone 2 using register variables         116700.0   21707006.5   1860.1
Double-Precision Whetstone                       55.0       4410.9    802.0
Execl Throughput                                 43.0       4164.8    968.6
File Copy 1024 bufsize 2000 maxblocks          3960.0     236158.3    596.4
File Copy 256 bufsize 500 maxblocks            1655.0      76955.1    465.0
File Copy 4096 bufsize 8000 maxblocks          5800.0     590499.2   1018.1
Pipe Throughput                               12440.0    1447286.5   1163.4
Pipe-based Context Switching                   4000.0     466715.7   1166.8
Process Creation                                126.0      19115.1   1517.1
Shell Scripts (1 concurrent)                     42.4       6564.6   1548.3
Shell Scripts (8 concurrent)                      6.0        949.6   1582.6
System Call Overhead                          15000.0    1085338.3    723.6
                                                                   ========
System Benchmarks Index Score                                        1033.8
At more than 3000 points, the GeekBench results is actually not too bad, presumbly because it does not occupy the CPU for too long and measures more the “burst” result rather than the output over a long period:
System Information
  Platform:                  Linux x86 (32-bit)
  Compiler:                  GCC 4.1.2 20070925 (Red Hat 4.1.2-33)
  Operating System:          Linux 2.6.32-274.7.1.el5.028stab095.1 i686
  Model:                     Linux PC (Intel(R) Xeon(R) CPU           E5506  @ 2.13GHz)
  Motherboard:               Unknown Motherboard
  Processor:                 Intel(R) Xeon(R) CPU           E5506  @ 2.13GHz
  Processor ID:              GenuineIntel Family 6 Model 26 Stepping 5
  Logical Processors:        2
  Physical Processors:       1
  Processor Frequency:       2.13 GHz
  L1 Instruction Cache:      0.00 B
  L1 Data Cache:             0.00 B
  L2 Cache:                  256 KB
  L3 Cache:                  0.00 B
  Bus Frequency:             0.00 Hz
  Memory:                    11.7 GB
  Memory Type:               N/A
  SIMD:                      1
  BIOS:                      N/A
  Processor Model:           Intel(R) Xeon(R) CPU           E5506  @ 2.13GHz
  Processor Cores:           2

Integer
  Blowfish
    single-threaded scalar    1502 ||||||
    multi-threaded scalar     3100 ||||||||||||
  Text Compress
    single-threaded scalar    1692 ||||||
    multi-threaded scalar     2953 |||||||||||
  Text Decompress
    single-threaded scalar    1496 |||||
    multi-threaded scalar     3030 ||||||||||||
  Image Compress
    single-threaded scalar    1265 |||||
    multi-threaded scalar     2412 |||||||||
  Image Decompress
    single-threaded scalar    1184 ||||
    multi-threaded scalar     2316 |||||||||
  Lua
    single-threaded scalar    2373 |||||||||
    multi-threaded scalar     4728 ||||||||||||||||||

Floating Point
  Mandelbrot
    single-threaded scalar    1616 ||||||
    multi-threaded scalar     3116 ||||||||||||
  Dot Product
    single-threaded scalar    2903 |||||||||||
    multi-threaded scalar     5911 |||||||||||||||||||||||
    single-threaded vector    3417 |||||||||||||
    multi-threaded vector     7242 ||||||||||||||||||||||||||||
  LU Decomposition
    single-threaded scalar    2038 ||||||||
    multi-threaded scalar     2063 ||||||||
  Primality Test
    single-threaded scalar    2924 |||||||||||
    multi-threaded scalar     4561 ||||||||||||||||||
  Sharpen Image
    single-threaded scalar    4343 |||||||||||||||||
    multi-threaded scalar     8874 |||||||||||||||||||||||||||||||||||
  Blur Image
    single-threaded scalar    3988 |||||||||||||||
    multi-threaded scalar     7912 |||||||||||||||||||||||||||||||

Memory
  Read Sequential
    single-threaded scalar    2778 |||||||||||
  Write Sequential
    single-threaded scalar    4474 |||||||||||||||||
  Stdlib Allocate
    single-threaded scalar    2804 |||||||||||
  Stdlib Write
    single-threaded scalar    2108 ||||||||
  Stdlib Copy
    single-threaded scalar    4281 |||||||||||||||||

Stream
  Stream Copy
    single-threaded scalar    2371 |||||||||
    single-threaded vector    2640 ||||||||||
  Stream Scale
    single-threaded scalar    2399 |||||||||
    single-threaded vector    2494 |||||||||
  Stream Add
    single-threaded scalar    2029 ||||||||
    single-threaded vector    2446 |||||||||
  Stream Triad
    single-threaded scalar    2151 ||||||||
    single-threaded vector    1918 |||||||

Integer Score:                2337 |||||||||
Floating Point Score:         4350 |||||||||||||||||
Memory Score:                 3289 |||||||||||||
Stream Score:                 2306 |||||||||

Overall Geekbench Score:      3228 ||||||||||||
Testing again is almost the same:
System Information
  Platform:                  Linux x86 (32-bit)
  Compiler:                  GCC 4.1.2 20070925 (Red Hat 4.1.2-33)
  Operating System:          Linux 2.6.32-274.7.1.el5.028stab095.1 i686
  Model:                     Linux PC (Intel(R) Xeon(R) CPU           E5506  @ 2.13GHz)
  Motherboard:               Unknown Motherboard
  Processor:                 Intel(R) Xeon(R) CPU           E5506  @ 2.13GHz
  Processor ID:              GenuineIntel Family 6 Model 26 Stepping 5
  Logical Processors:        2
  Physical Processors:       1
  Processor Frequency:       2.13 GHz
  L1 Instruction Cache:      0.00 B
  L1 Data Cache:             0.00 B
  L2 Cache:                  256 KB
  L3 Cache:                  0.00 B
  Bus Frequency:             0.00 Hz
  Memory:                    11.7 GB
  Memory Type:               N/A
  SIMD:                      1
  BIOS:                      N/A
  Processor Model:           Intel(R) Xeon(R) CPU           E5506  @ 2.13GHz
  Processor Cores:           2

Integer
  Blowfish
    single-threaded scalar    1487 |||||
    multi-threaded scalar     2725 ||||||||||
  Text Compress
    single-threaded scalar    1682 ||||||
    multi-threaded scalar     2986 |||||||||||
  Text Decompress
    single-threaded scalar    1718 ||||||
    multi-threaded scalar     3393 |||||||||||||
  Image Compress
    single-threaded scalar    1408 |||||
    multi-threaded scalar     2530 ||||||||||
  Image Decompress
    single-threaded scalar    1304 |||||
    multi-threaded scalar     2516 ||||||||||
  Lua
    single-threaded scalar    2660 ||||||||||
    multi-threaded scalar     5164 ||||||||||||||||||||

Floating Point
  Mandelbrot
    single-threaded scalar    1787 |||||||
    multi-threaded scalar     3533 ||||||||||||||
  Dot Product
    single-threaded scalar    2673 ||||||||||
    multi-threaded scalar     5472 |||||||||||||||||||||
    single-threaded vector    3214 ||||||||||||
    multi-threaded vector     7144 ||||||||||||||||||||||||||||
  LU Decomposition
    single-threaded scalar    1897 |||||||
    multi-threaded scalar     1973 |||||||
  Primality Test
    single-threaded scalar    2677 ||||||||||
    multi-threaded scalar     4190 ||||||||||||||||
  Sharpen Image
    single-threaded scalar    4423 |||||||||||||||||
    multi-threaded scalar     8488 |||||||||||||||||||||||||||||||||
  Blur Image
    single-threaded scalar    4051 ||||||||||||||||
    multi-threaded scalar     8004 ||||||||||||||||||||||||||||||||

Memory
  Read Sequential
    single-threaded scalar    2868 |||||||||||
  Write Sequential
    single-threaded scalar    4743 ||||||||||||||||||
  Stdlib Allocate
    single-threaded scalar    2864 |||||||||||
  Stdlib Write
    single-threaded scalar    2167 ||||||||
  Stdlib Copy
    single-threaded scalar    4365 |||||||||||||||||

Stream
  Stream Copy
    single-threaded scalar    2389 |||||||||
    single-threaded vector    2850 |||||||||||
  Stream Scale
    single-threaded scalar    2388 |||||||||
    single-threaded vector    2559 ||||||||||
  Stream Add
    single-threaded scalar    2359 |||||||||
    single-threaded vector    2755 |||||||||||
  Stream Triad
    single-threaded scalar    2490 |||||||||
    single-threaded vector    2121 ||||||||

Integer Score:                2464 |||||||||
Floating Point Score:         4251 |||||||||||||||||
Memory Score:                 3401 |||||||||||||
Stream Score:                 2488 |||||||||

Overall Geekbench Score:      3279 |||||||||||||
Overall, the performance of the VPS is far from impressive, although for such a low price, it is already quite good when the VPS is online and running and is usable to perform basic functions as a server.
Customer Service and Support
Although DotVPS advertise 24/7 support on their web page, I believe it just means you can submit the ticket at any time, however when the support would reply is when they get to work in Europe. My first ticket sent at 10:44am was responded at 7:47am the next day, and the ticket sent at 11:54am was responded at 10:41am the next day, almost 24 hours, although the reply of that ticket, which I sent at 9:28pm on the same day, was responded by 2:30AM the next morning, which was pretty quick. As such, I can only suggest that unless it is a high priority ticket, you should prepare for at least several hours of response time.
Conclusion
If something is too good to be true, it probably is, and this theory is applicable everywhere, including VPS market. What DotVPS has presented was a cheap VPS solution with generous resources at an incredible low price. As such, the VPS itself is able to run most of the time (I have got several notifications from UptimeRobots on different days to inform me the VPS is down, one of them actually happened on the day I signed up), however the disk I/O and network are low and the customer support, although reasonable, is definitely not very fast. Hence, if you are looking for a large VPS to play with, or just looking for a VPS that is just for yourself with no uptime requirements and performance requirements, this is something that is completely fine, otherwise, spending a bit more or try to find a smaller box with less resources is perhaps what I would do.
Would you be willing to review us again after we move to our new netherlands locations?
@Jack: Sure, I will sign up as a regular customer as soon as I get through the list. Thanks a lot for the update!
It will be a few weeks yet.. hoping for around 23rd.
@Jack: Not a problem, I have enough work to keep me busy until June or July at least at the moment 🙂 Thanks for the update once again!